| Param | Original file | Final file |
|---|---|---|
| Filename | modeM0/AS1A10_007T01_9000004276_29702cztM0_level2.evt | modeM0/AS1A10_007T01_9000004276_29702cztM0_level2_quad_clean.evt |
| Size (bytes) | 1,437,301,440 | 227,341,440 |
| Size | 1.3 GB | 216.8 MB |
| Events in quadrant A | 7,875,895 | 1,487,004 |
| Events in quadrant B | 13,032,381 | 1,491,863 |
| Events in quadrant C | 9,367,739 | 1,449,030 |
| Events in quadrant D | 12,222,715 | 1,400,914 |
| Mode SS | |||
|---|---|---|---|
| Quadrant | BADHDUFLAG | Total packets | Discarded packets |
| A | 0 | 314 | 0 |
| B | 0 | 314 | 0 |
| C | 0 | 314 | 0 |
| D | 0 | 314 | 0 |
| Mode M0 | |||
|---|---|---|---|
| Quadrant | BADHDUFLAG | Total packets | Discarded packets |
| A | 0 | 33190 | 3 |
| B | 0 | 48867 | 6 |
| C | 0 | 37359 | 3 |
| D | 0 | 47372 | 3 |
| Mode M9 | |||
|---|---|---|---|
| Quadrant | BADHDUFLAG | Total packets | Discarded packets |
| A | 0 | 37 | 0 |
| B | 0 | 37 | 0 |
| C | 0 | 37 | 0 |
| D | 0 | 37 | 0 |
| Quadrant | Total seconds | Saturated seconds | Saturation percentage |
|---|---|---|---|
| A | 15310 | 153 | 0.999347% |
| B | 15310 | 399 | 2.606140% |
| C | 15311 | 609 | 3.977532% |
| D | 15311 | 525 | 3.428907% |
Noise dominated data is calculated using 1-second bins in cleaned event files. If a bin has >2000 counts, and if more than 50% of those come from <1% of pixels, then it is considered to be noise-dominated and hence unusable.
| Quadrant | # 1 sec bins | Bins with >0 counts | Bins with >2000 counts | High rate bins dominated by noise | Noise dominated (total time) | Noise dominated (detector-on time) | Marked lightcurve |
|---|---|---|---|---|---|---|---|
| A | 19027 | 15311 | 0 | 0 | 0.00% | 0.00% | 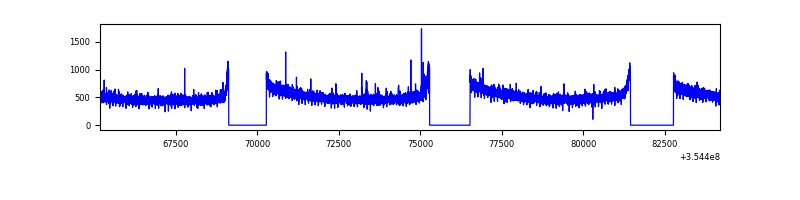 |
| B | 19028 | 15312 | 61 | 61 | 0.32% | 0.40% | 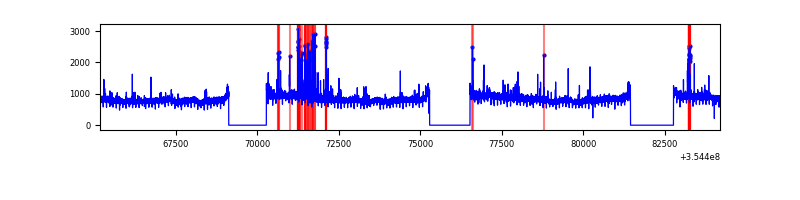 |
| C | 19028 | 15313 | 88 | 88 | 0.46% | 0.57% | 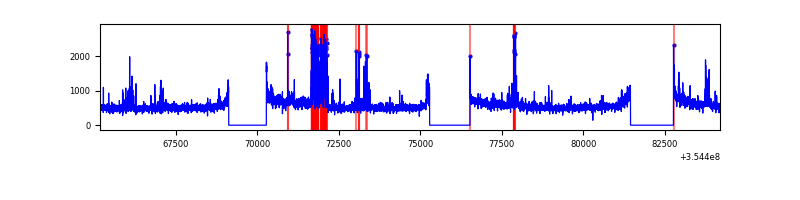 |
| D | 19028 | 15312 | 368 | 368 | 1.93% | 2.40% | 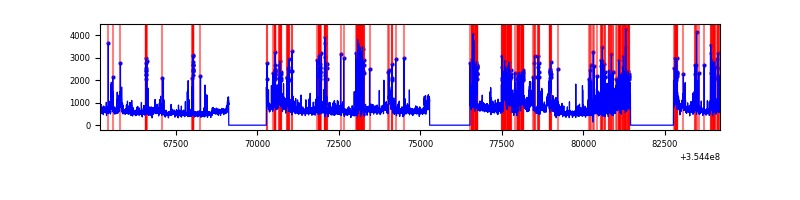 |
Top three noisy pixels from each quadrant. If the there are fewer than three noisy pixels in the level2.evt file, extra rows are filled as -1
| Pixel properties | Quadrant properties | ||||||
|---|---|---|---|---|---|---|---|
| Quadrant | DetID | PixID | Counts | Sigma | Mean | Median | Sigma |
| A | 13 | 254 | 30155 | 69.79 | 2037 | 2001 | 403.4 |
| A | 3 | 137 | 19044 | 42.25 | 2037 | 2001 | 403.4 |
| A | 0 | 226 | 17400 | 38.17 | 2037 | 2001 | 403.4 |
| B | 6 | 159 | 4665670 | 12362.43 | 2019 | 1972 | 377.2 |
| B | 5 | 255 | 225825 | 593.38 | 2019 | 1972 | 377.2 |
| B | 0 | 229 | 95161 | 247.02 | 2019 | 1972 | 377.2 |
| C | 3 | 233 | 1149595 | 2561.61 | 1950 | 1973 | 448.0 |
| C | 14 | 238 | 364469 | 809.13 | 1950 | 1973 | 448.0 |
| C | 10 | 22 | 119100 | 261.44 | 1950 | 1973 | 448.0 |
| D | 7 | 80 | 2478482 | 5372.4 | 1955 | 1909 | 461.0 |
| D | 8 | 195 | 1660013 | 3596.91 | 1955 | 1909 | 461.0 |
| D | 2 | 250 | 293420 | 632.37 | 1955 | 1909 | 461.0 |
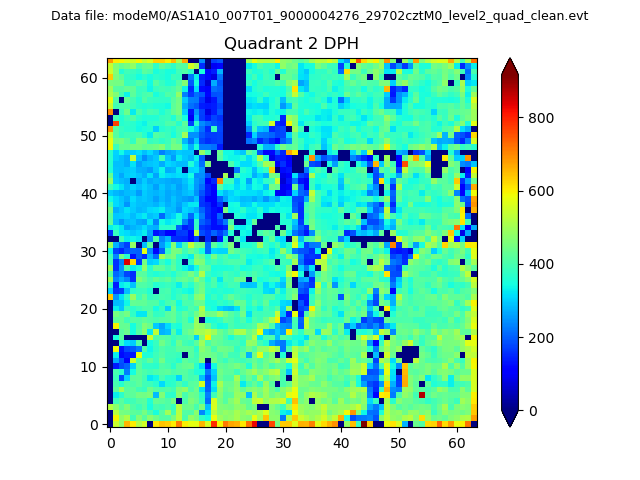
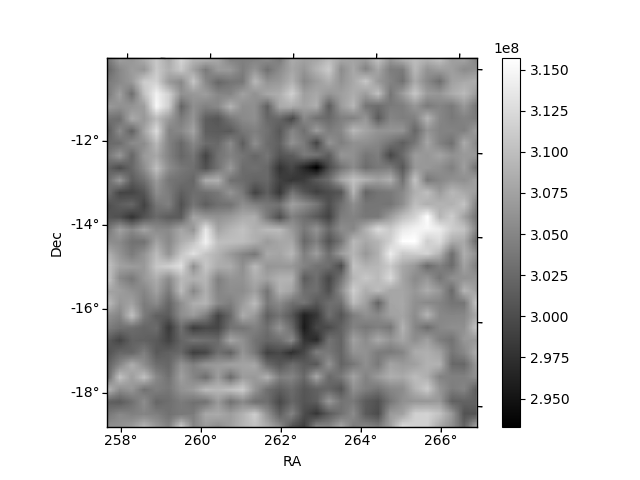
Histogram calculated using DETX and DETY for each event in the final _common_clean file
| Quadrant A | 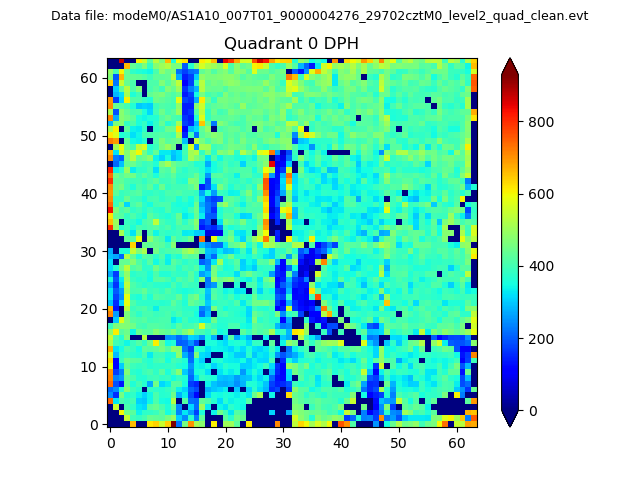 |
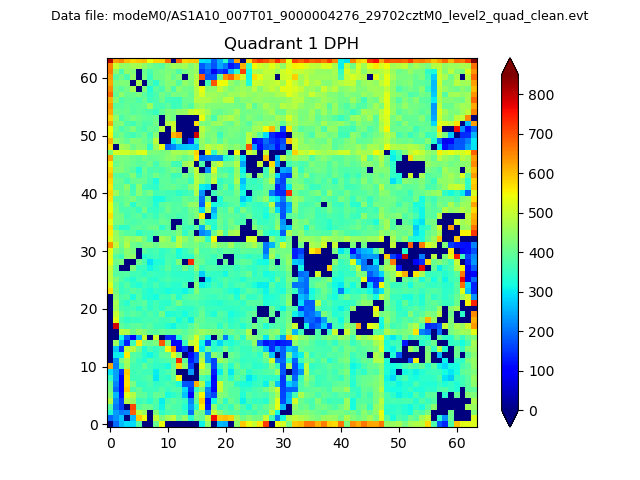 |
Quadrant B |
|---|---|---|---|
| Quadrant D | 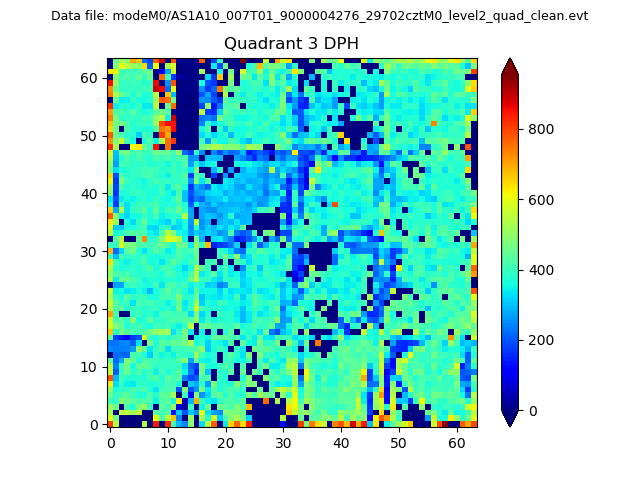 |
 |
Quadrant C |
| Plot type | Count rate plots | Images |
|---|---|---|
| Comparison with Poisson distribution Blue bars denote a histogram of data divided into 1 sec bins. Red curve is a Poisson curve with rate = median count rate of data. |
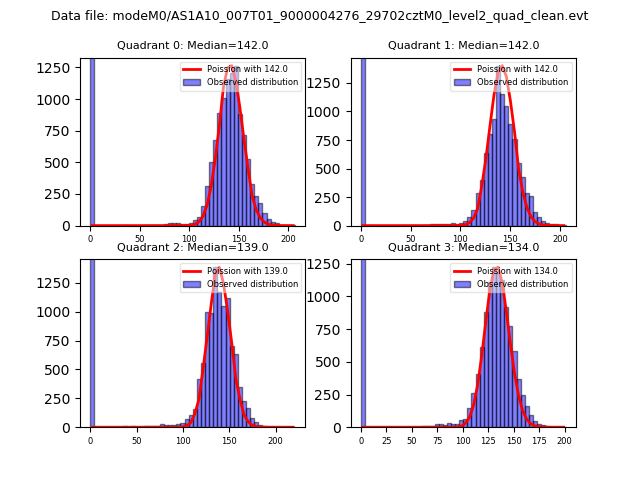 |
 |
| Quadrant-wise count rates Data is divided into 100 sec bins |
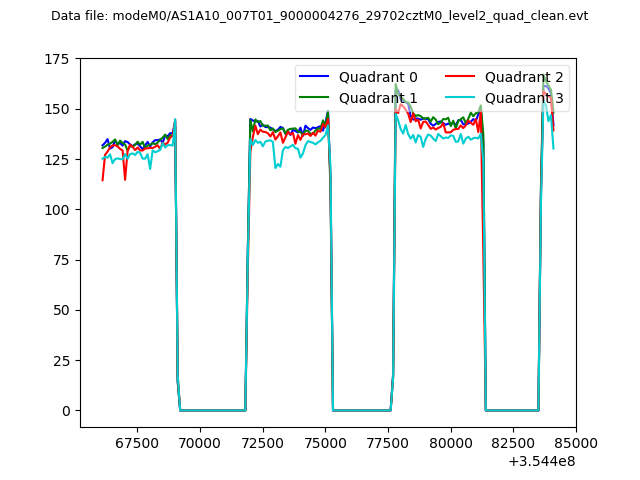 |
|
| Module-wise count rates for Quadrant A Data is divided into 100 sec bins |
 |
 |
| Module-wise count rates for Quadrant B Data is divided into 100 sec bins |
 |
 |
| Module-wise count rates for Quadrant C Data is divided into 100 sec bins |
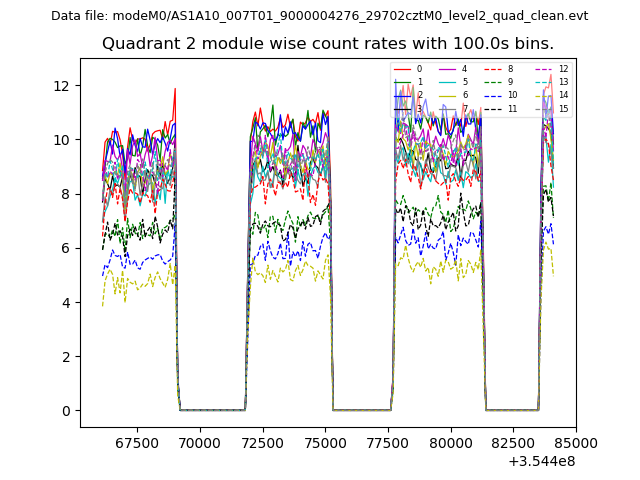 |
 |
| Module-wise count rates for Quadrant D Data is divided into 100 sec bins |
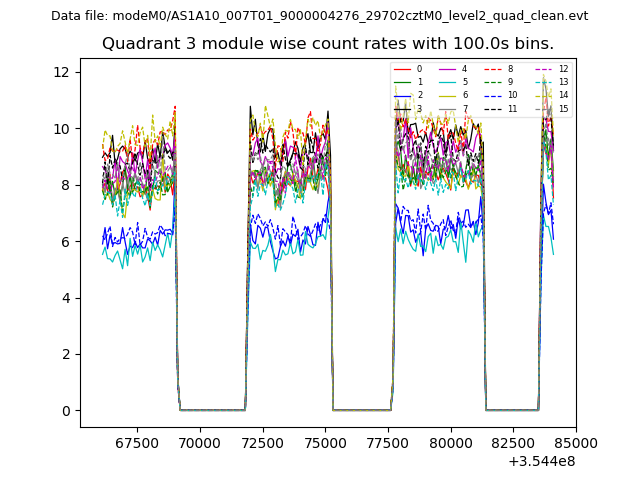 |
 |
| Parameter | Plot |
|---|---|
| CZT HV Monitor | 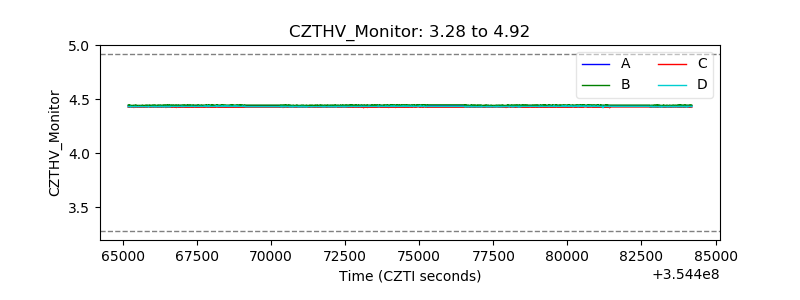 |
| D_VDD | 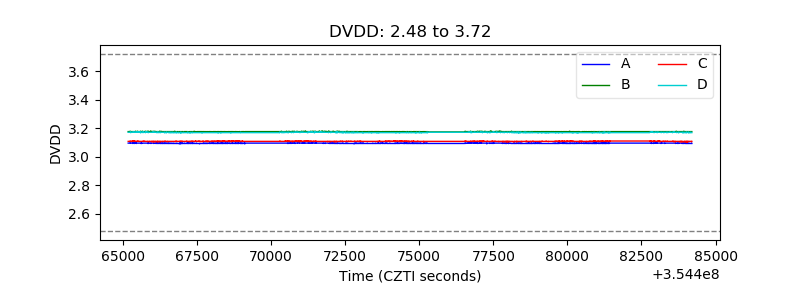 |
| Temperature 1 | 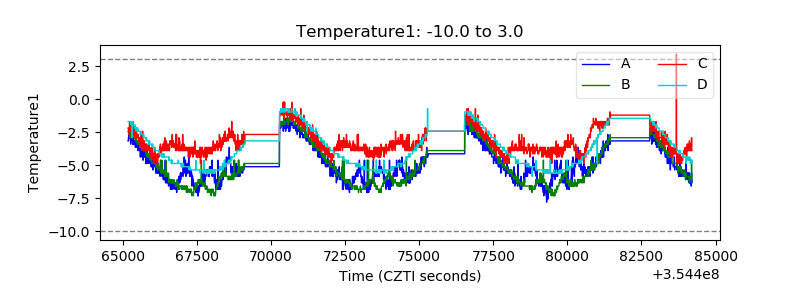 |
| Veto HV Monitor | 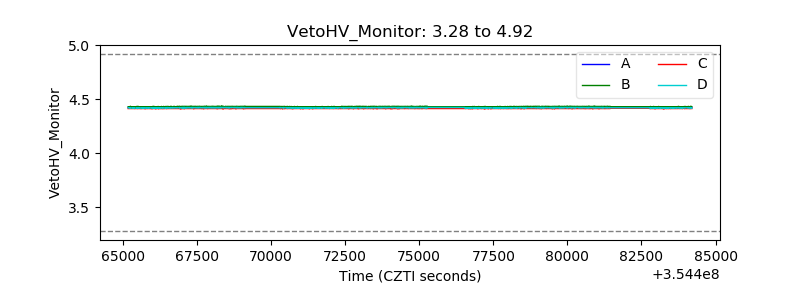 |
| Veto LLD | 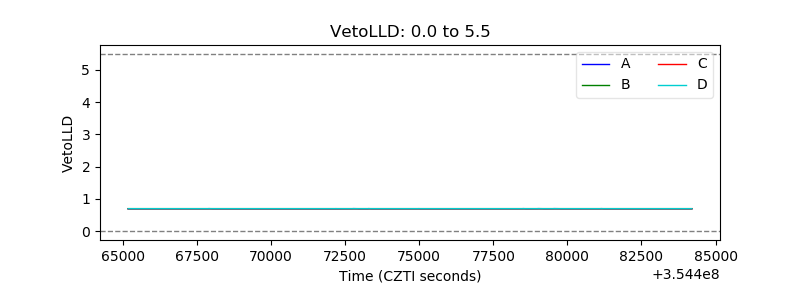 |
| Alpha Counter | 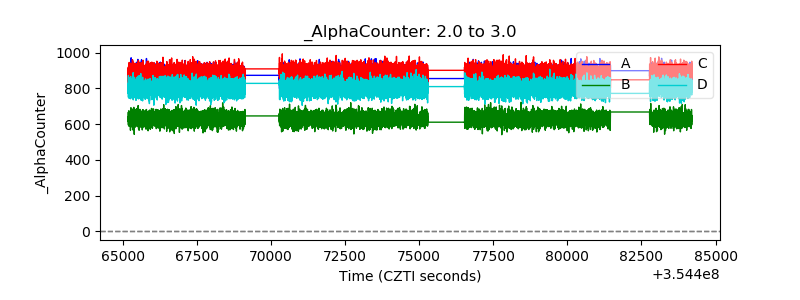 |
| _CPM_Rate | 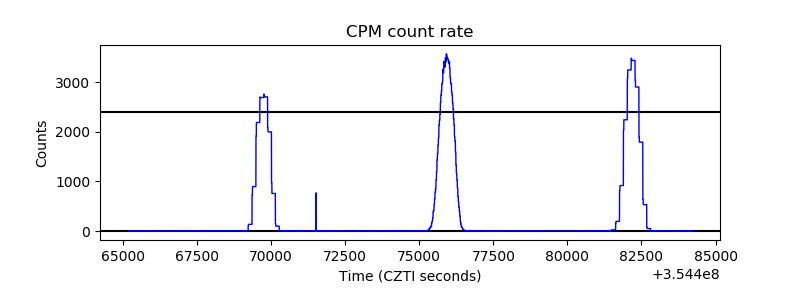 |
| CZT Counter | 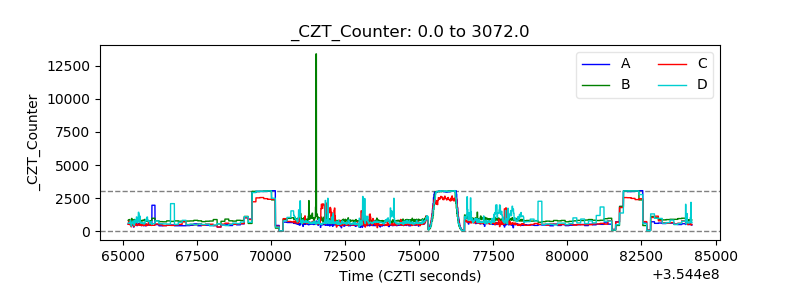 |
| +2.5 Volts monitor | 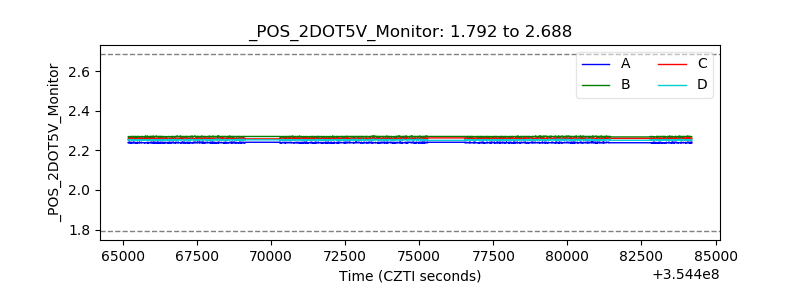 |
| +5 Volts monitor |  |
| _ROLL_ROT | 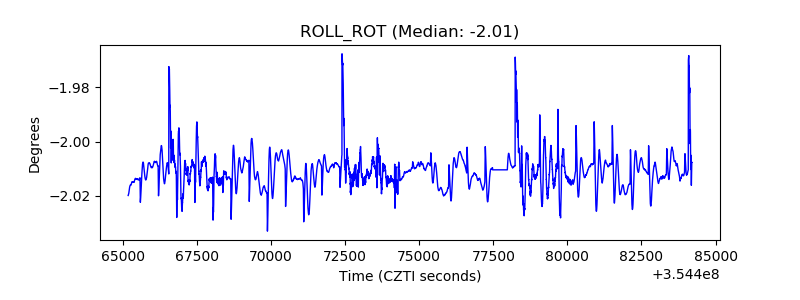 |
| _Roll_DEC | 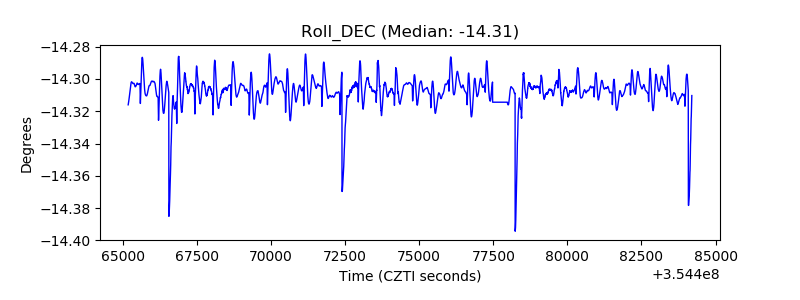 |
| _Roll_RA | 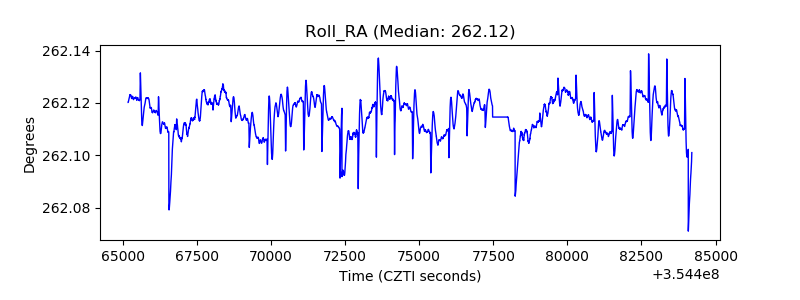 |
| Veto Counter | 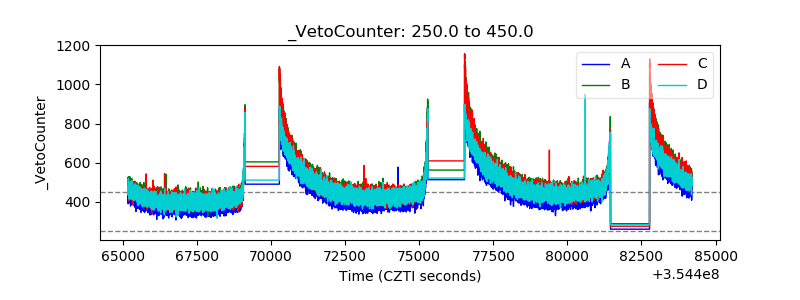 |