| Param | Original file | Final file |
|---|---|---|
| Filename | modeM0/AS1A10_007T01_9000004276_29703cztM0_level2.evt | modeM0/AS1A10_007T01_9000004276_29703cztM0_level2_quad_clean.evt |
| Size (bytes) | 563,664,960 | 100,382,400 |
| Size | 537.6 MB | 95.7 MB |
| Events in quadrant A | 3,151,890 | 662,913 |
| Events in quadrant B | 5,201,081 | 675,437 |
| Events in quadrant C | 3,771,424 | 654,574 |
| Events in quadrant D | 4,534,690 | 622,169 |
| Mode SS | |||
|---|---|---|---|
| Quadrant | BADHDUFLAG | Total packets | Discarded packets |
| A | 0 | 126 | 0 |
| B | 0 | 126 | 0 |
| C | 0 | 126 | 0 |
| D | 0 | 126 | 0 |
| Mode M0 | |||
|---|---|---|---|
| Quadrant | BADHDUFLAG | Total packets | Discarded packets |
| A | 0 | 13098 | 1 |
| B | 0 | 19270 | 3 |
| C | 0 | 15175 | 1 |
| D | 0 | 17655 | 1 |
| Mode M9 | |||
|---|---|---|---|
| Quadrant | BADHDUFLAG | Total packets | Discarded packets |
| A | 0 | 13 | 0 |
| B | 0 | 13 | 0 |
| C | 0 | 13 | 0 |
| D | 0 | 13 | 0 |
| Quadrant | Total seconds | Saturated seconds | Saturation percentage |
|---|---|---|---|
| A | 6078 | 45 | 0.740375% |
| B | 6077 | 157 | 2.583512% |
| C | 6078 | 124 | 2.040145% |
| D | 6078 | 231 | 3.800592% |
Noise dominated data is calculated using 1-second bins in cleaned event files. If a bin has >2000 counts, and if more than 50% of those come from <1% of pixels, then it is considered to be noise-dominated and hence unusable.
| Quadrant | # 1 sec bins | Bins with >0 counts | Bins with >2000 counts | High rate bins dominated by noise | Noise dominated (total time) | Noise dominated (detector-on time) | Marked lightcurve |
|---|---|---|---|---|---|---|---|
| A | 7408 | 6079 | 0 | 0 | 0.00% | 0.00% | 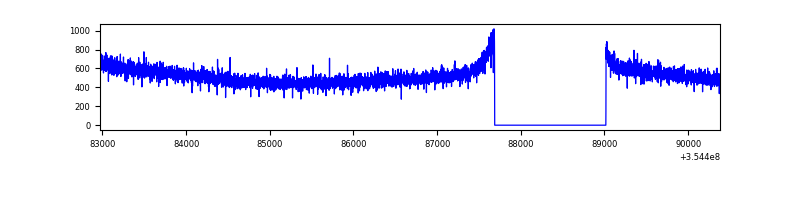 |
| B | 7407 | 6077 | 16 | 16 | 0.22% | 0.26% | 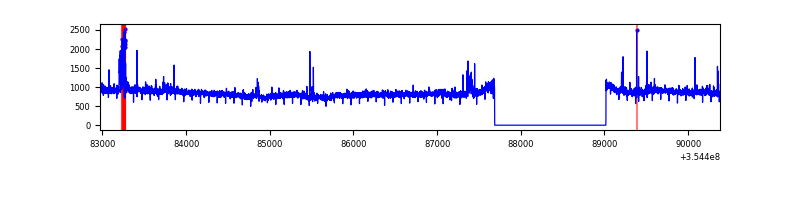 |
| C | 7408 | 6078 | 10 | 10 | 0.13% | 0.16% | 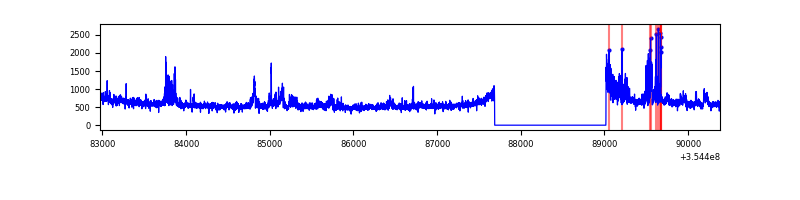 |
| D | 7408 | 6079 | 174 | 174 | 2.35% | 2.86% |  |
Top three noisy pixels from each quadrant. If the there are fewer than three noisy pixels in the level2.evt file, extra rows are filled as -1
| Pixel properties | Quadrant properties | ||||||
|---|---|---|---|---|---|---|---|
| Quadrant | DetID | PixID | Counts | Sigma | Mean | Median | Sigma |
| A | 13 | 254 | 12023 | 69.02 | 817 | 804 | 162.5 |
| A | 3 | 137 | 7574 | 41.65 | 817 | 804 | 162.5 |
| A | 0 | 226 | 6820 | 37.01 | 817 | 804 | 162.5 |
| B | 6 | 159 | 1848945 | 12000.2 | 816 | 797 | 154.0 |
| B | 0 | 229 | 105636 | 680.73 | 816 | 797 | 154.0 |
| B | 15 | 33 | 21651 | 135.41 | 816 | 797 | 154.0 |
| C | 3 | 233 | 413340 | 2241.43 | 794 | 801 | 184.1 |
| C | 14 | 238 | 130503 | 704.7 | 794 | 801 | 184.1 |
| C | 10 | 22 | 112980 | 609.5 | 794 | 801 | 184.1 |
| D | 7 | 80 | 732839 | 3932.83 | 785 | 766 | 186.1 |
| D | 8 | 195 | 565615 | 3034.48 | 785 | 766 | 186.1 |
| D | 2 | 250 | 209063 | 1119.01 | 785 | 766 | 186.1 |
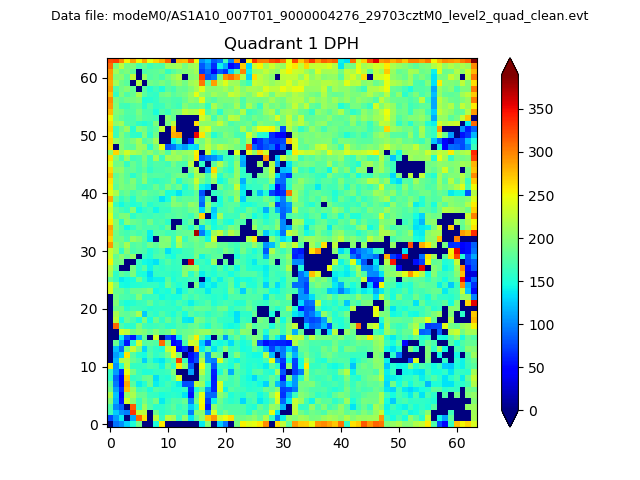
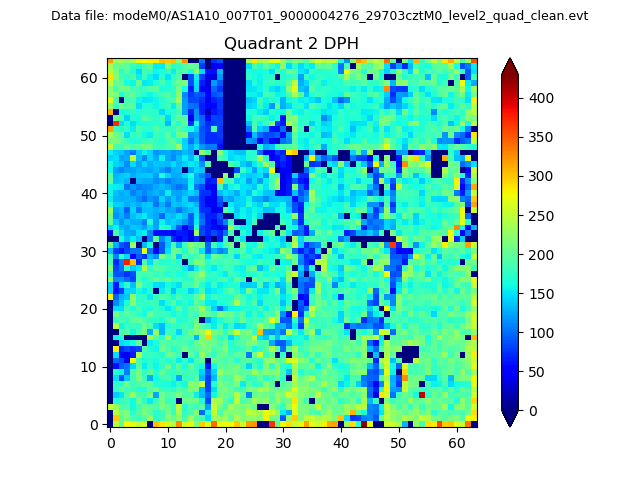
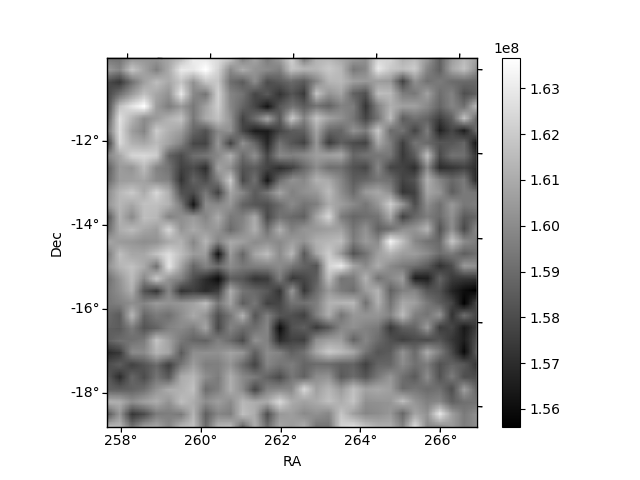
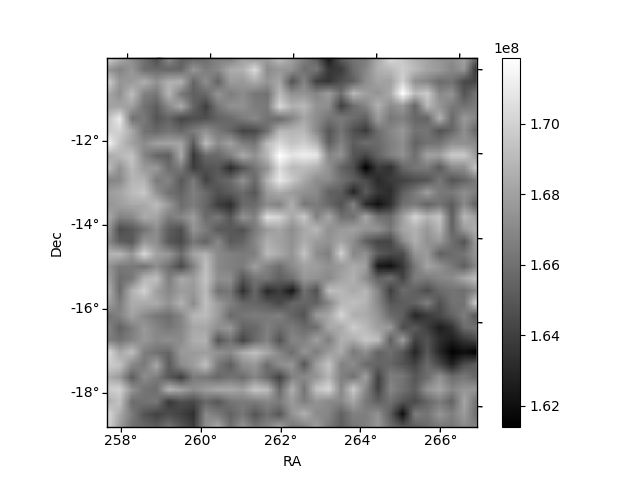
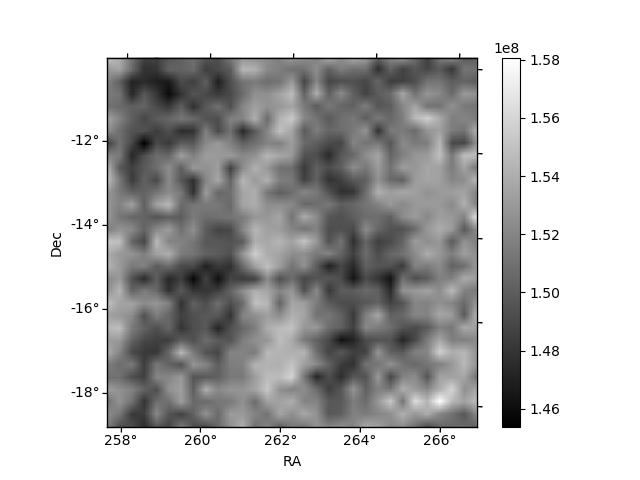
Histogram calculated using DETX and DETY for each event in the final _common_clean file
| Quadrant A | 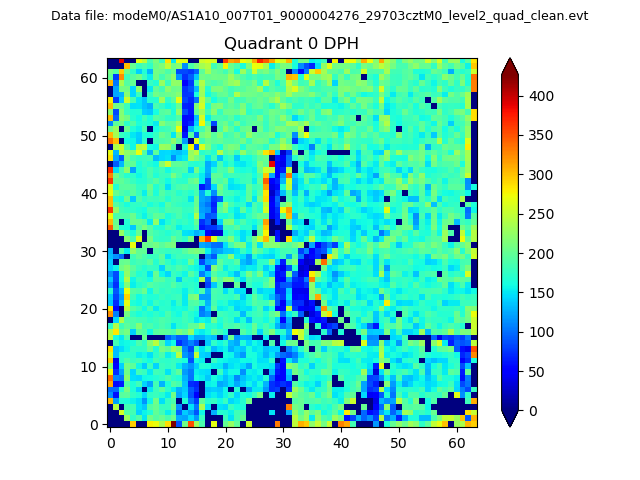 |
 |
Quadrant B |
|---|---|---|---|
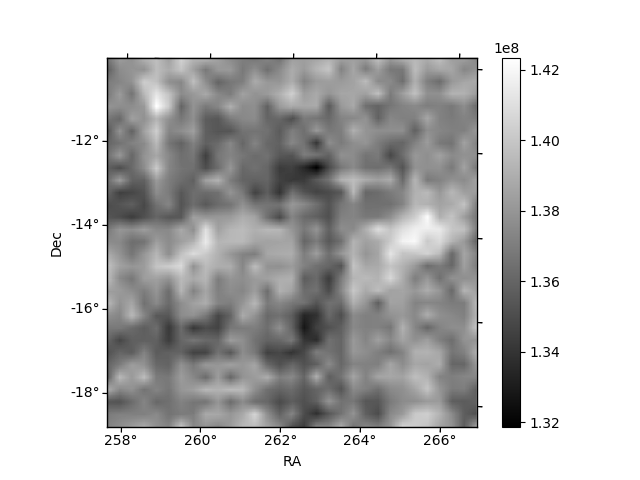
| Quadrant D | 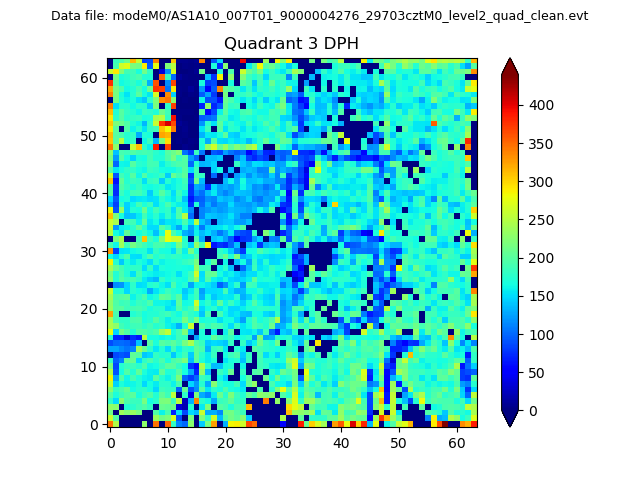 |
 |
Quadrant C |
| Plot type | Count rate plots | Images |
|---|---|---|
| Comparison with Poisson distribution Blue bars denote a histogram of data divided into 1 sec bins. Red curve is a Poisson curve with rate = median count rate of data. |
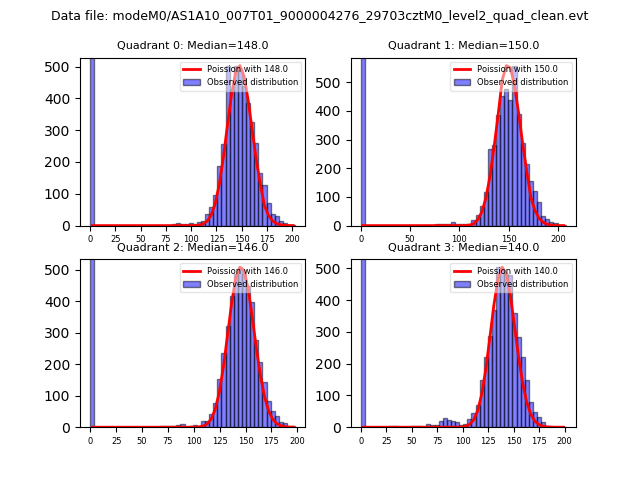 |
 |
| Quadrant-wise count rates Data is divided into 100 sec bins |
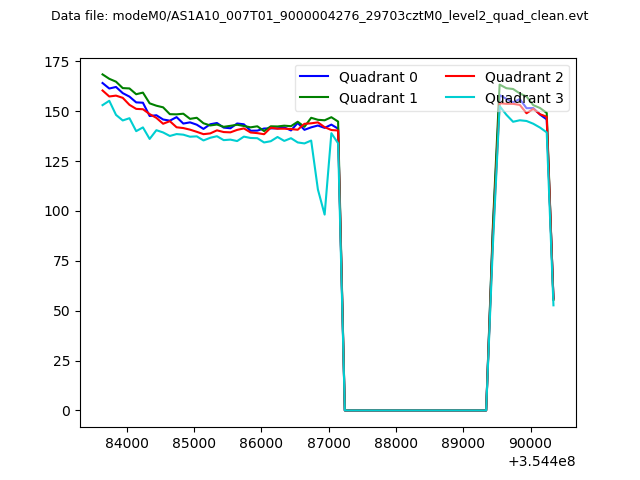 |
|
| Module-wise count rates for Quadrant A Data is divided into 100 sec bins |
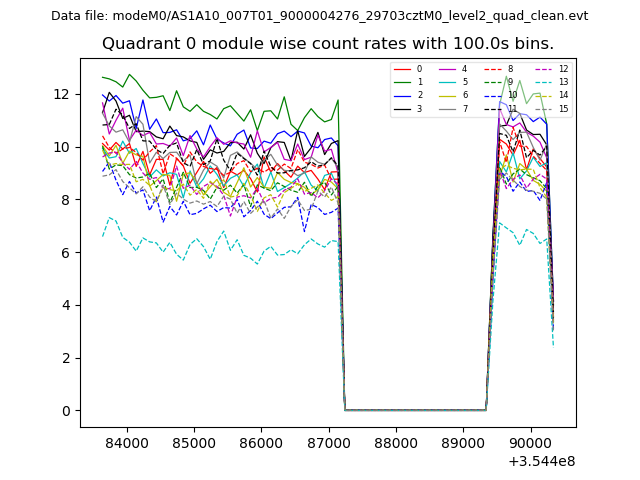 |
 |
| Module-wise count rates for Quadrant B Data is divided into 100 sec bins |
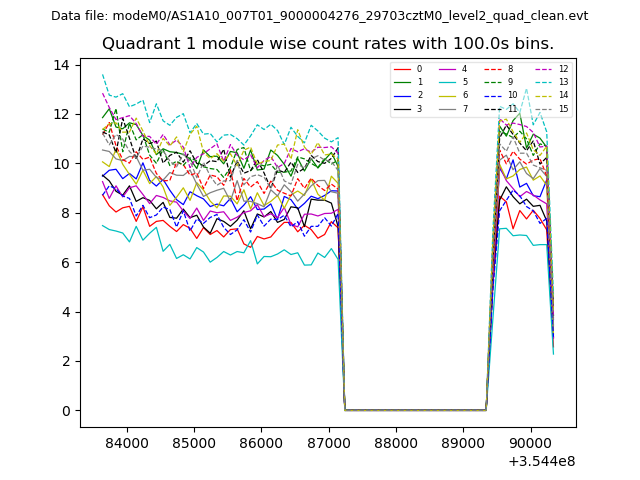 |
 |
| Module-wise count rates for Quadrant C Data is divided into 100 sec bins |
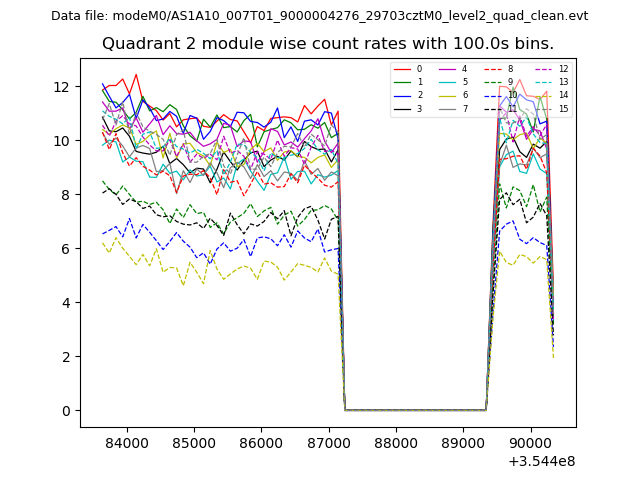 |
 |
| Module-wise count rates for Quadrant D Data is divided into 100 sec bins |
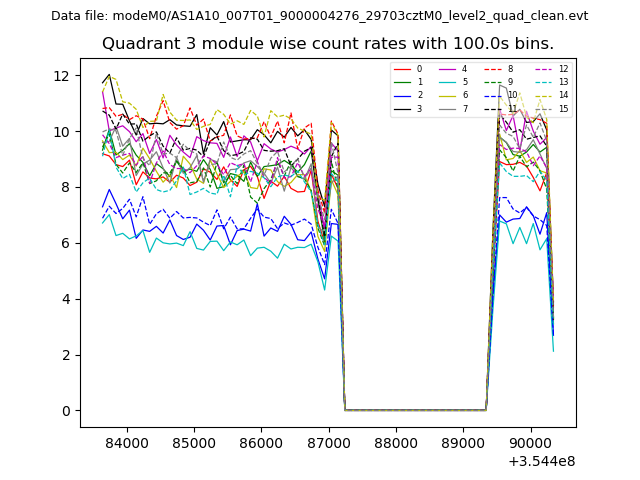 |
 |
| Parameter | Plot |
|---|---|
| CZT HV Monitor | 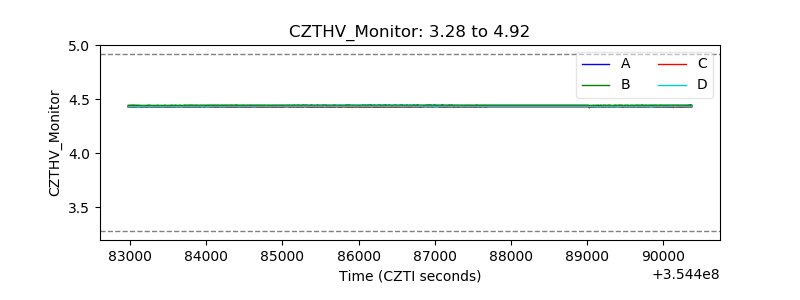 |
| D_VDD |  |
| Temperature 1 | 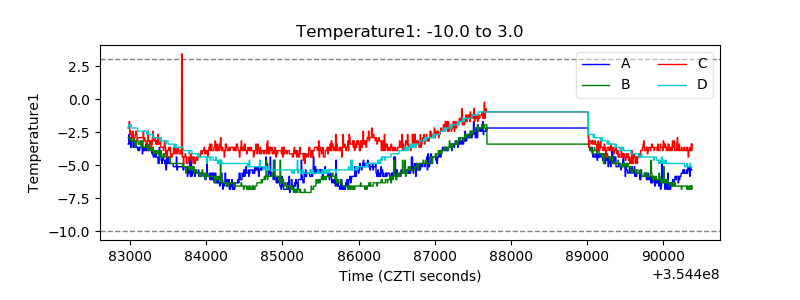 |
| Veto HV Monitor | 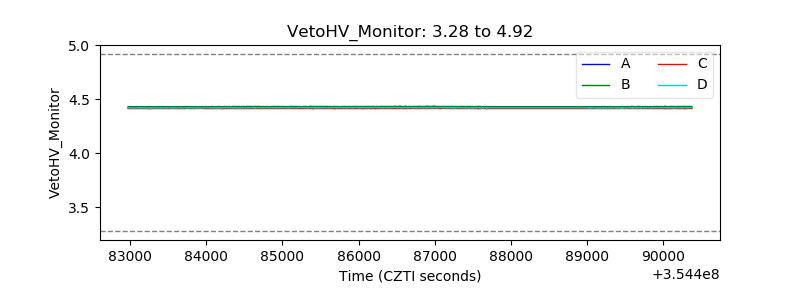 |
| Veto LLD | 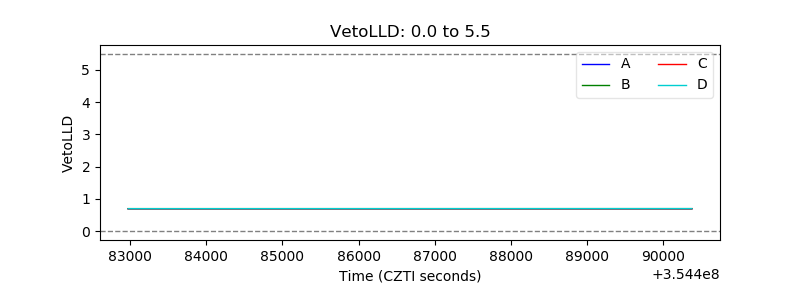 |
| Alpha Counter | 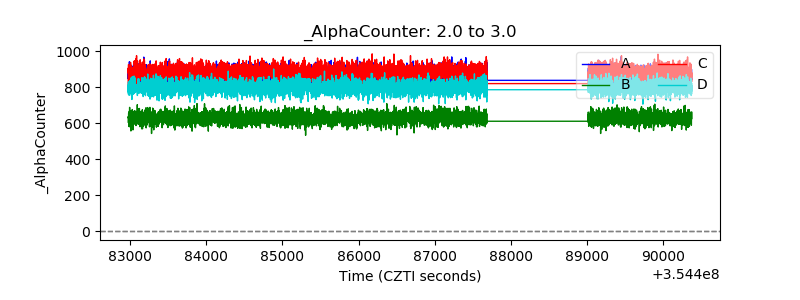 |
| _CPM_Rate |  |
| CZT Counter | 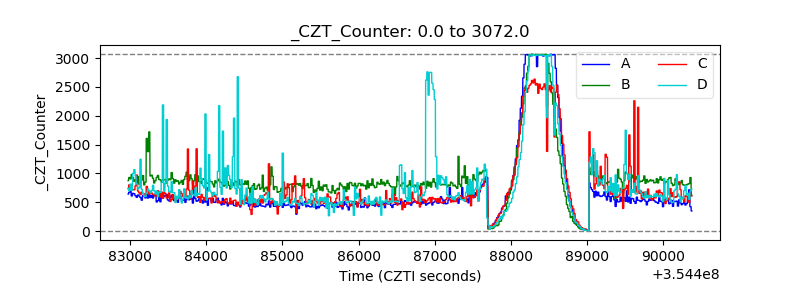 |
| +2.5 Volts monitor |  |
| +5 Volts monitor |  |
| _ROLL_ROT | 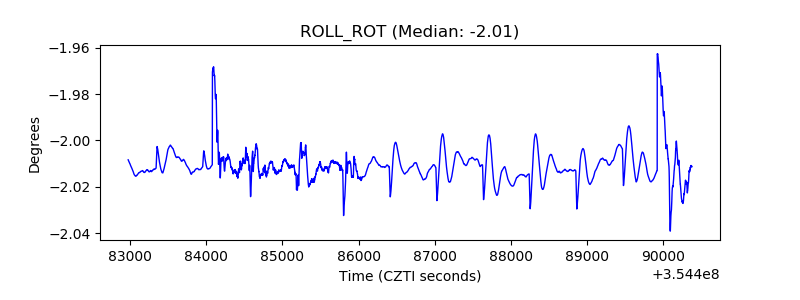 |
| _Roll_DEC | 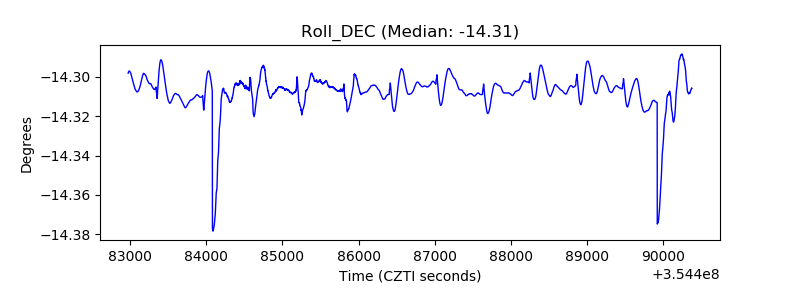 |
| _Roll_RA |  |
| Veto Counter | 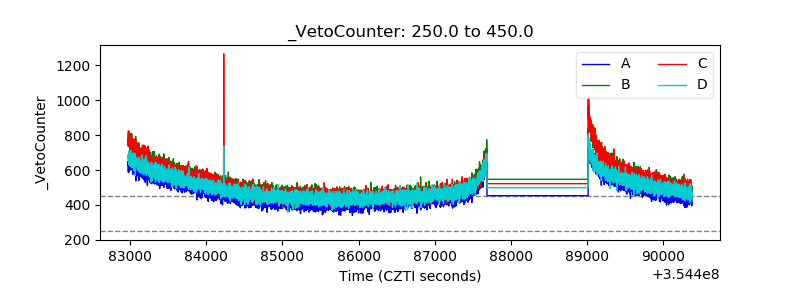 |