| Param | Original file | Final file |
|---|---|---|
| Filename | modeM0/AS1A10_007T01_9000004276_29704cztM0_level2.evt | modeM0/AS1A10_007T01_9000004276_29704cztM0_level2_quad_clean.evt |
| Size (bytes) | 607,066,560 | 103,527,360 |
| Size | 578.9 MB | 98.7 MB |
| Events in quadrant A | 3,179,210 | 682,890 |
| Events in quadrant B | 5,229,044 | 697,352 |
| Events in quadrant C | 4,958,267 | 665,204 |
| Events in quadrant D | 4,590,903 | 648,323 |
| Mode SS | |||
|---|---|---|---|
| Quadrant | BADHDUFLAG | Total packets | Discarded packets |
| A | 0 | 130 | 0 |
| B | 0 | 130 | 0 |
| C | 0 | 130 | 0 |
| D | 0 | 130 | 0 |
| Mode M0 | |||
|---|---|---|---|
| Quadrant | BADHDUFLAG | Total packets | Discarded packets |
| A | 0 | 13392 | 3 |
| B | 0 | 19608 | 3 |
| C | 0 | 19013 | 3 |
| D | 0 | 18011 | 3 |
| Mode M9 | |||
|---|---|---|---|
| Quadrant | BADHDUFLAG | Total packets | Discarded packets |
| A | 0 | 14 | 0 |
| B | 0 | 15 | 0 |
| C | 0 | 15 | 0 |
| D | 0 | 15 | 0 |
| Quadrant | Total seconds | Saturated seconds | Saturation percentage |
|---|---|---|---|
| A | 6322 | 53 | 0.838342% |
| B | 6322 | 143 | 2.261942% |
| C | 6322 | 441 | 6.975641% |
| D | 6322 | 139 | 2.198671% |
Noise dominated data is calculated using 1-second bins in cleaned event files. If a bin has >2000 counts, and if more than 50% of those come from <1% of pixels, then it is considered to be noise-dominated and hence unusable.
| Quadrant | # 1 sec bins | Bins with >0 counts | Bins with >2000 counts | High rate bins dominated by noise | Noise dominated (total time) | Noise dominated (detector-on time) | Marked lightcurve |
|---|---|---|---|---|---|---|---|
| A | 7532 | 6324 | 0 | 0 | 0.00% | 0.00% | 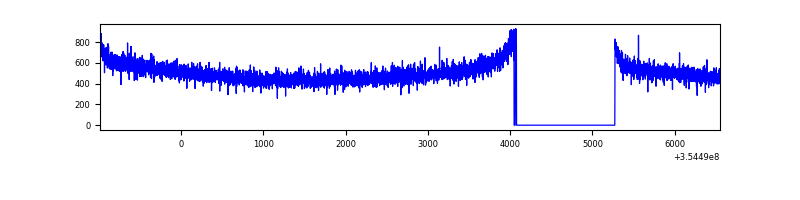 |
| B | 7532 | 6322 | 4 | 4 | 0.05% | 0.06% | 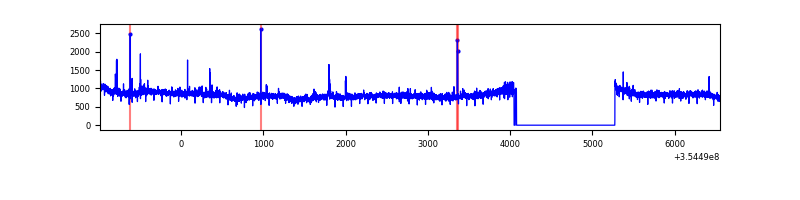 |
| C | 7532 | 6323 | 179 | 179 | 2.38% | 2.83% | 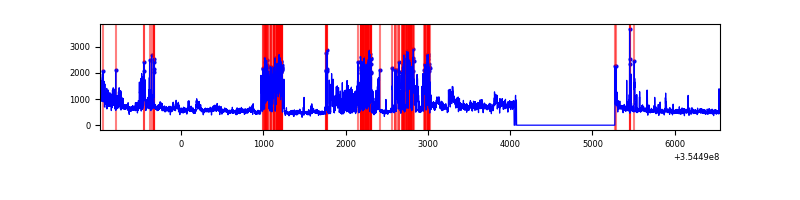 |
| D | 7532 | 6324 | 64 | 64 | 0.85% | 1.01% | 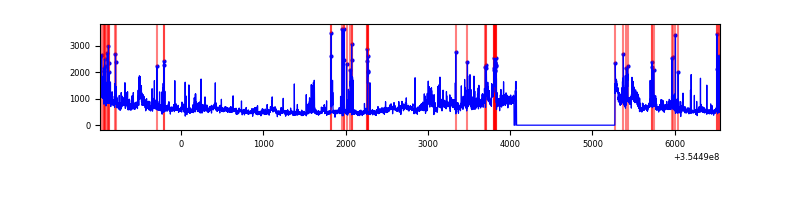 |
Top three noisy pixels from each quadrant. If the there are fewer than three noisy pixels in the level2.evt file, extra rows are filled as -1
| Pixel properties | Quadrant properties | ||||||
|---|---|---|---|---|---|---|---|
| Quadrant | DetID | PixID | Counts | Sigma | Mean | Median | Sigma |
| A | 13 | 254 | 12541 | 71.18 | 823 | 809 | 164.8 |
| A | 3 | 137 | 7936 | 43.24 | 823 | 809 | 164.8 |
| A | 0 | 226 | 6921 | 37.08 | 823 | 809 | 164.8 |
| B | 6 | 159 | 1923572 | 12342.36 | 823 | 804 | 155.8 |
| B | 0 | 229 | 46701 | 294.62 | 823 | 804 | 155.8 |
| B | 12 | 111 | 18911 | 116.23 | 823 | 804 | 155.8 |
| C | 3 | 233 | 1604774 | 8607.58 | 794 | 800 | 186.3 |
| C | 14 | 238 | 130780 | 697.52 | 794 | 800 | 186.3 |
| C | 10 | 22 | 107923 | 574.86 | 794 | 800 | 186.3 |
| D | 8 | 195 | 658856 | 3434.46 | 797 | 777 | 191.6 |
| D | 7 | 80 | 468966 | 2443.44 | 797 | 777 | 191.6 |
| D | 13 | 153 | 155596 | 807.99 | 797 | 777 | 191.6 |
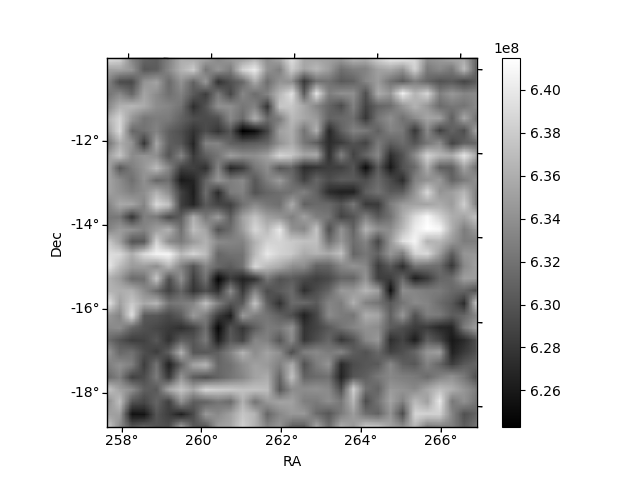
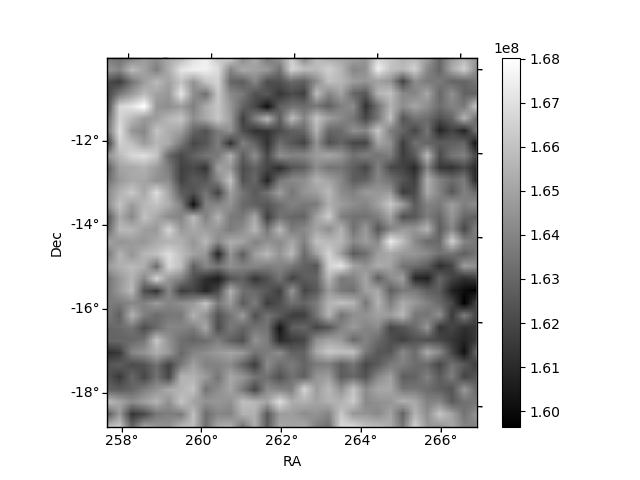
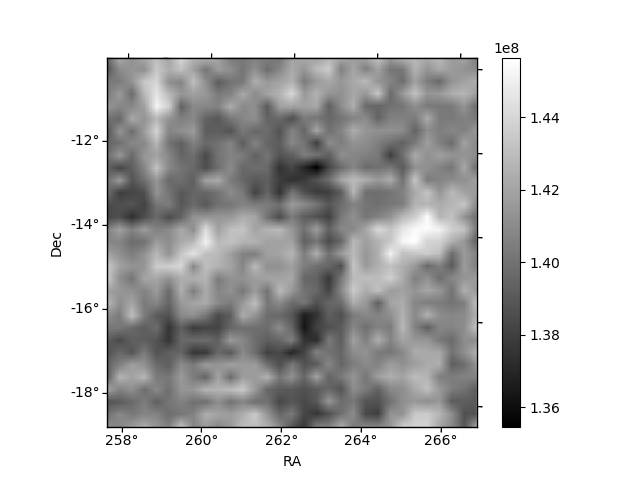
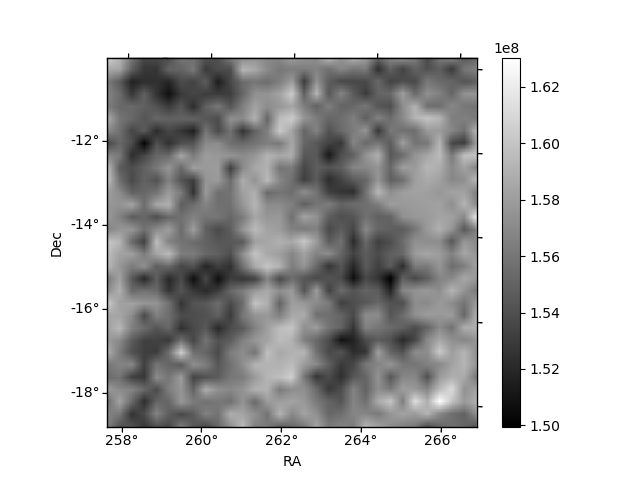
Histogram calculated using DETX and DETY for each event in the final _common_clean file
| Quadrant A | 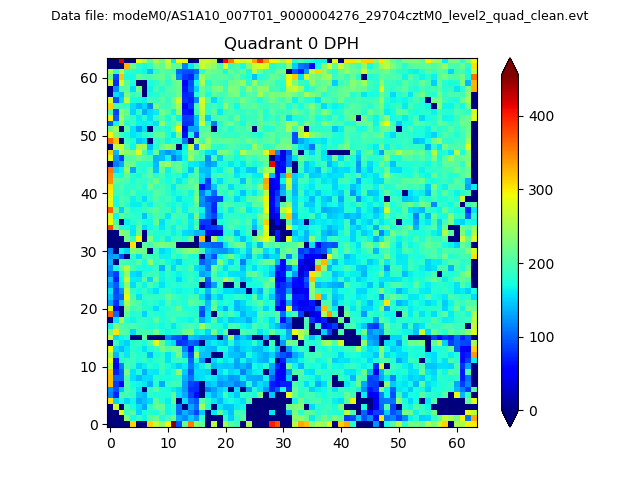 |
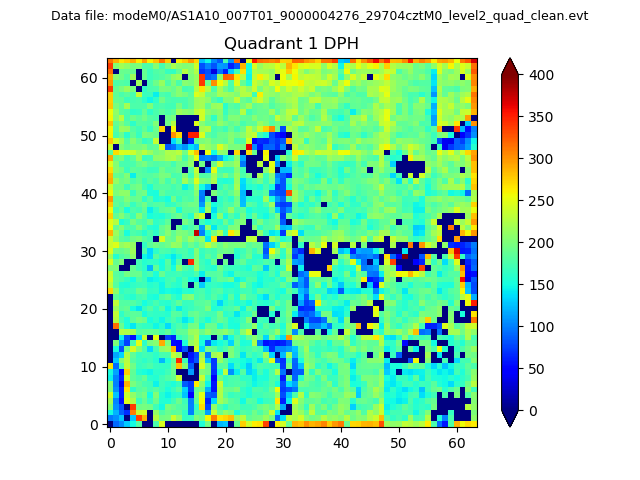 |
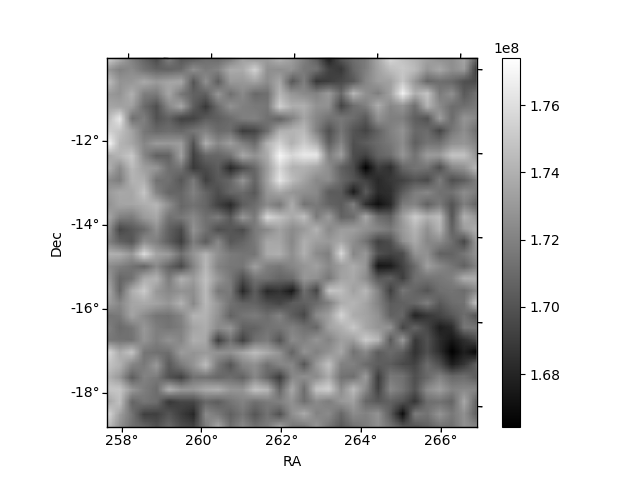
Quadrant B |
|---|---|---|---|
| Quadrant D | 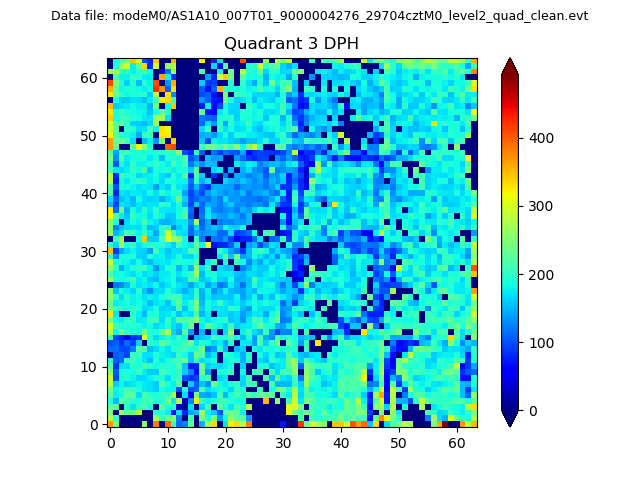 |
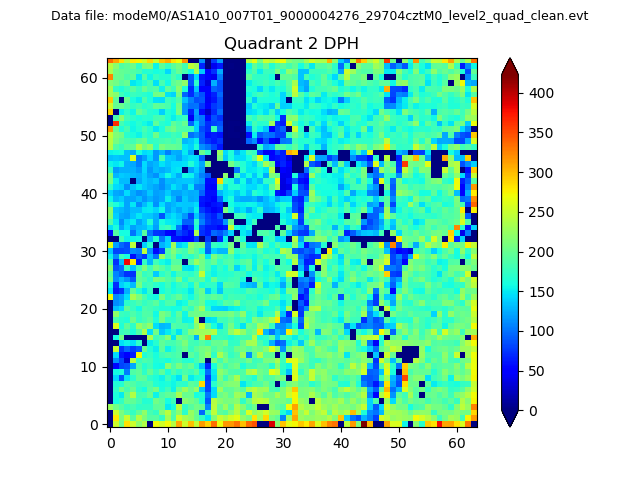 |
Quadrant C |
| Plot type | Count rate plots | Images |
|---|---|---|
| Comparison with Poisson distribution Blue bars denote a histogram of data divided into 1 sec bins. Red curve is a Poisson curve with rate = median count rate of data. |
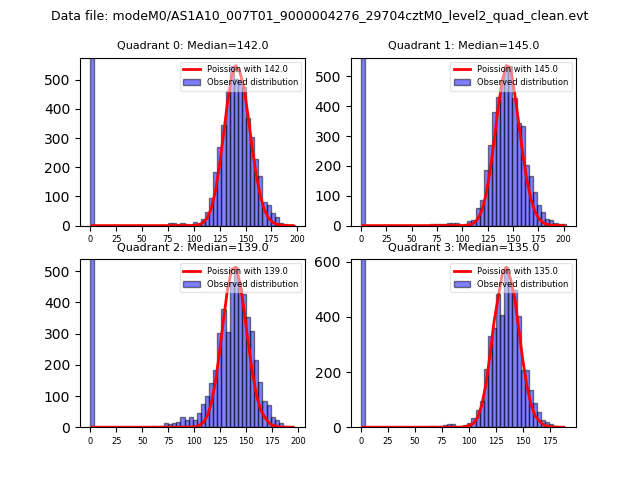 |
 |
| Quadrant-wise count rates Data is divided into 100 sec bins |
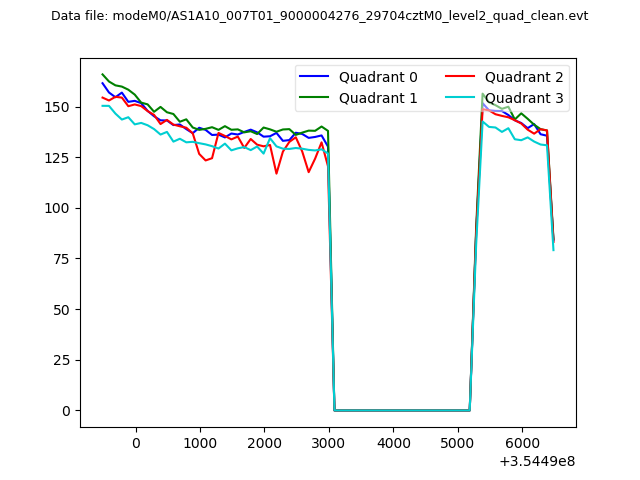 |
|
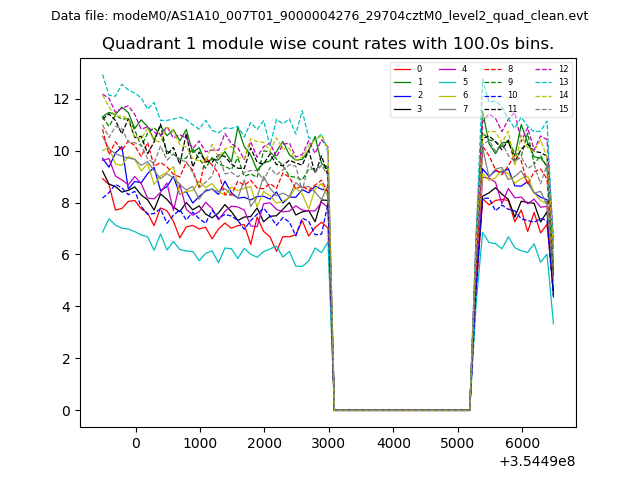
| Module-wise count rates for Quadrant A Data is divided into 100 sec bins |
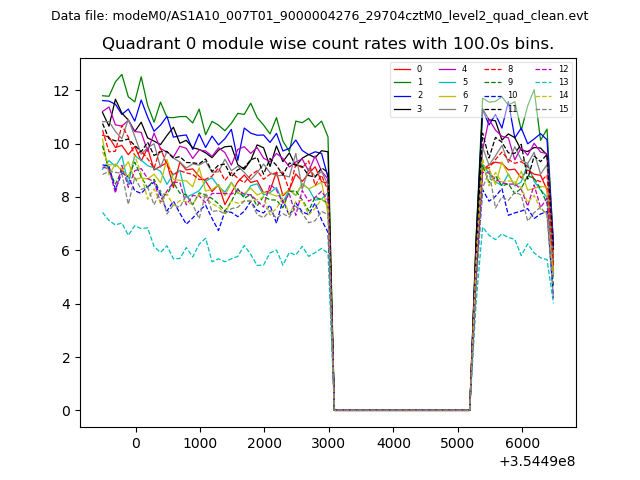 |
 |
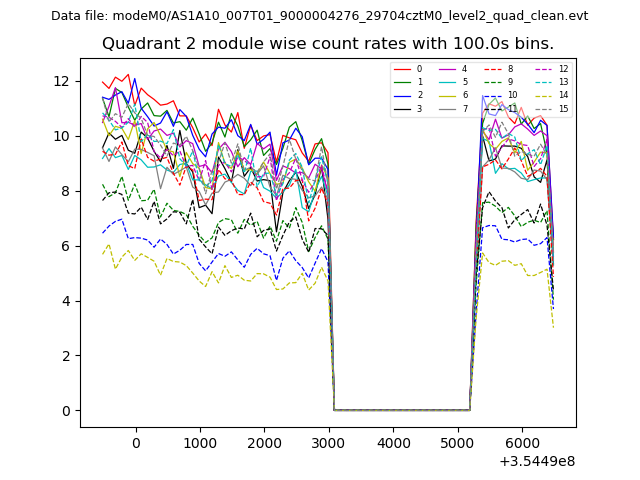
| Module-wise count rates for Quadrant B Data is divided into 100 sec bins |
 |
 |
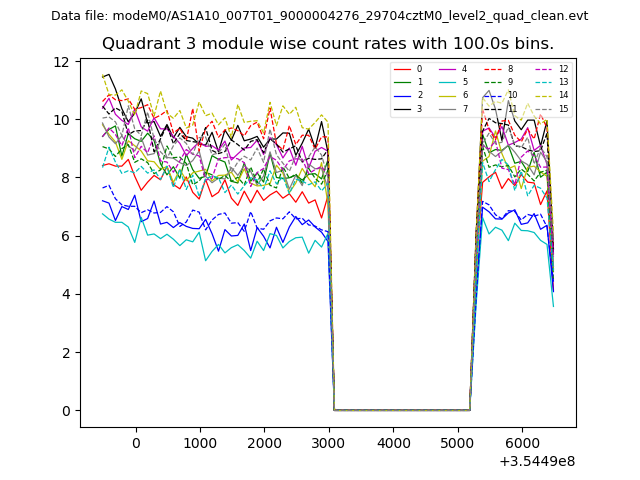
| Module-wise count rates for Quadrant C Data is divided into 100 sec bins |
 |
 |
| Module-wise count rates for Quadrant D Data is divided into 100 sec bins |
 |
 |
| Parameter | Plot |
|---|---|
| CZT HV Monitor | 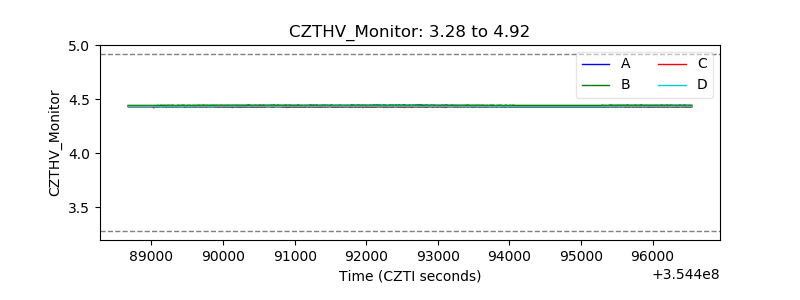 |
| D_VDD | 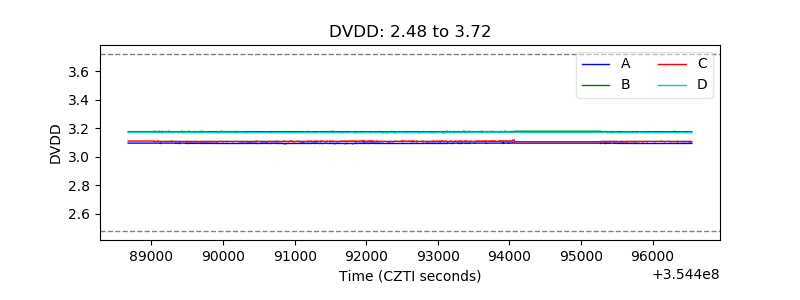 |
| Temperature 1 | 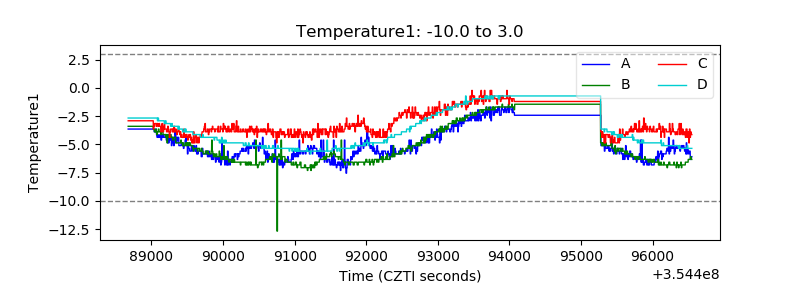 |
| Veto HV Monitor | 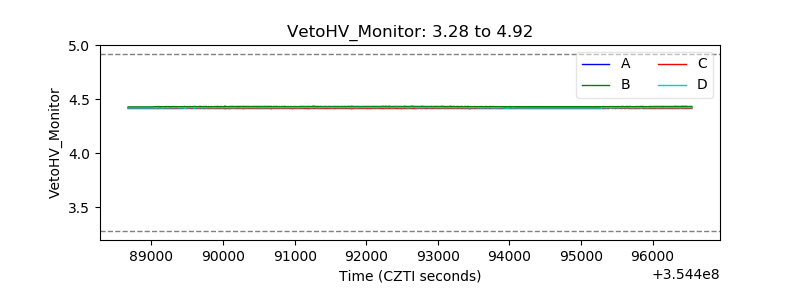 |
| Veto LLD | 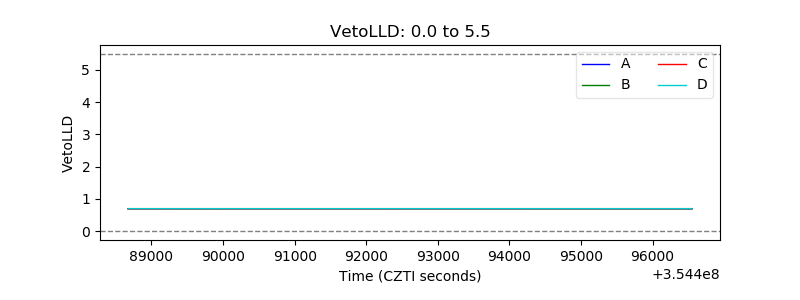 |
| Alpha Counter | 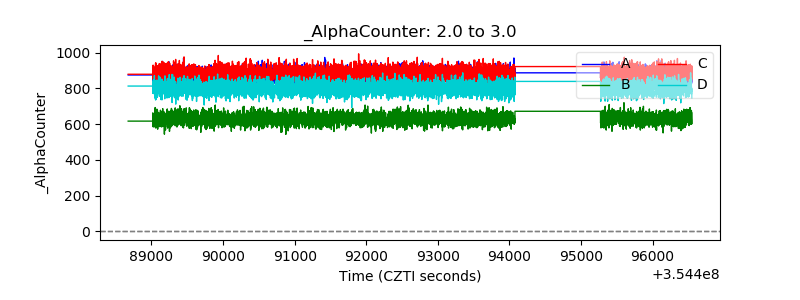 |
| _CPM_Rate | 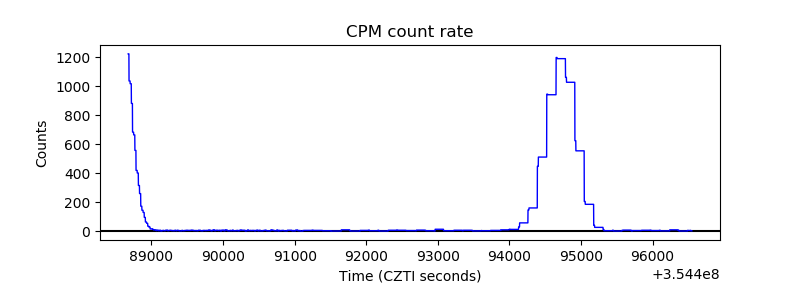 |
| CZT Counter | 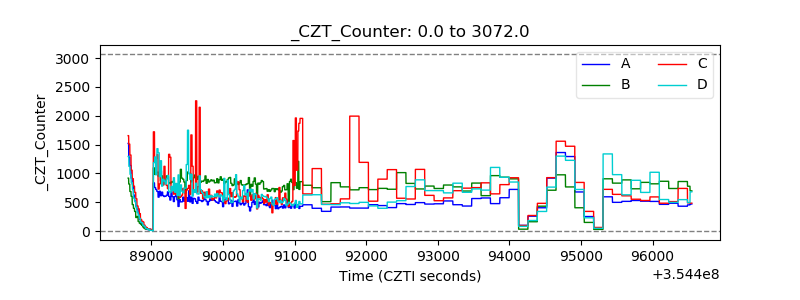 |
| +2.5 Volts monitor |  |
| +5 Volts monitor |  |
| _ROLL_ROT | 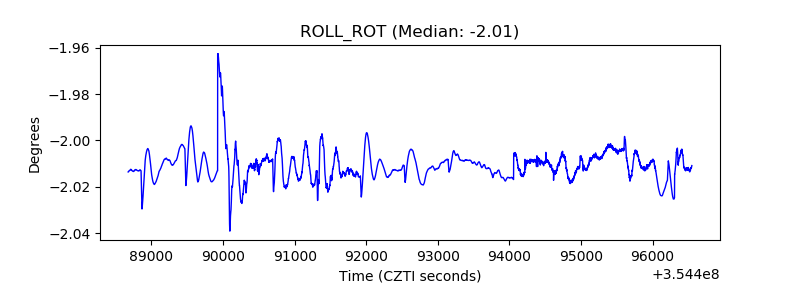 |
| _Roll_DEC |  |
| _Roll_RA | 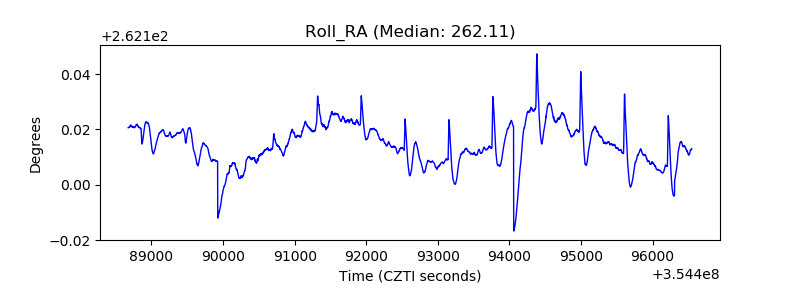 |
| Veto Counter | 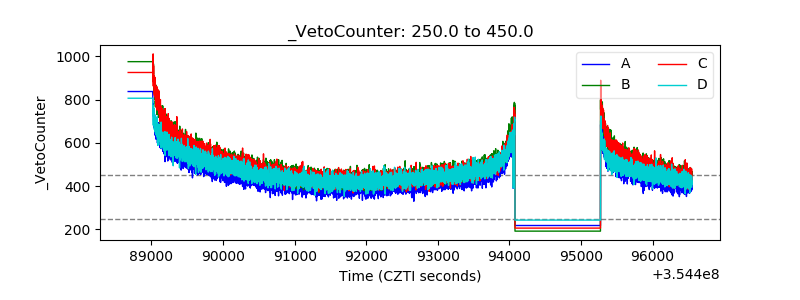 |