| Param | Original file | Final file |
|---|---|---|
| Filename | modeM0/AS1A10_007T01_9000004276_29705cztM0_level2.evt | modeM0/AS1A10_007T01_9000004276_29705cztM0_level2_quad_clean.evt |
| Size (bytes) | 565,116,480 | 103,386,240 |
| Size | 538.9 MB | 98.6 MB |
| Events in quadrant A | 3,215,101 | 669,983 |
| Events in quadrant B | 5,311,429 | 681,302 |
| Events in quadrant C | 3,736,272 | 672,565 |
| Events in quadrant D | 4,400,027 | 641,929 |
| Mode SS | |||
|---|---|---|---|
| Quadrant | BADHDUFLAG | Total packets | Discarded packets |
| A | 0 | 136 | 0 |
| B | 0 | 136 | 0 |
| C | 0 | 136 | 0 |
| D | 0 | 136 | 0 |
| Mode M0 | |||
|---|---|---|---|
| Quadrant | BADHDUFLAG | Total packets | Discarded packets |
| A | 0 | 13816 | 3 |
| B | 0 | 20425 | 2 |
| C | 0 | 15451 | 2 |
| D | 0 | 17548 | 2 |
| Mode M9 | |||
|---|---|---|---|
| Quadrant | BADHDUFLAG | Total packets | Discarded packets |
| A | 0 | 10 | 0 |
| B | 0 | 10 | 0 |
| C | 0 | 10 | 0 |
| D | 0 | 10 | 0 |
| Quadrant | Total seconds | Saturated seconds | Saturation percentage |
|---|---|---|---|
| A | 6673 | 30 | 0.449573% |
| B | 6674 | 141 | 2.112676% |
| C | 6674 | 105 | 1.573269% |
| D | 6674 | 69 | 1.033863% |
Noise dominated data is calculated using 1-second bins in cleaned event files. If a bin has >2000 counts, and if more than 50% of those come from <1% of pixels, then it is considered to be noise-dominated and hence unusable.
| Quadrant | # 1 sec bins | Bins with >0 counts | Bins with >2000 counts | High rate bins dominated by noise | Noise dominated (total time) | Noise dominated (detector-on time) | Marked lightcurve |
|---|---|---|---|---|---|---|---|
| A | 7608 | 6674 | 0 | 0 | 0.00% | 0.00% |  |
| B | 7609 | 6674 | 0 | 0 | 0.00% | 0.00% | 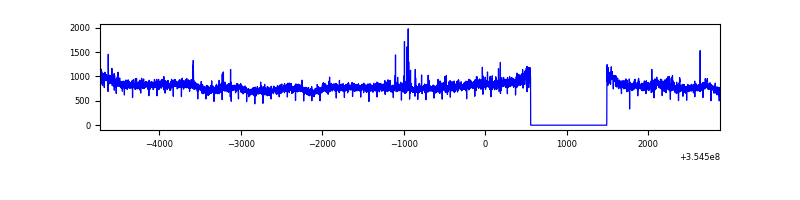 |
| C | 7609 | 6675 | 6 | 6 | 0.08% | 0.09% | 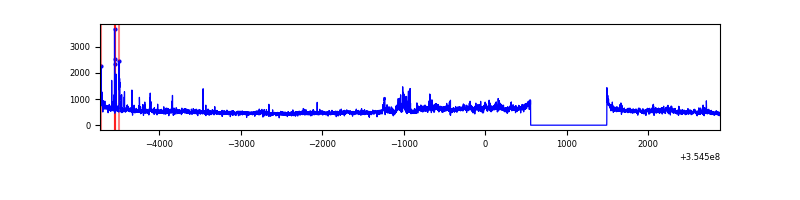 |
| D | 7609 | 6675 | 47 | 47 | 0.62% | 0.70% | 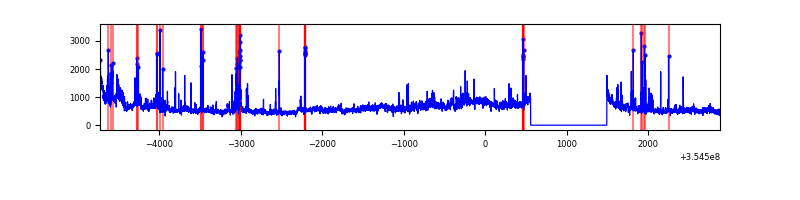 |
Top three noisy pixels from each quadrant. If the there are fewer than three noisy pixels in the level2.evt file, extra rows are filled as -1
| Pixel properties | Quadrant properties | ||||||
|---|---|---|---|---|---|---|---|
| Quadrant | DetID | PixID | Counts | Sigma | Mean | Median | Sigma |
| A | 13 | 254 | 12745 | 70.97 | 833 | 816 | 168.1 |
| A | 3 | 137 | 8387 | 45.04 | 833 | 816 | 168.1 |
| A | 0 | 226 | 7110 | 37.45 | 833 | 816 | 168.1 |
| B | 6 | 159 | 1974292 | 12321.97 | 833 | 814 | 160.2 |
| B | 0 | 229 | 45115 | 276.61 | 833 | 814 | 160.2 |
| B | 12 | 111 | 19968 | 119.59 | 833 | 814 | 160.2 |
| C | 3 | 233 | 373660 | 1948.54 | 814 | 821 | 191.3 |
| C | 14 | 238 | 131382 | 682.34 | 814 | 821 | 191.3 |
| C | 10 | 22 | 35580 | 181.66 | 814 | 821 | 191.3 |
| D | 8 | 195 | 815268 | 4251.32 | 807 | 787 | 191.6 |
| D | 7 | 238 | 158956 | 825.59 | 807 | 787 | 191.6 |
| D | 7 | 80 | 117729 | 610.4 | 807 | 787 | 191.6 |
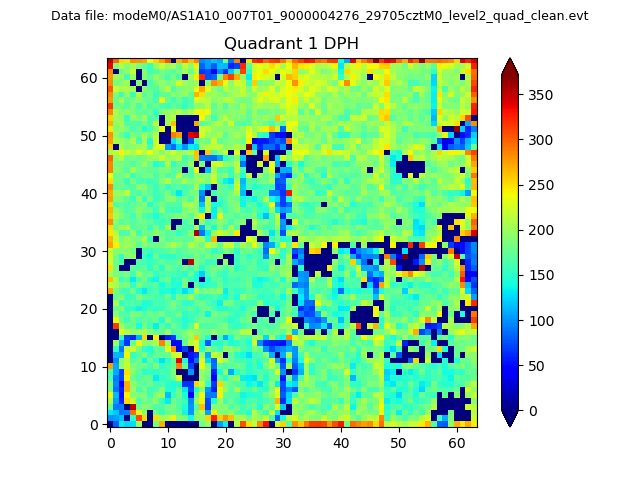
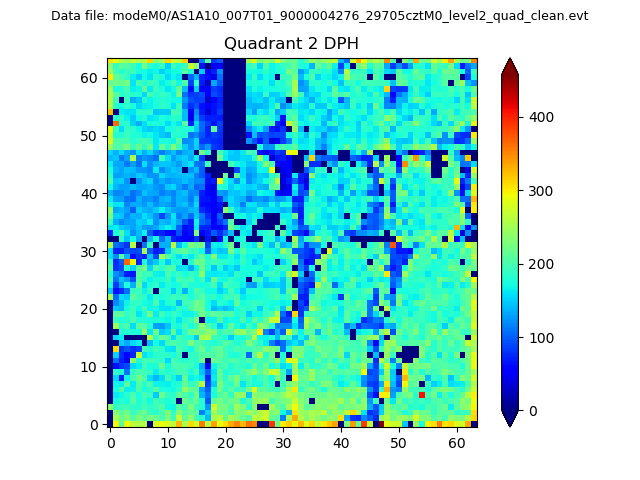
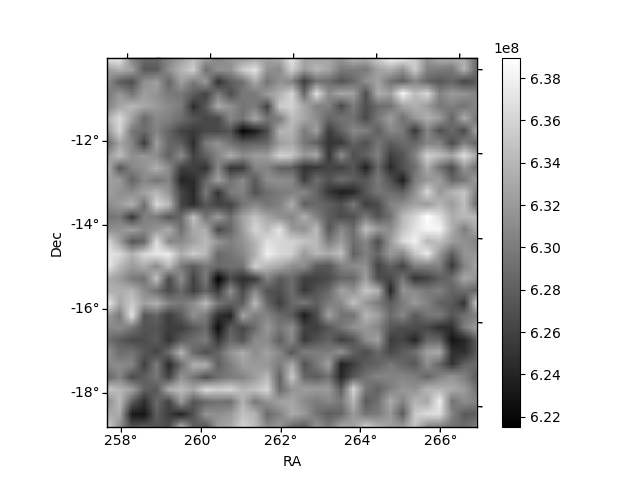
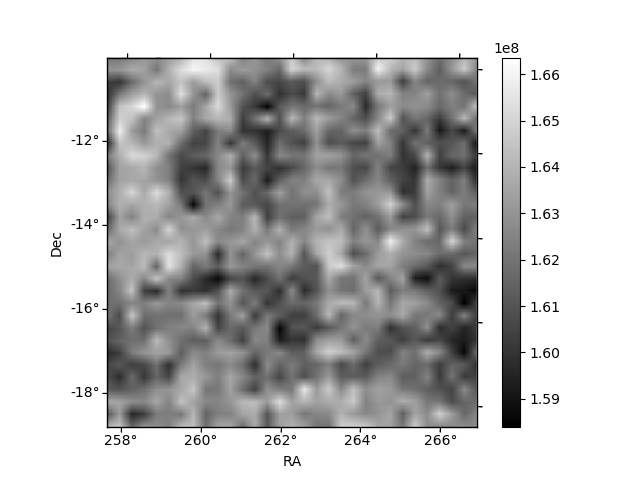
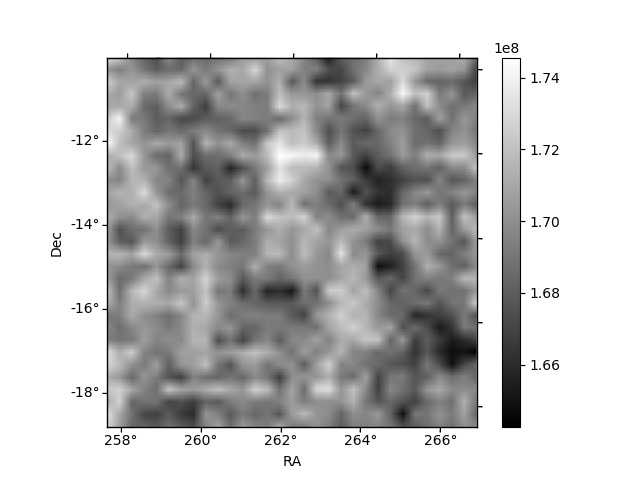
Histogram calculated using DETX and DETY for each event in the final _common_clean file
| Quadrant A | 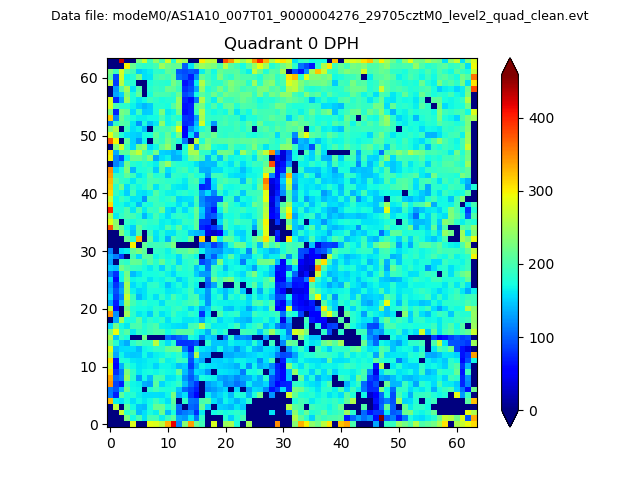 |
 |
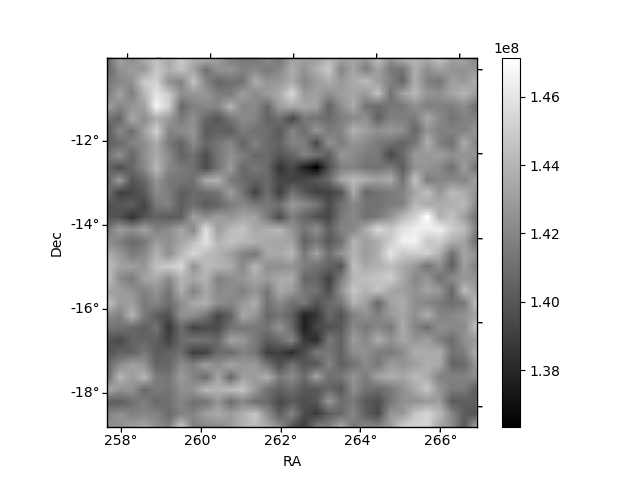
Quadrant B |
|---|---|---|---|
| Quadrant D | 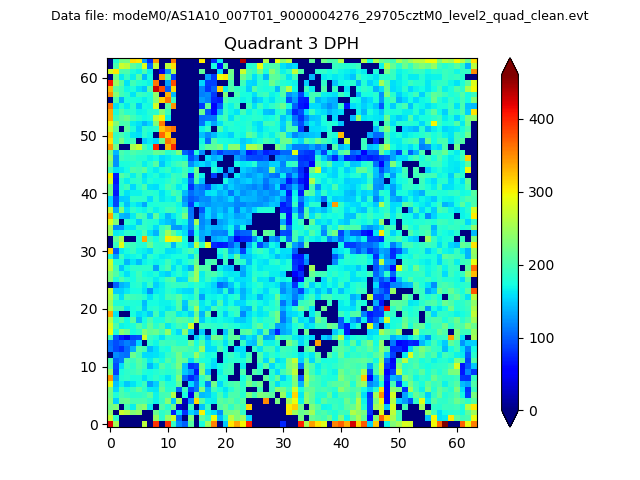 |
 |
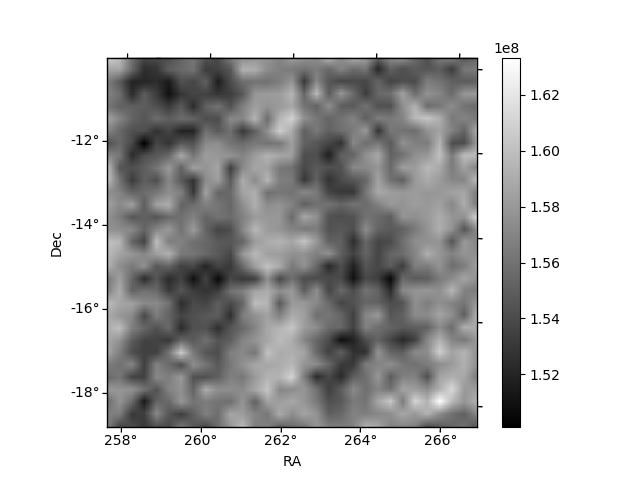
Quadrant C |
| Plot type | Count rate plots | Images |
|---|---|---|
| Comparison with Poisson distribution Blue bars denote a histogram of data divided into 1 sec bins. Red curve is a Poisson curve with rate = median count rate of data. |
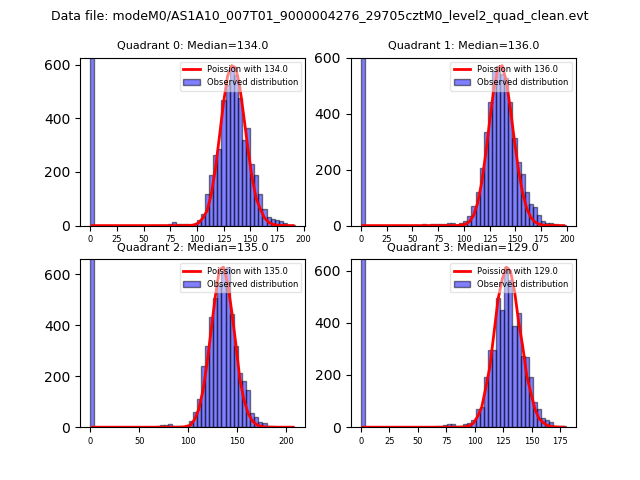 |
 |
| Quadrant-wise count rates Data is divided into 100 sec bins |
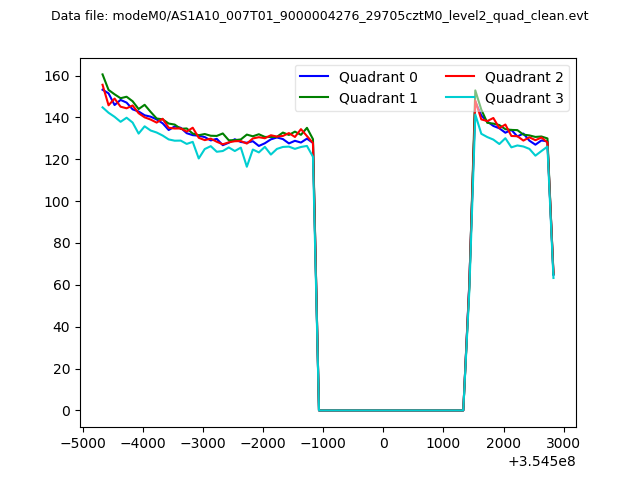 |
|
| Module-wise count rates for Quadrant A Data is divided into 100 sec bins |
 |
 |
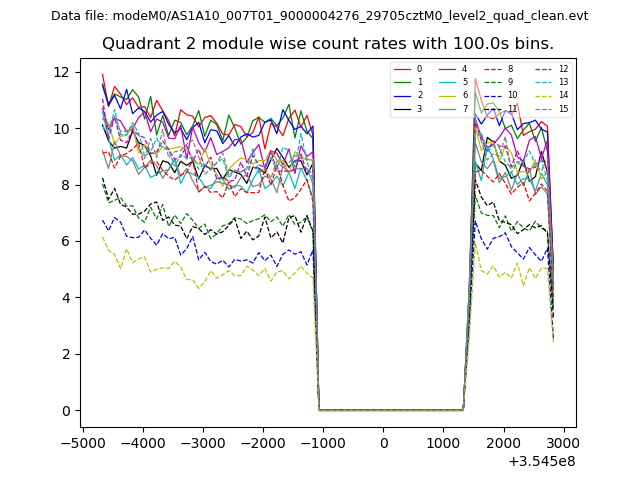
| Module-wise count rates for Quadrant B Data is divided into 100 sec bins |
 |
 |
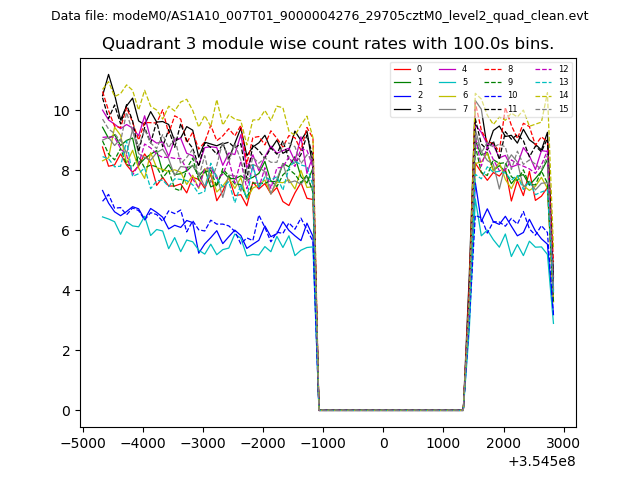
| Module-wise count rates for Quadrant C Data is divided into 100 sec bins |
 |
 |
| Module-wise count rates for Quadrant D Data is divided into 100 sec bins |
 |
 |
| Parameter | Plot |
|---|---|
| CZT HV Monitor | 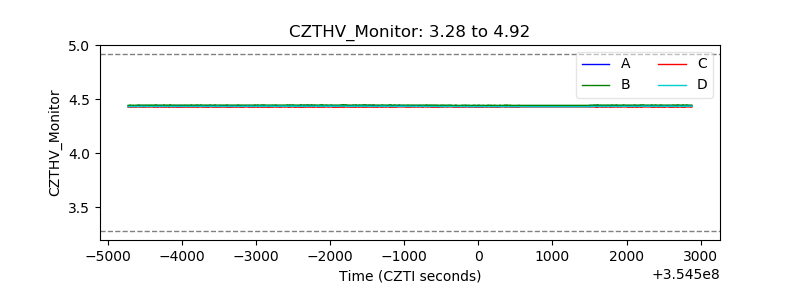 |
| D_VDD | 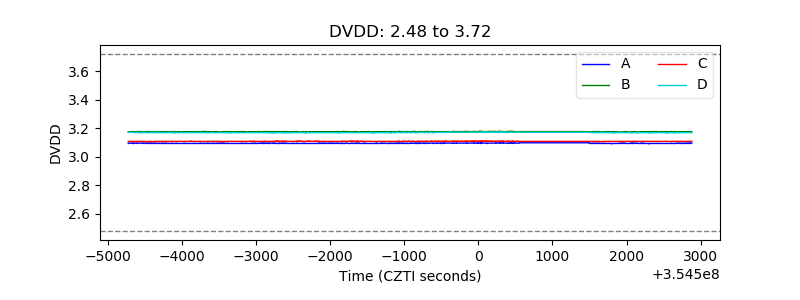 |
| Temperature 1 | 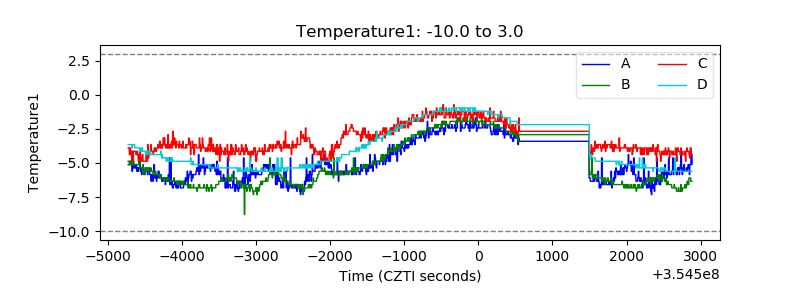 |
| Veto HV Monitor | 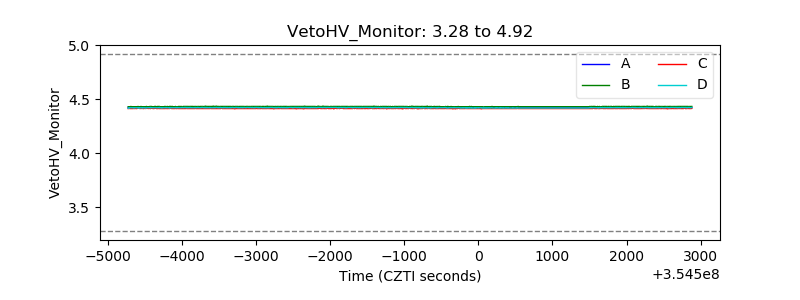 |
| Veto LLD |  |
| Alpha Counter | 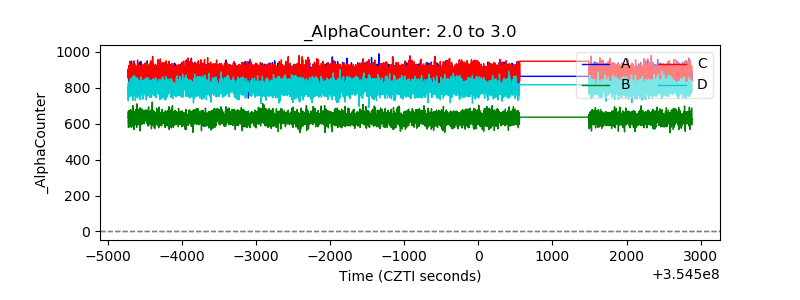 |
| _CPM_Rate | 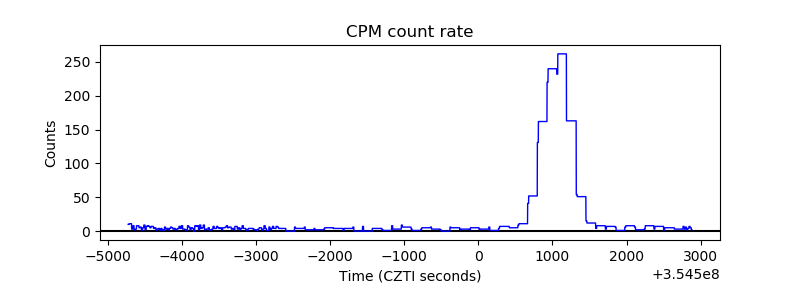 |
| CZT Counter | 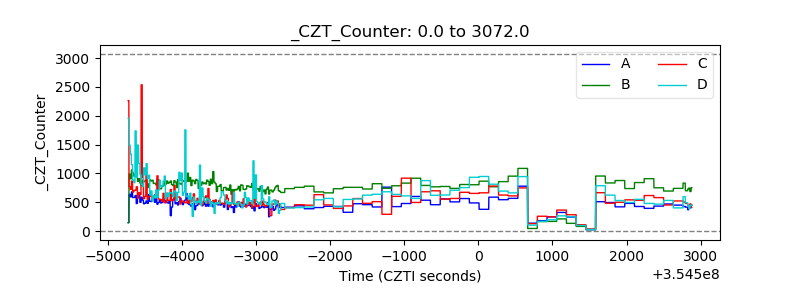 |
| +2.5 Volts monitor |  |
| +5 Volts monitor | 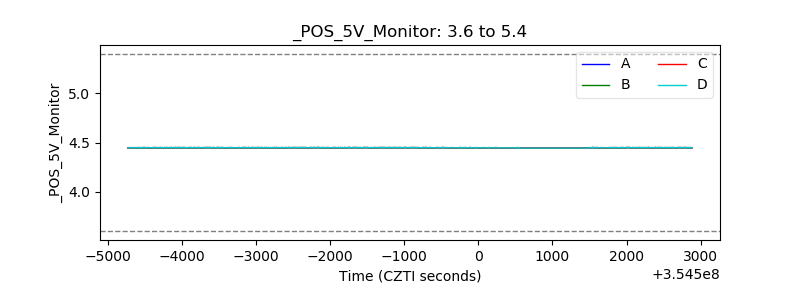 |
| _ROLL_ROT | 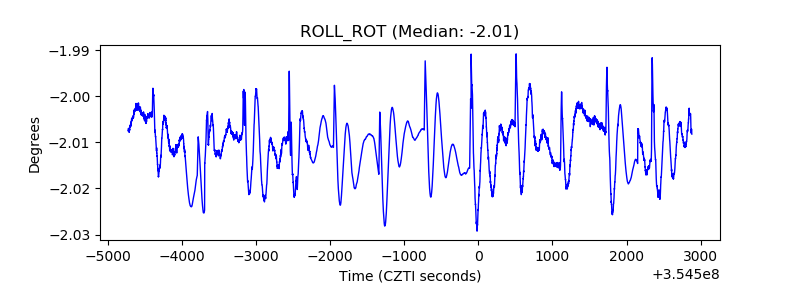 |
| _Roll_DEC | 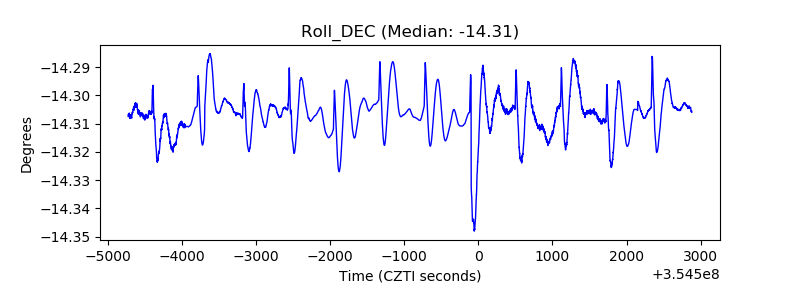 |
| _Roll_RA | 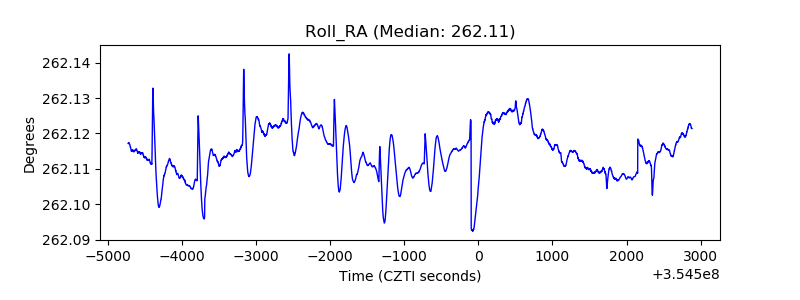 |
| Veto Counter | 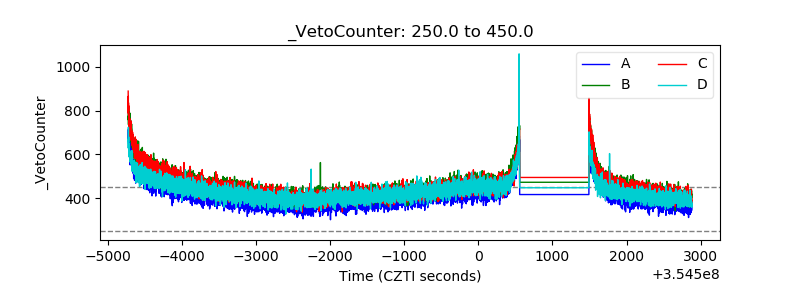 |