| Param | Original file | Final file |
|---|---|---|
| Filename | modeM0/AS1A10_007T01_9000004276_29706cztM0_level2.evt | modeM0/AS1A10_007T01_9000004276_29706cztM0_level2_quad_clean.evt |
| Size (bytes) | 596,736,000 | 99,737,280 |
| Size | 569.1 MB | 95.1 MB |
| Events in quadrant A | 3,401,913 | 633,649 |
| Events in quadrant B | 5,688,426 | 639,638 |
| Events in quadrant C | 3,929,258 | 635,057 |
| Events in quadrant D | 4,568,371 | 613,924 |
| Mode SS | |||
|---|---|---|---|
| Quadrant | BADHDUFLAG | Total packets | Discarded packets |
| A | 0 | 146 | 0 |
| B | 0 | 146 | 0 |
| C | 0 | 146 | 0 |
| D | 0 | 146 | 0 |
| Mode M0 | |||
|---|---|---|---|
| Quadrant | BADHDUFLAG | Total packets | Discarded packets |
| A | 0 | 14775 | 2 |
| B | 0 | 22041 | 2 |
| C | 0 | 16111 | 2 |
| D | 0 | 18439 | 2 |
| Mode M9 | |||
|---|---|---|---|
| Quadrant | BADHDUFLAG | Total packets | Discarded packets |
| A | 0 | 15 | 0 |
| B | 0 | 16 | 0 |
| C | 0 | 16 | 0 |
| D | 0 | 16 | 0 |
| Quadrant | Total seconds | Saturated seconds | Saturation percentage |
|---|---|---|---|
| A | 7158 | 28 | 0.391171% |
| B | 7158 | 172 | 2.402906% |
| C | 7158 | 153 | 2.137469% |
| D | 7158 | 150 | 2.095557% |
Noise dominated data is calculated using 1-second bins in cleaned event files. If a bin has >2000 counts, and if more than 50% of those come from <1% of pixels, then it is considered to be noise-dominated and hence unusable.
| Quadrant | # 1 sec bins | Bins with >0 counts | Bins with >2000 counts | High rate bins dominated by noise | Noise dominated (total time) | Noise dominated (detector-on time) | Marked lightcurve |
|---|---|---|---|---|---|---|---|
| A | 7683 | 7159 | 0 | 0 | 0.00% | 0.00% | 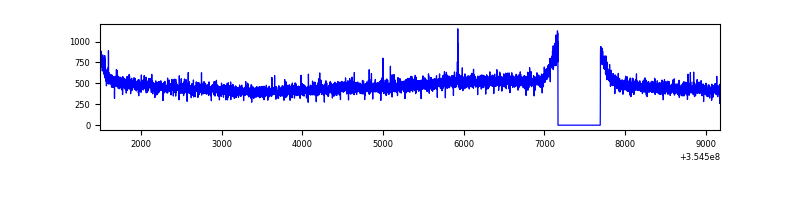 |
| B | 7683 | 7159 | 9 | 9 | 0.12% | 0.13% | 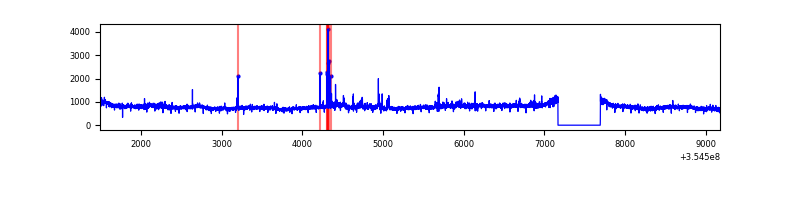 |
| C | 7683 | 7159 | 6 | 6 | 0.08% | 0.08% | 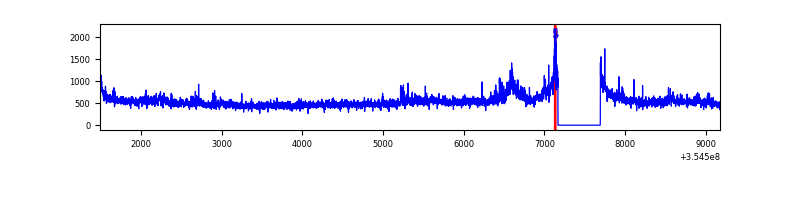 |
| D | 7683 | 7159 | 108 | 108 | 1.41% | 1.51% | 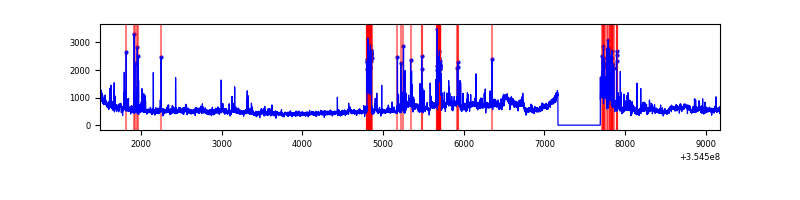 |
Top three noisy pixels from each quadrant. If the there are fewer than three noisy pixels in the level2.evt file, extra rows are filled as -1
| Pixel properties | Quadrant properties | ||||||
|---|---|---|---|---|---|---|---|
| Quadrant | DetID | PixID | Counts | Sigma | Mean | Median | Sigma |
| A | 13 | 254 | 14196 | 74.94 | 879 | 860 | 177.9 |
| A | 3 | 137 | 9225 | 47.01 | 879 | 860 | 177.9 |
| A | 0 | 226 | 7286 | 36.11 | 879 | 860 | 177.9 |
| B | 6 | 159 | 2075214 | 12179.16 | 876 | 852 | 170.3 |
| B | 0 | 229 | 144148 | 841.33 | 876 | 852 | 170.3 |
| B | 12 | 111 | 21020 | 118.41 | 876 | 852 | 170.3 |
| C | 3 | 233 | 395902 | 1945.02 | 857 | 864 | 203.1 |
| C | 14 | 238 | 139322 | 681.71 | 857 | 864 | 203.1 |
| C | 10 | 22 | 25607 | 121.83 | 857 | 864 | 203.1 |
| D | 8 | 195 | 800299 | 3885.57 | 856 | 833 | 205.8 |
| D | 7 | 238 | 228782 | 1107.88 | 856 | 833 | 205.8 |
| D | 2 | 250 | 139374 | 673.34 | 856 | 833 | 205.8 |
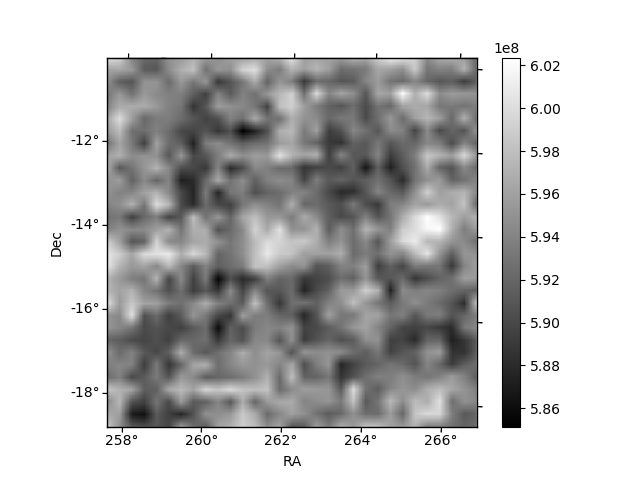
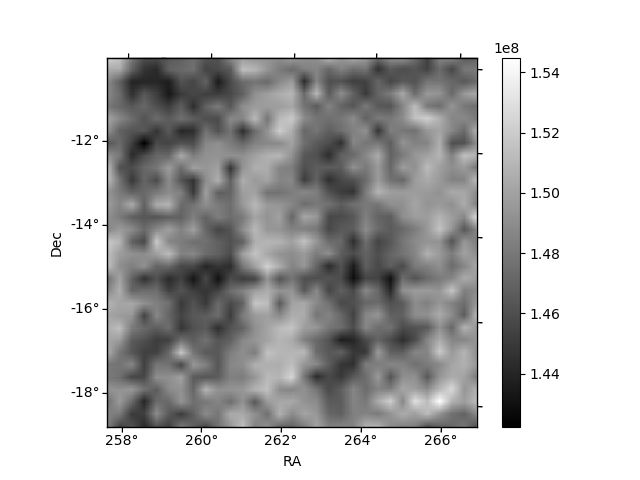
Histogram calculated using DETX and DETY for each event in the final _common_clean file
| Quadrant A | 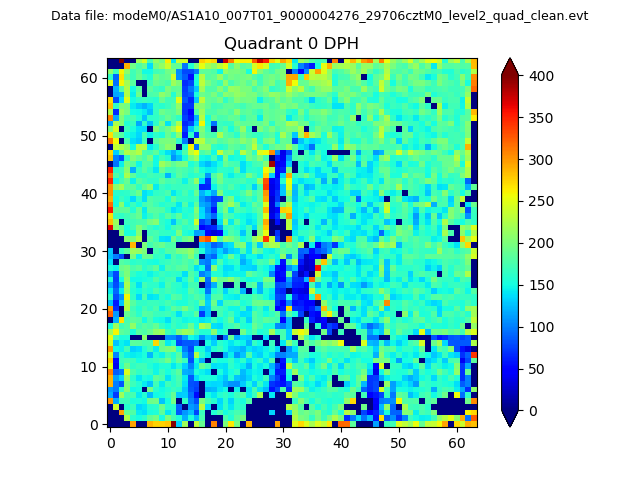 |
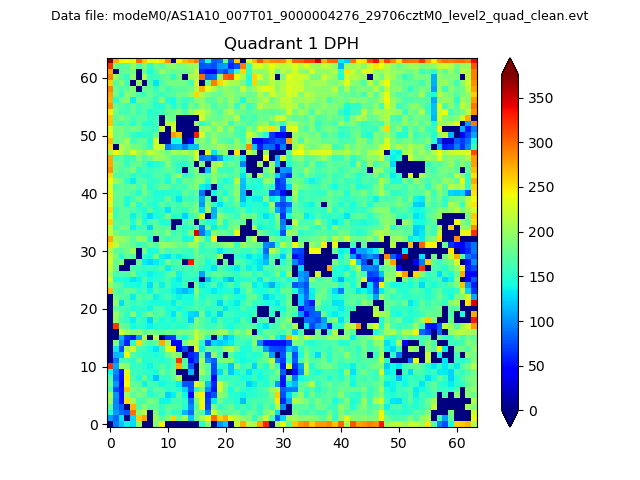 |
Quadrant B |
|---|---|---|---|
| Quadrant D | 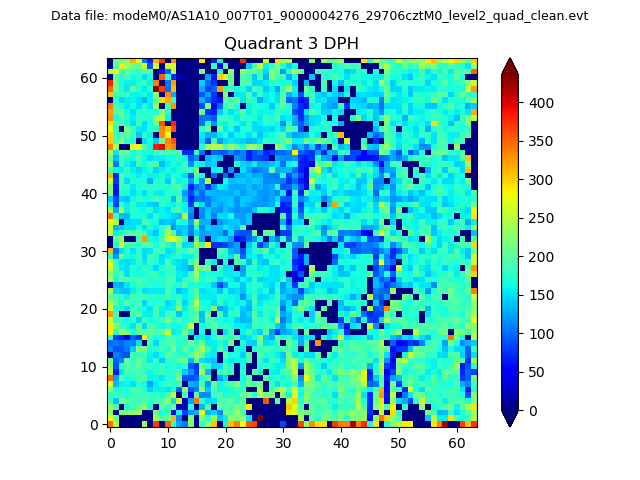 |
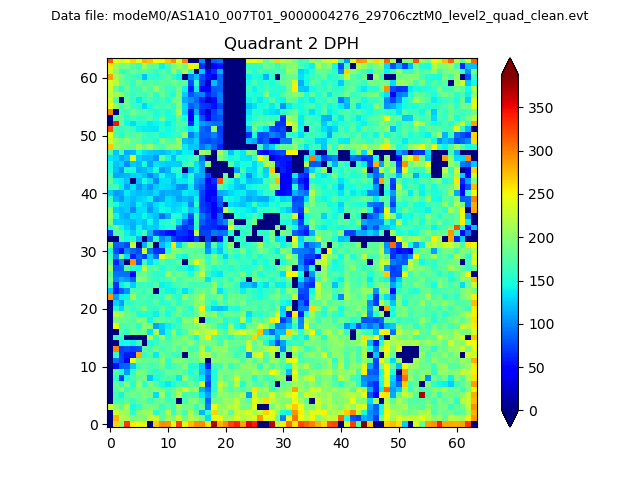 |
Quadrant C |
| Plot type | Count rate plots | Images |
|---|---|---|
| Comparison with Poisson distribution Blue bars denote a histogram of data divided into 1 sec bins. Red curve is a Poisson curve with rate = median count rate of data. |
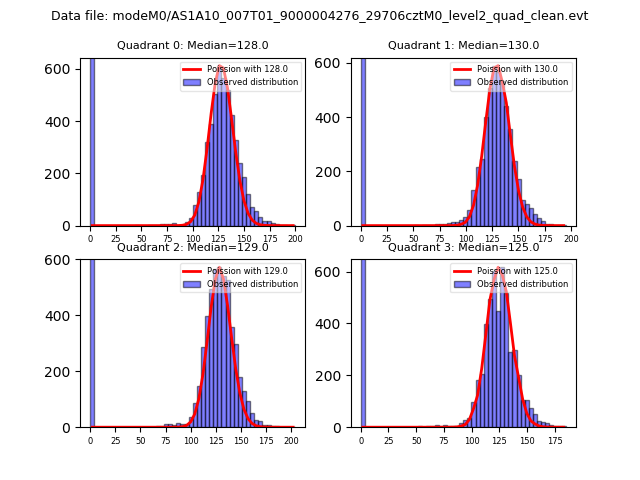 |
 |
| Quadrant-wise count rates Data is divided into 100 sec bins |
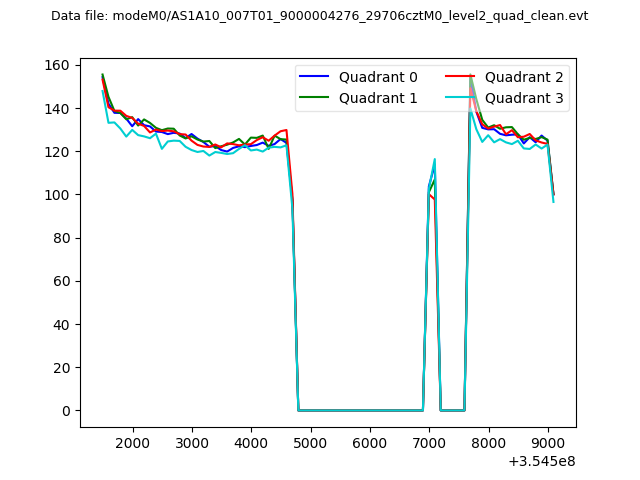 |
|
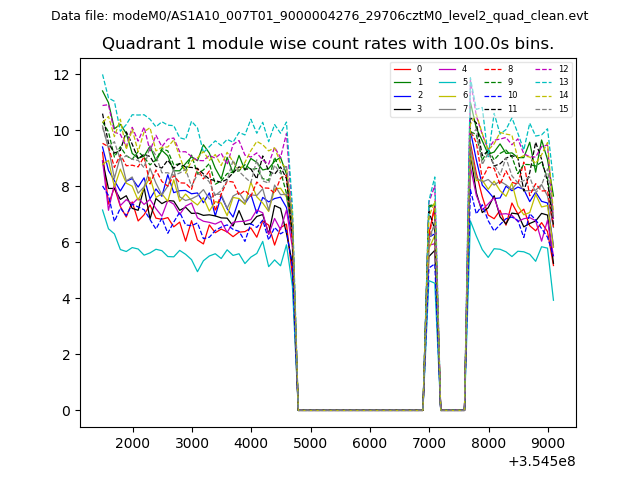
| Module-wise count rates for Quadrant A Data is divided into 100 sec bins |
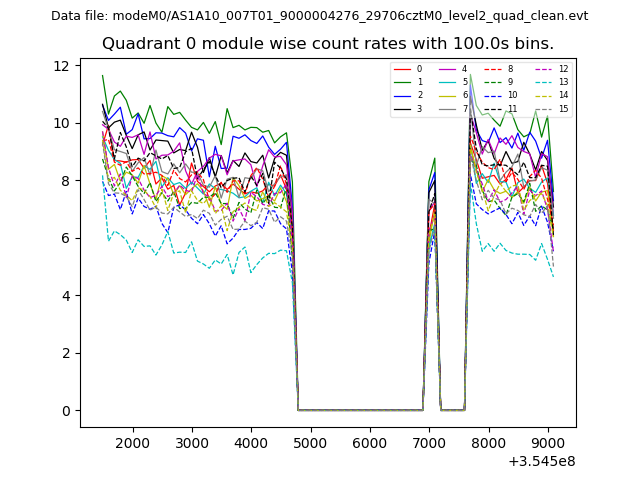 |
 |
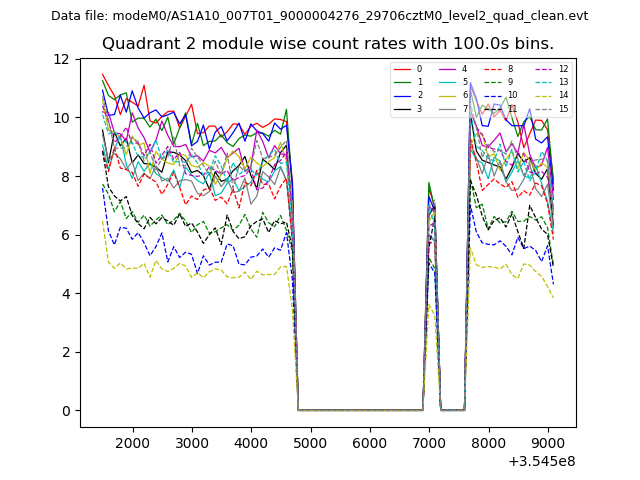
| Module-wise count rates for Quadrant B Data is divided into 100 sec bins |
 |
 |
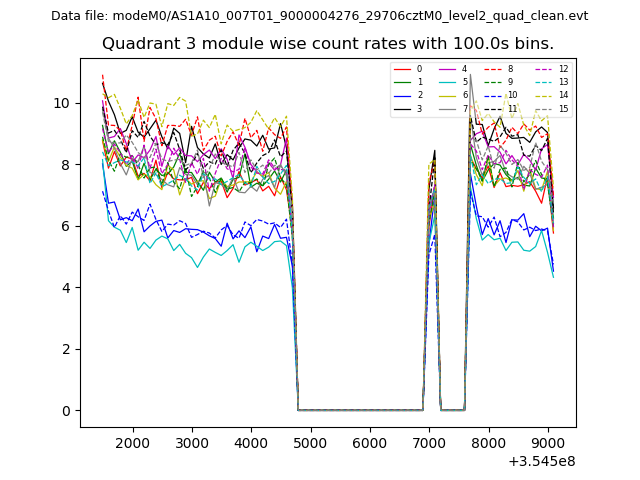
| Module-wise count rates for Quadrant C Data is divided into 100 sec bins |
 |
 |
| Module-wise count rates for Quadrant D Data is divided into 100 sec bins |
 |
 |
| Parameter | Plot |
|---|---|
| CZT HV Monitor | 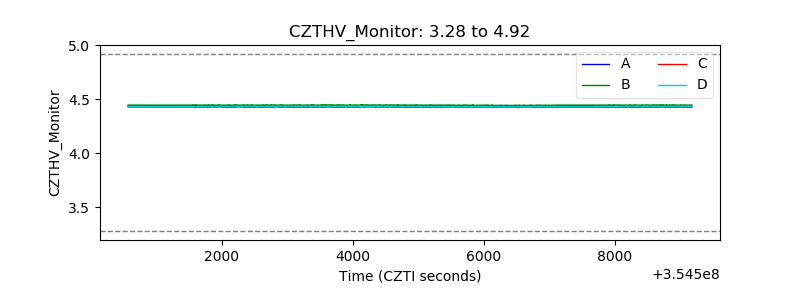 |
| D_VDD | 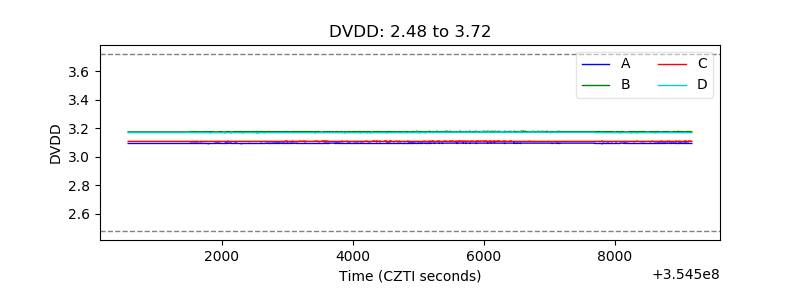 |
| Temperature 1 | 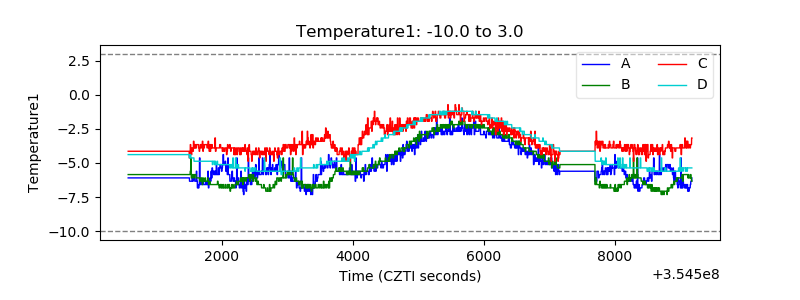 |
| Veto HV Monitor | 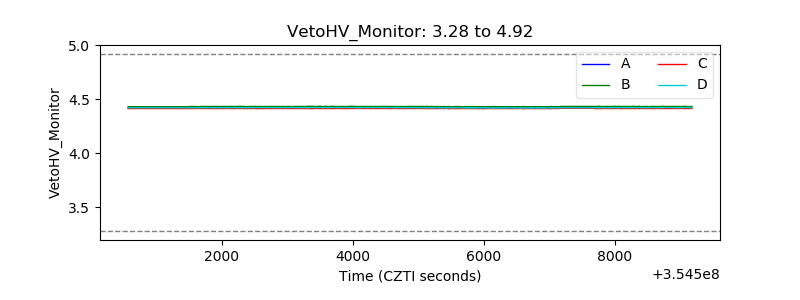 |
| Veto LLD | 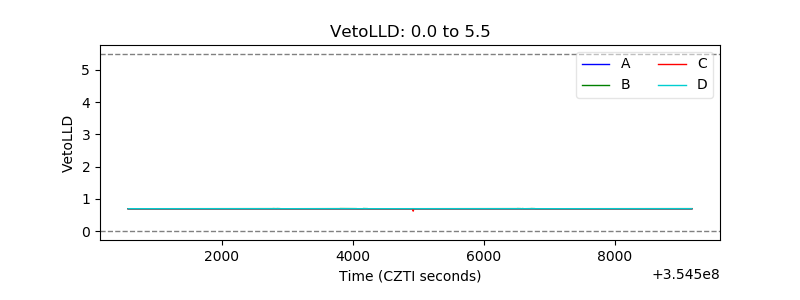 |
| Alpha Counter | 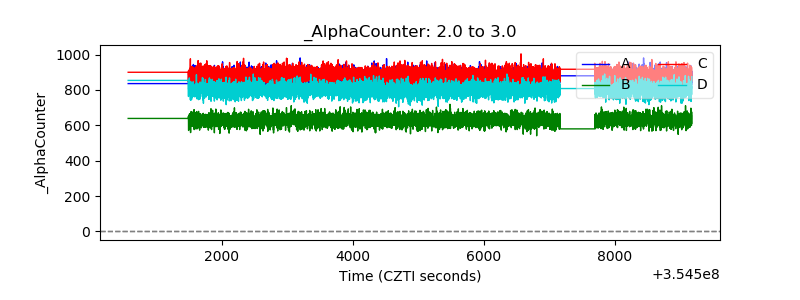 |
| _CPM_Rate | 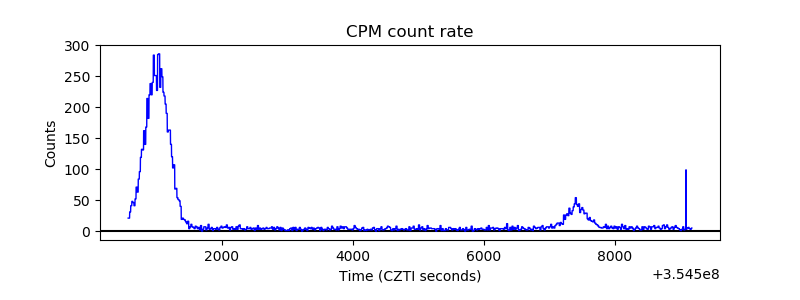 |
| CZT Counter | 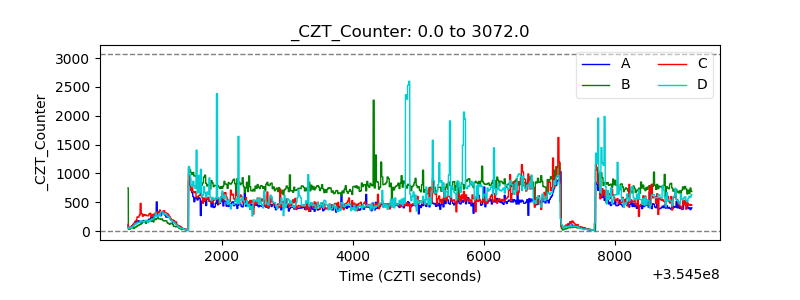 |
| +2.5 Volts monitor |  |
| +5 Volts monitor |  |
| _ROLL_ROT | 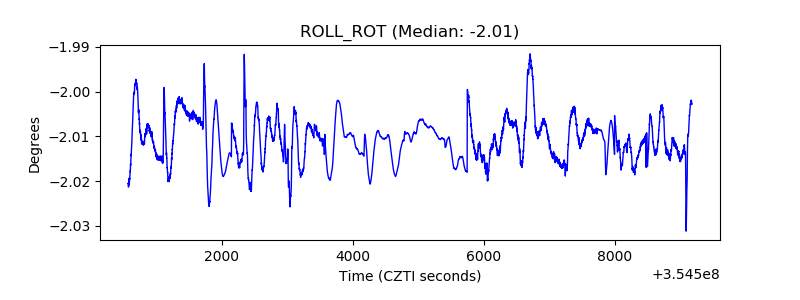 |
| _Roll_DEC |  |
| _Roll_RA | 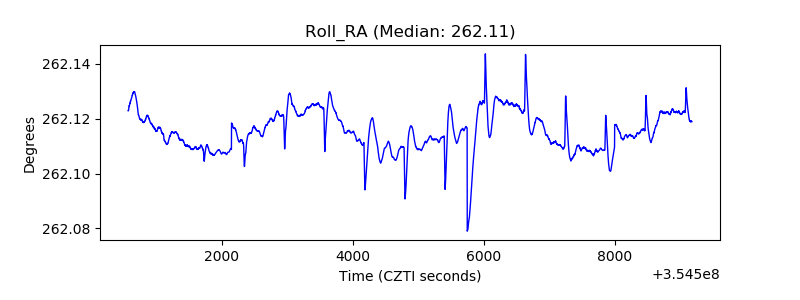 |
| Veto Counter | 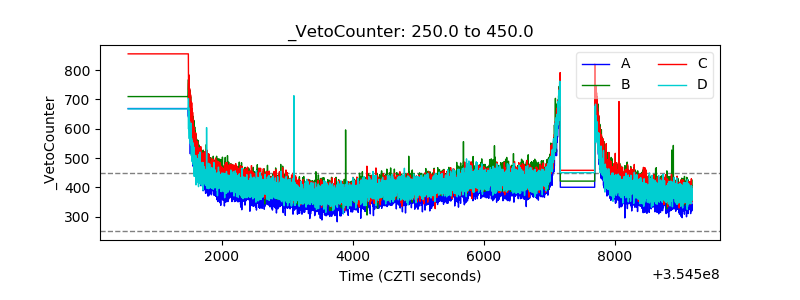 |