| Param | Original file | Final file |
|---|---|---|
| Filename | modeM0/AS1A10_007T01_9000004276_29711cztM0_level2.evt | modeM0/AS1A10_007T01_9000004276_29711cztM0_level2_quad_clean.evt |
| Size (bytes) | 1,030,677,120 | 155,695,680 |
| Size | 982.9 MB | 148.5 MB |
| Events in quadrant A | 5,806,783 | 980,851 |
| Events in quadrant B | 9,481,016 | 987,512 |
| Events in quadrant C | 6,474,946 | 979,190 |
| Events in quadrant D | 8,629,367 | 925,436 |
| Mode SS | |||
|---|---|---|---|
| Quadrant | BADHDUFLAG | Total packets | Discarded packets |
| A | 0 | 246 | 0 |
| B | 0 | 246 | 0 |
| C | 0 | 246 | 0 |
| D | 0 | 246 | 0 |
| Mode M0 | |||
|---|---|---|---|
| Quadrant | BADHDUFLAG | Total packets | Discarded packets |
| A | 0 | 25202 | 2 |
| B | 0 | 37194 | 2 |
| C | 0 | 26601 | 2 |
| D | 0 | 34112 | 2 |
| Mode M9 | |||
|---|---|---|---|
| Quadrant | BADHDUFLAG | Total packets | Discarded packets |
| A | 0 | 8 | 0 |
| B | 0 | 8 | 0 |
| C | 0 | 8 | 0 |
| D | 0 | 8 | 0 |
| Quadrant | Total seconds | Saturated seconds | Saturation percentage |
|---|---|---|---|
| A | 12186 | 106 | 0.869851% |
| B | 12186 | 338 | 2.773675% |
| C | 12187 | 313 | 2.568310% |
| D | 12187 | 437 | 3.585788% |
Noise dominated data is calculated using 1-second bins in cleaned event files. If a bin has >2000 counts, and if more than 50% of those come from <1% of pixels, then it is considered to be noise-dominated and hence unusable.
| Quadrant | # 1 sec bins | Bins with >0 counts | Bins with >2000 counts | High rate bins dominated by noise | Noise dominated (total time) | Noise dominated (detector-on time) | Marked lightcurve |
|---|---|---|---|---|---|---|---|
| A | 12896 | 12188 | 0 | 0 | 0.00% | 0.00% | 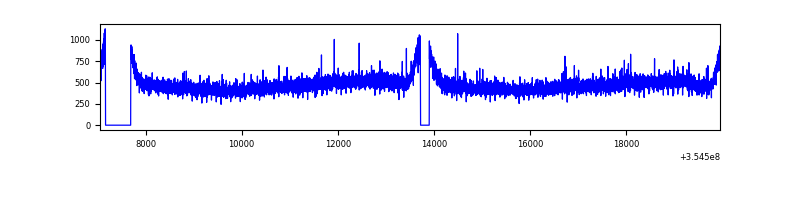 |
| B | 12896 | 12188 | 5 | 5 | 0.04% | 0.04% | 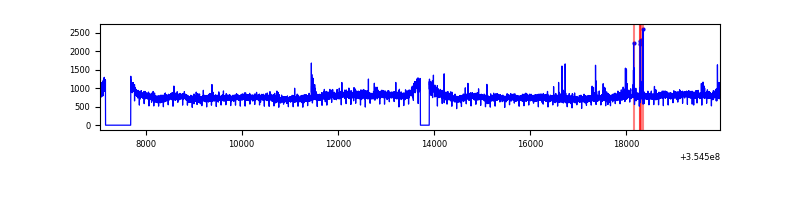 |
| C | 12897 | 12189 | 13 | 13 | 0.10% | 0.11% | 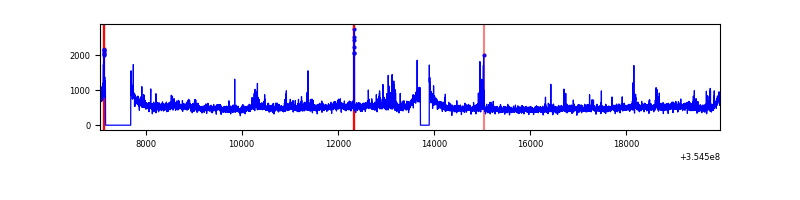 |
| D | 12897 | 12189 | 273 | 273 | 2.12% | 2.24% | 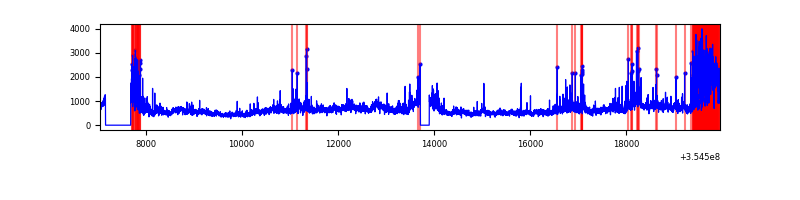 |
Top three noisy pixels from each quadrant. If the there are fewer than three noisy pixels in the level2.evt file, extra rows are filled as -1
| Pixel properties | Quadrant properties | ||||||
|---|---|---|---|---|---|---|---|
| Quadrant | DetID | PixID | Counts | Sigma | Mean | Median | Sigma |
| A | 13 | 254 | 24003 | 74.2 | 1501 | 1465 | 303.8 |
| A | 3 | 137 | 15461 | 46.08 | 1501 | 1465 | 303.8 |
| A | 0 | 226 | 12599 | 36.65 | 1501 | 1465 | 303.8 |
| B | 6 | 159 | 3530203 | 12221.55 | 1484 | 1443 | 288.7 |
| B | 0 | 229 | 85574 | 291.38 | 1484 | 1443 | 288.7 |
| B | 12 | 111 | 36765 | 122.33 | 1484 | 1443 | 288.7 |
| C | 3 | 233 | 335797 | 971.34 | 1454 | 1463 | 344.2 |
| C | 14 | 238 | 239877 | 692.67 | 1454 | 1463 | 344.2 |
| C | 7 | 247 | 105065 | 301.0 | 1454 | 1463 | 344.2 |
| D | 8 | 195 | 1777957 | 5089.43 | 1450 | 1409 | 349.1 |
| D | 7 | 80 | 979829 | 2802.97 | 1450 | 1409 | 349.1 |
| D | 2 | 250 | 248793 | 708.7 | 1450 | 1409 | 349.1 |
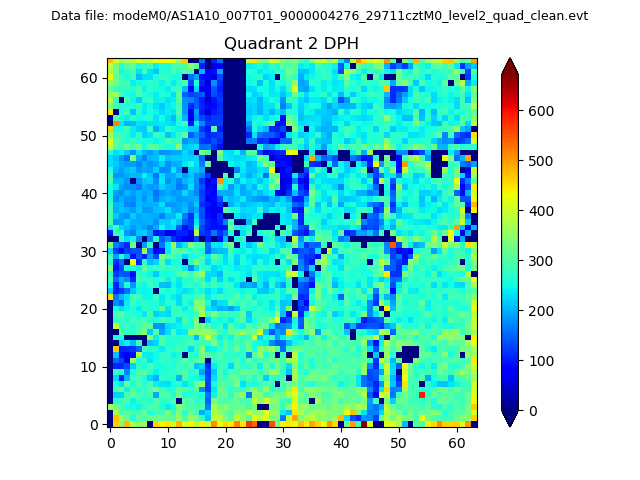
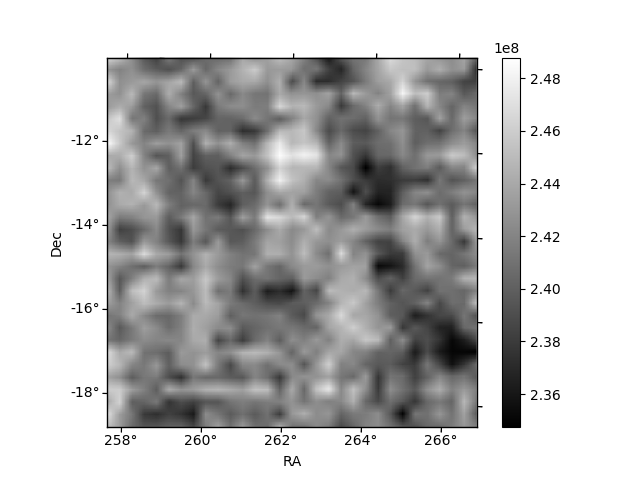
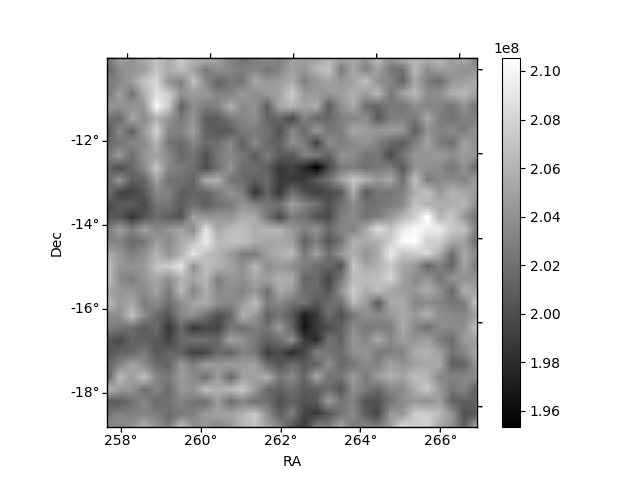
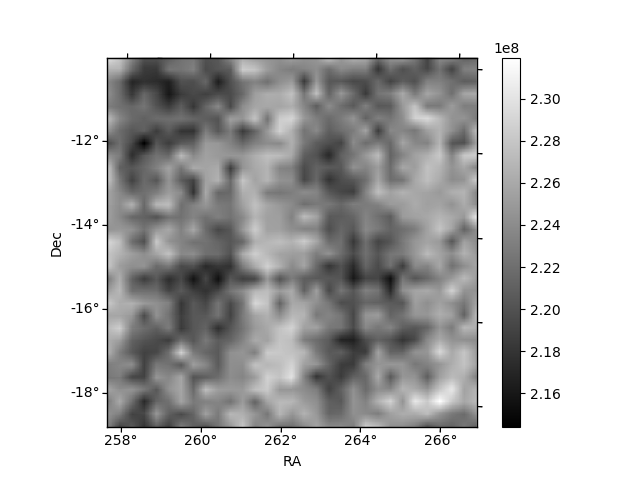
Histogram calculated using DETX and DETY for each event in the final _common_clean file
| Quadrant A | 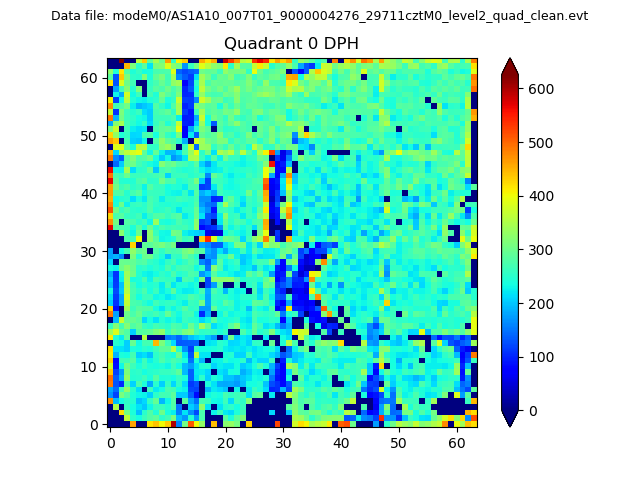 |
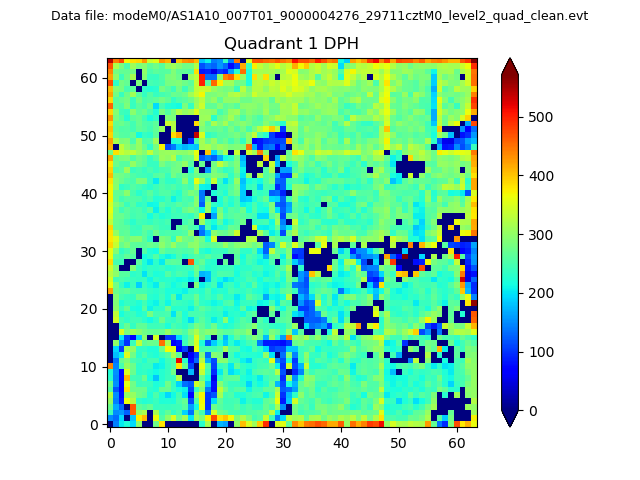 |
Quadrant B |
|---|---|---|---|
| Quadrant D | 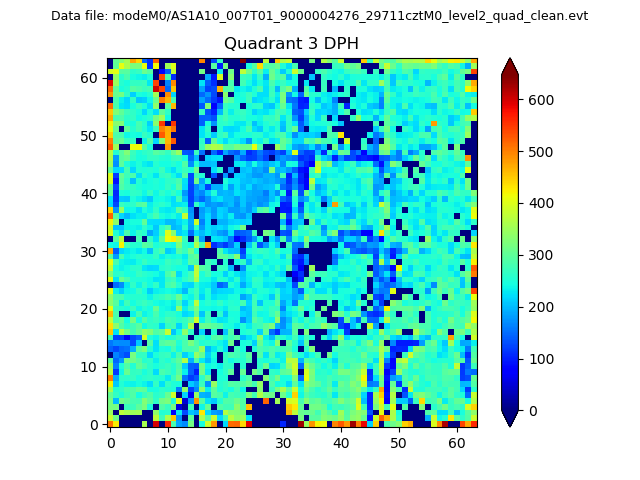 |
 |
Quadrant C |
| Plot type | Count rate plots | Images |
|---|---|---|
| Comparison with Poisson distribution Blue bars denote a histogram of data divided into 1 sec bins. Red curve is a Poisson curve with rate = median count rate of data. |
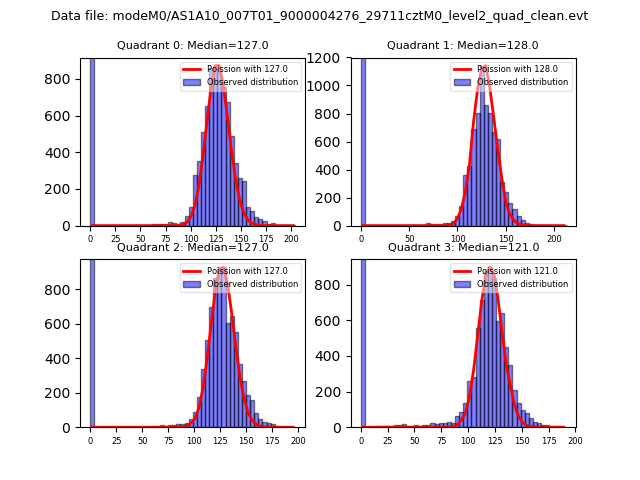 |
 |
| Quadrant-wise count rates Data is divided into 100 sec bins |
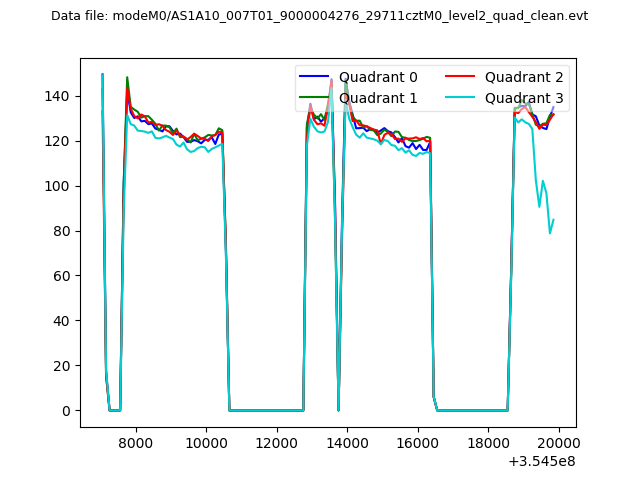 |
|
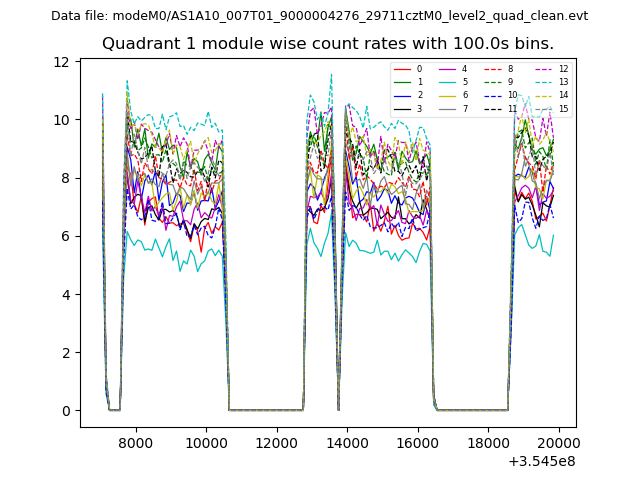
| Module-wise count rates for Quadrant A Data is divided into 100 sec bins |
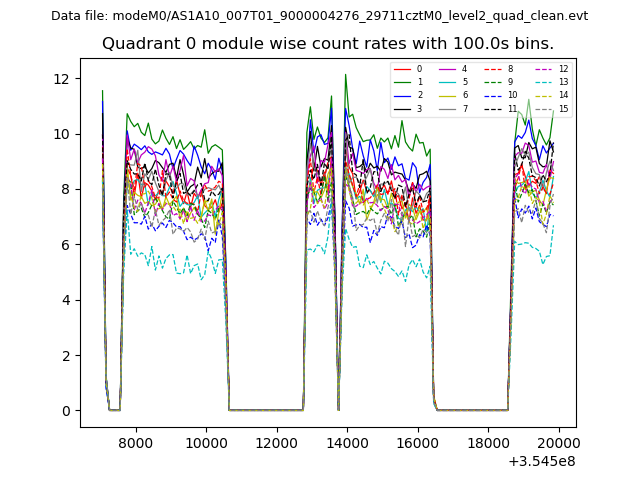 |
 |
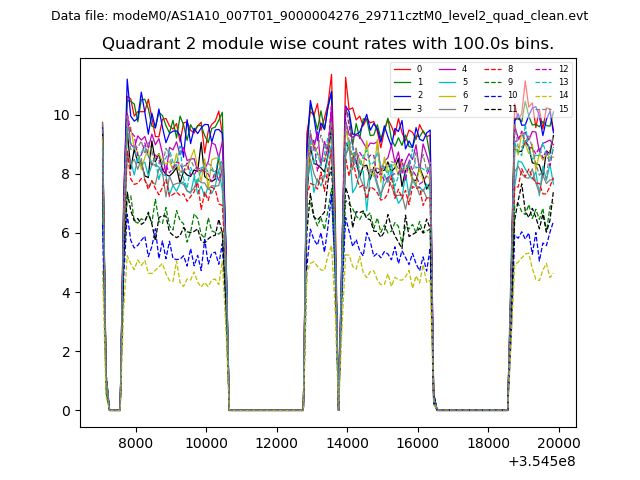
| Module-wise count rates for Quadrant B Data is divided into 100 sec bins |
 |
 |
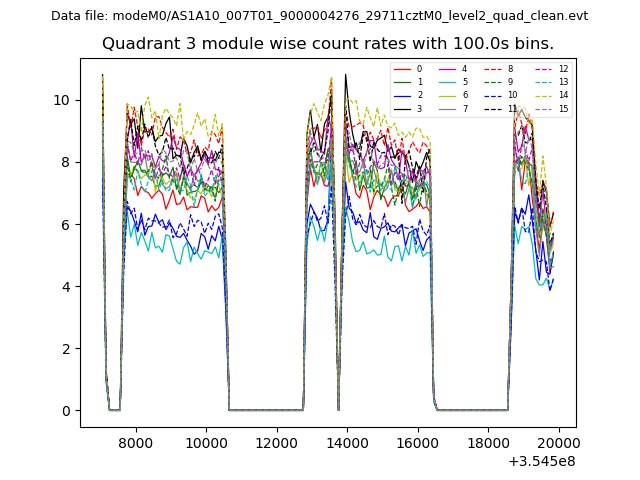
| Module-wise count rates for Quadrant C Data is divided into 100 sec bins |
 |
 |
| Module-wise count rates for Quadrant D Data is divided into 100 sec bins |
 |
 |
| Parameter | Plot |
|---|---|
| CZT HV Monitor | 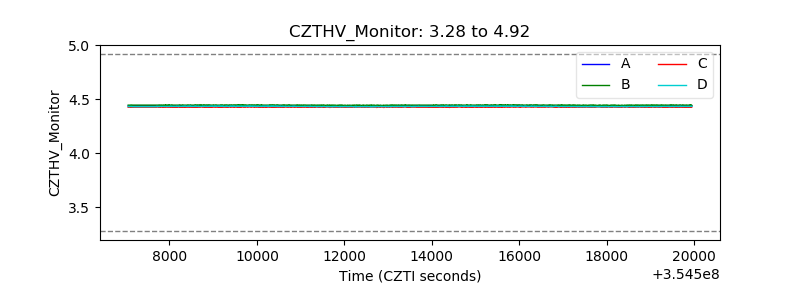 |
| D_VDD |  |
| Temperature 1 | 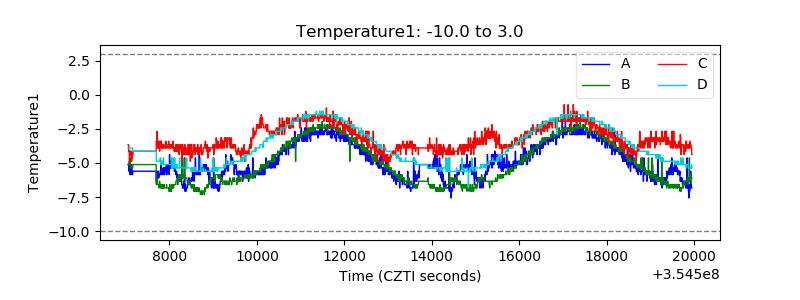 |
| Veto HV Monitor | 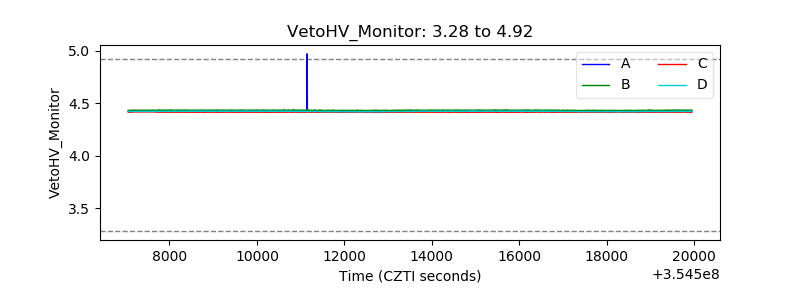 |
| Veto LLD | 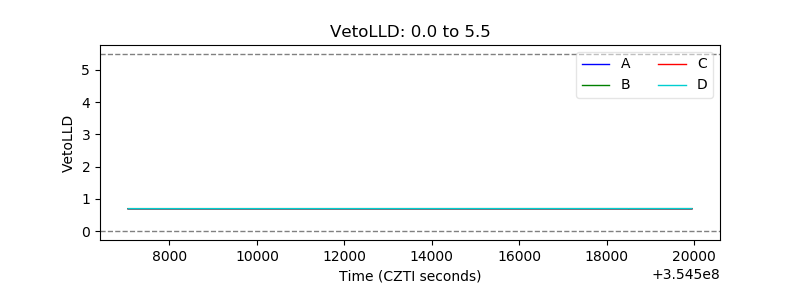 |
| Alpha Counter | 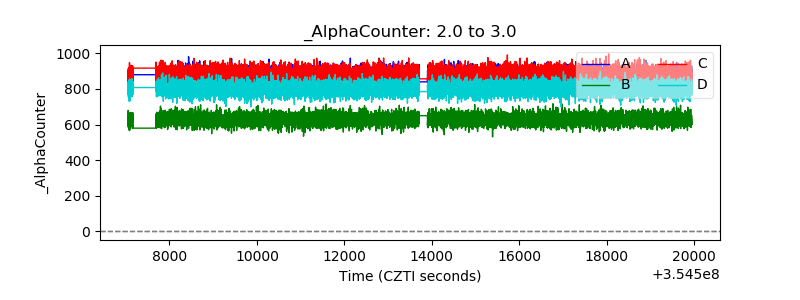 |
| _CPM_Rate | 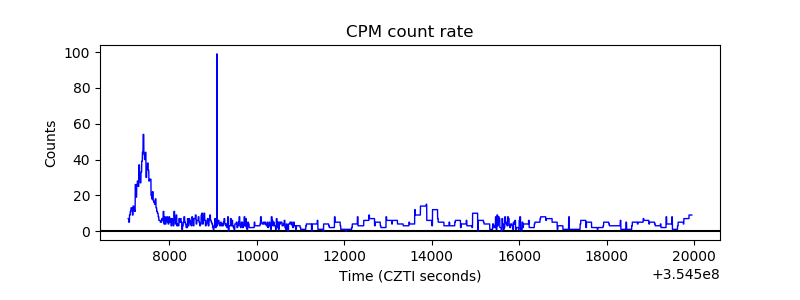 |
| CZT Counter | 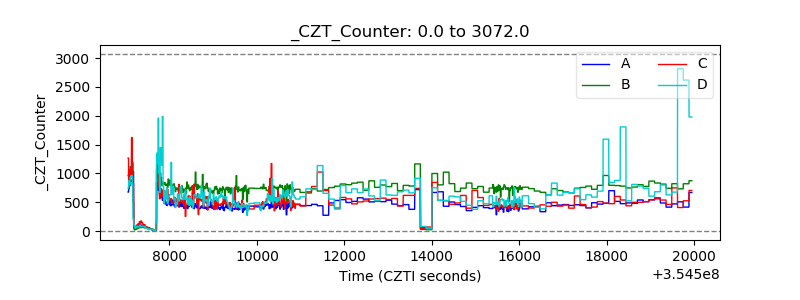 |
| +2.5 Volts monitor |  |
| +5 Volts monitor |  |
| _ROLL_ROT | 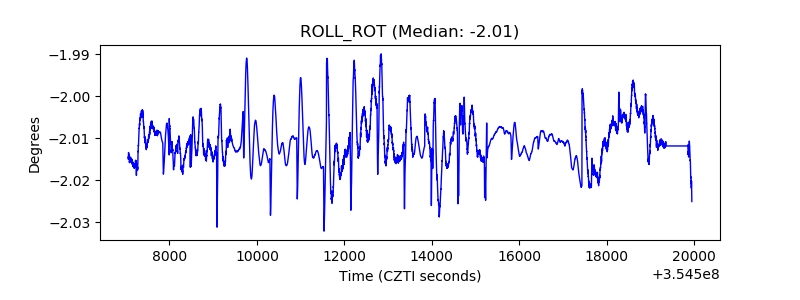 |
| _Roll_DEC | 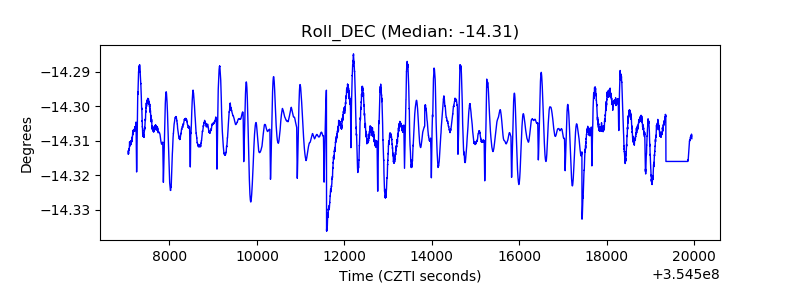 |
| _Roll_RA |  |
| Veto Counter | 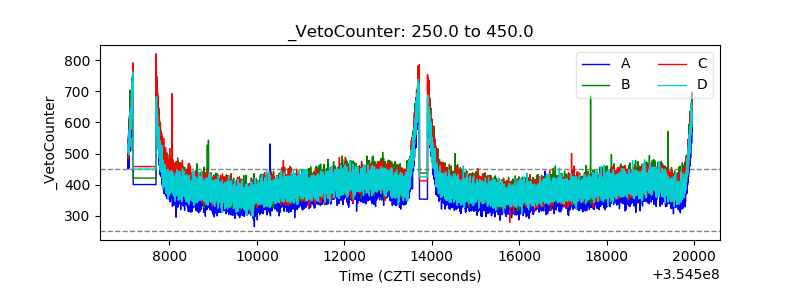 |