| Param | Original file | Final file |
|---|---|---|
| Filename | modeM0/AS1A10_007T01_9000004276_29712cztM0_level2.evt | modeM0/AS1A10_007T01_9000004276_29712cztM0_level2_quad_clean.evt |
| Size (bytes) | 2,192,731,200 | 283,682,880 |
| Size | 2.0 GB | 270.5 MB |
| Events in quadrant A | 11,322,581 | 1,761,255 |
| Events in quadrant B | 18,973,383 | 1,775,389 |
| Events in quadrant C | 13,483,391 | 1,750,593 |
| Events in quadrant D | 21,011,184 | 1,649,920 |
| Mode SS | |||
|---|---|---|---|
| Quadrant | BADHDUFLAG | Total packets | Discarded packets |
| A | 0 | 490 | 0 |
| B | 0 | 490 | 0 |
| C | 0 | 490 | 0 |
| D | 0 | 490 | 0 |
| Mode M0 | |||
|---|---|---|---|
| Quadrant | BADHDUFLAG | Total packets | Discarded packets |
| A | 0 | 49246 | 5 |
| B | 0 | 73748 | 5 |
| C | 0 | 55096 | 5 |
| D | 0 | 78997 | 5 |
| Mode M9 | |||
|---|---|---|---|
| Quadrant | BADHDUFLAG | Total packets | Discarded packets |
| A | 0 | 31 | 0 |
| B | 0 | 31 | 0 |
| C | 0 | 31 | 0 |
| D | 0 | 31 | 0 |
| Quadrant | Total seconds | Saturated seconds | Saturation percentage |
|---|---|---|---|
| A | 24046 | 315 | 1.309989% |
| B | 24045 | 610 | 2.536910% |
| C | 24045 | 627 | 2.607611% |
| D | 24046 | 1738 | 7.227813% |
Noise dominated data is calculated using 1-second bins in cleaned event files. If a bin has >2000 counts, and if more than 50% of those come from <1% of pixels, then it is considered to be noise-dominated and hence unusable.
| Quadrant | # 1 sec bins | Bins with >0 counts | Bins with >2000 counts | High rate bins dominated by noise | Noise dominated (total time) | Noise dominated (detector-on time) | Marked lightcurve |
|---|---|---|---|---|---|---|---|
| A | 27116 | 24047 | 0 | 0 | 0.00% | 0.00% | 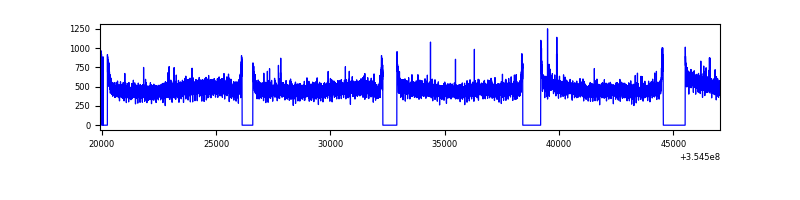 |
| B | 27115 | 24046 | 58 | 58 | 0.21% | 0.24% | 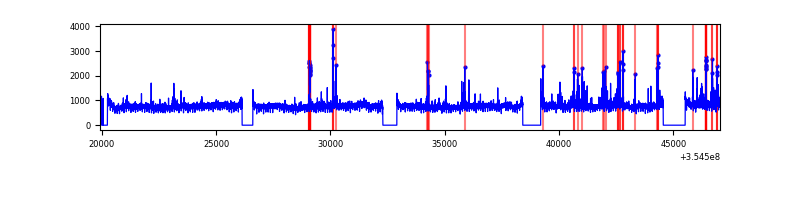 |
| C | 27115 | 24045 | 114 | 114 | 0.42% | 0.47% | 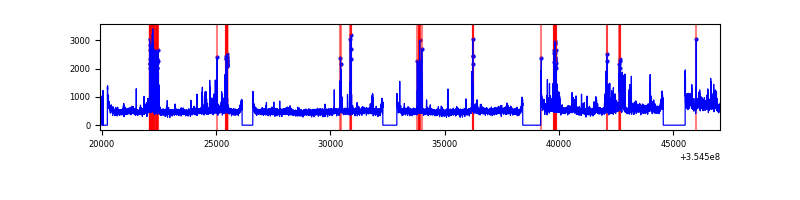 |
| D | 27116 | 24046 | 1433 | 1433 | 5.28% | 5.96% | 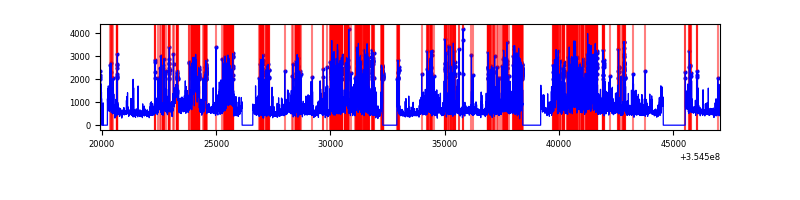 |
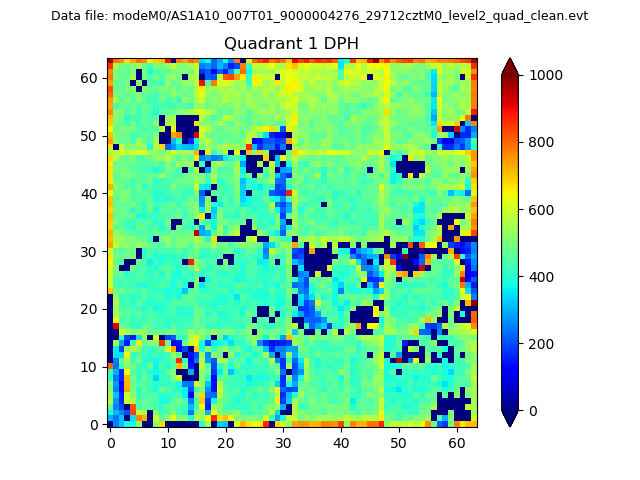
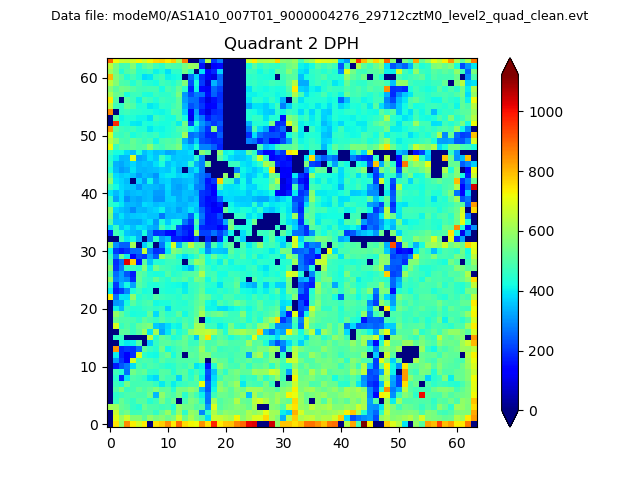
Top three noisy pixels from each quadrant. If the there are fewer than three noisy pixels in the level2.evt file, extra rows are filled as -1
| Pixel properties | Quadrant properties | ||||||
|---|---|---|---|---|---|---|---|
| Quadrant | DetID | PixID | Counts | Sigma | Mean | Median | Sigma |
| A | 13 | 254 | 46258 | 73.28 | 2934 | 2862 | 592.2 |
| A | 3 | 137 | 29718 | 45.35 | 2934 | 2862 | 592.2 |
| A | 0 | 226 | 24334 | 36.26 | 2934 | 2862 | 592.2 |
| B | 6 | 159 | 6894186 | 12381.62 | 2893 | 2814 | 556.6 |
| B | 0 | 229 | 520542 | 930.19 | 2893 | 2814 | 556.6 |
| B | 0 | 190 | 95085 | 165.78 | 2893 | 2814 | 556.6 |
| C | 3 | 233 | 1031503 | 1550.31 | 2836 | 2858 | 663.5 |
| C | 10 | 22 | 627823 | 941.91 | 2836 | 2858 | 663.5 |
| C | 14 | 238 | 453588 | 679.31 | 2836 | 2858 | 663.5 |
| D | 7 | 80 | 6010094 | 9075.77 | 2793 | 2721 | 661.9 |
| D | 8 | 195 | 2456211 | 3706.66 | 2793 | 2721 | 661.9 |
| D | 7 | 238 | 1039417 | 1566.21 | 2793 | 2721 | 661.9 |
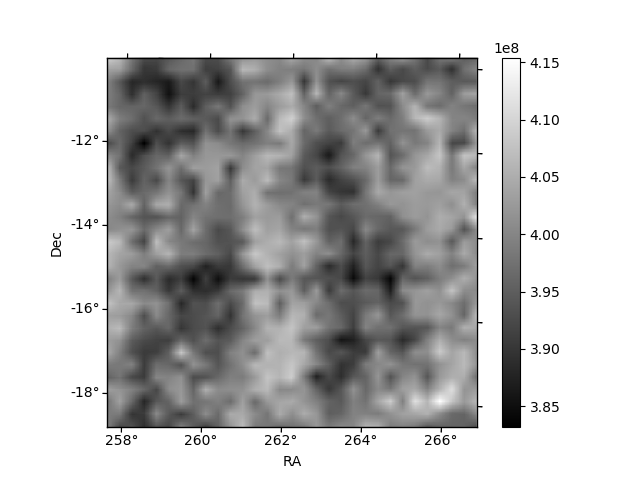
Histogram calculated using DETX and DETY for each event in the final _common_clean file
| Quadrant A | 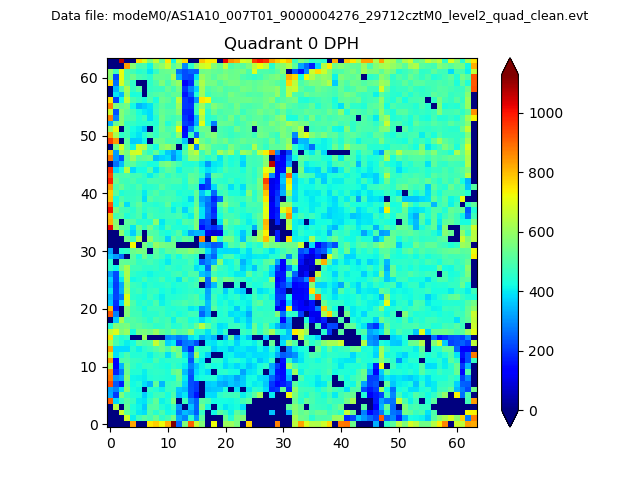 |
 |
Quadrant B |
|---|---|---|---|
| Quadrant D | 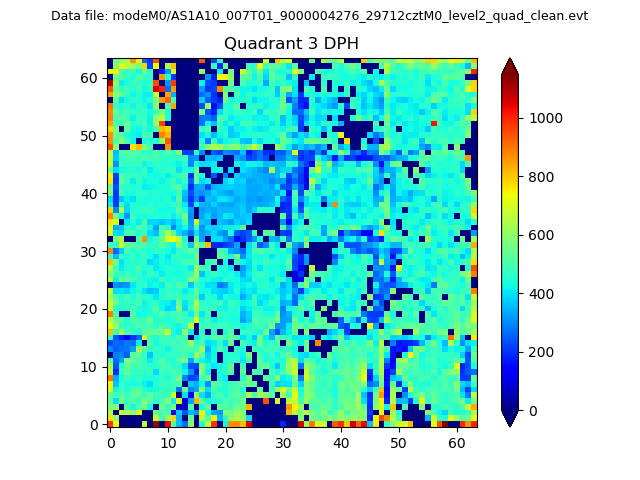 |
 |
Quadrant C |
| Plot type | Count rate plots | Images |
|---|---|---|
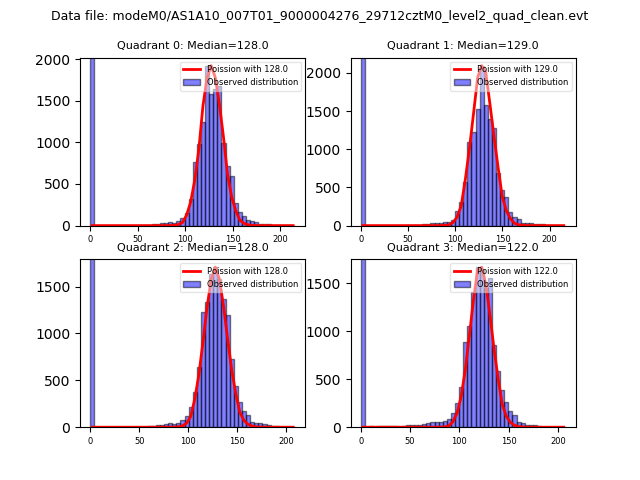
| Comparison with Poisson distribution Blue bars denote a histogram of data divided into 1 sec bins. Red curve is a Poisson curve with rate = median count rate of data. |
 |
 |
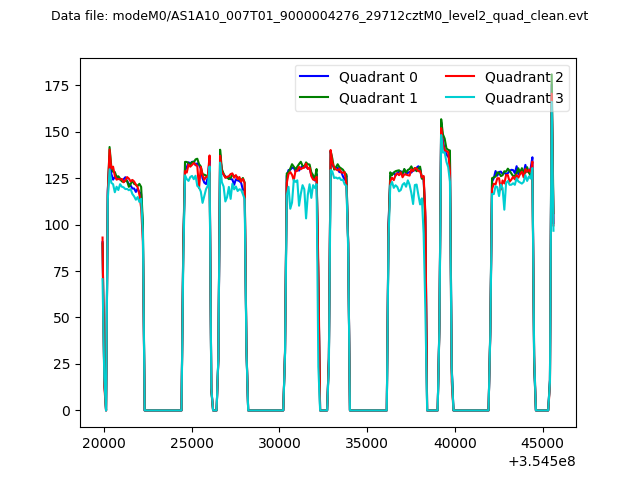
| Quadrant-wise count rates Data is divided into 100 sec bins |
 |
|
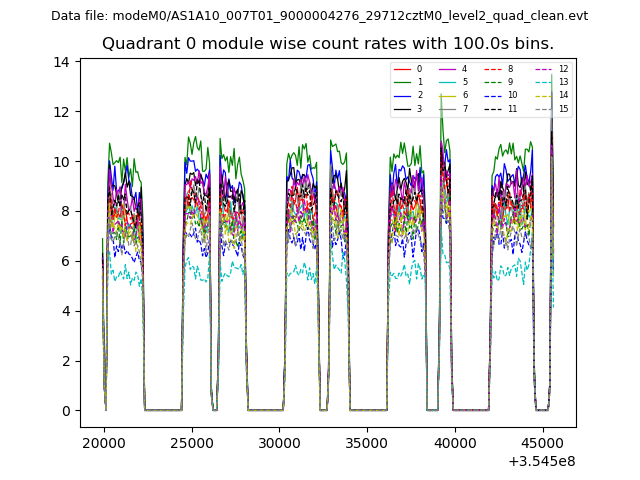
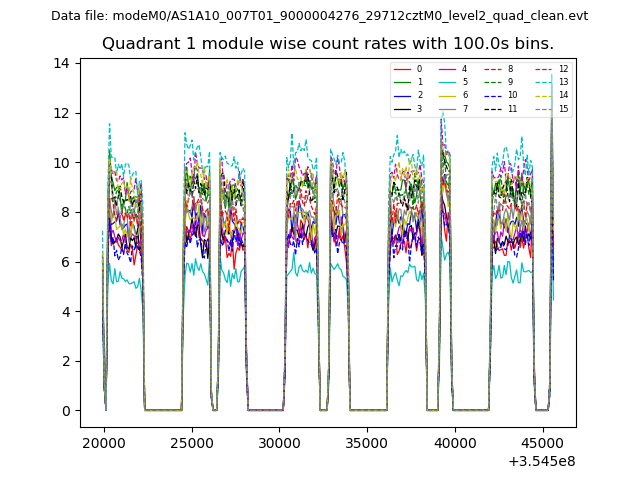
| Module-wise count rates for Quadrant A Data is divided into 100 sec bins |
 |
 |
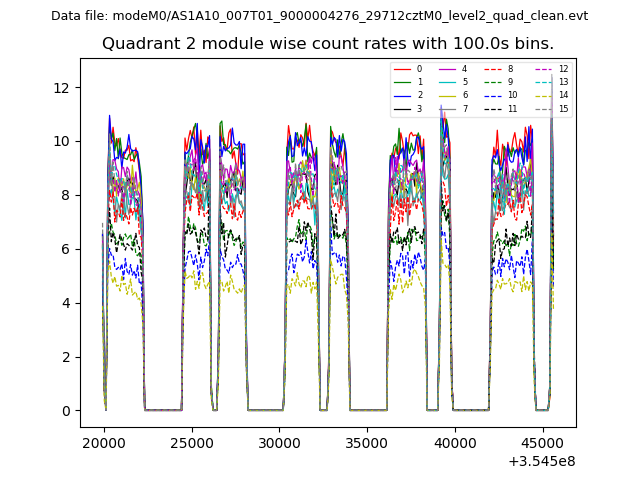
| Module-wise count rates for Quadrant B Data is divided into 100 sec bins |
 |
 |
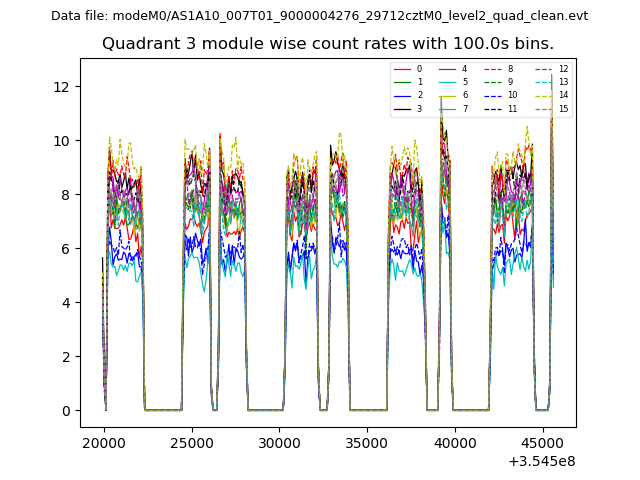
| Module-wise count rates for Quadrant C Data is divided into 100 sec bins |
 |
 |
| Module-wise count rates for Quadrant D Data is divided into 100 sec bins |
 |
 |
| Parameter | Plot |
|---|---|
| CZT HV Monitor | 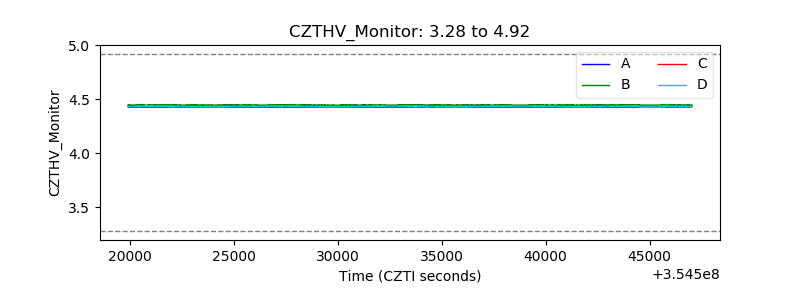 |
| D_VDD |  |
| Temperature 1 | 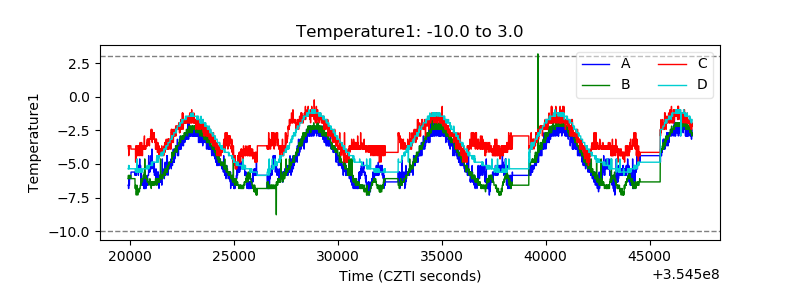 |
| Veto HV Monitor | 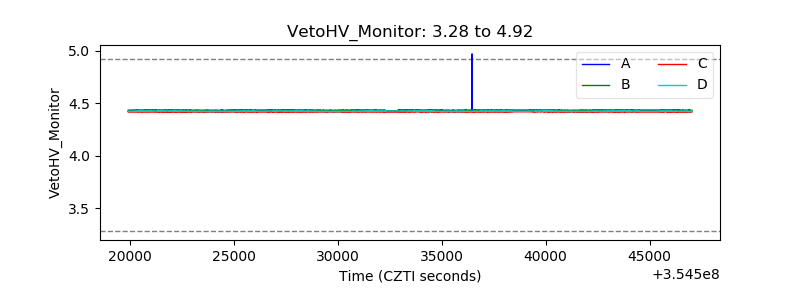 |
| Veto LLD | 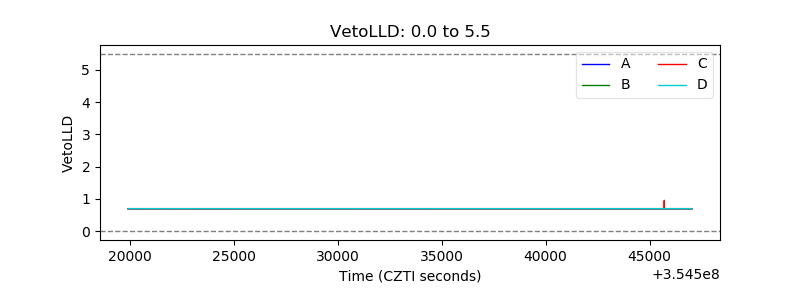 |
| Alpha Counter | 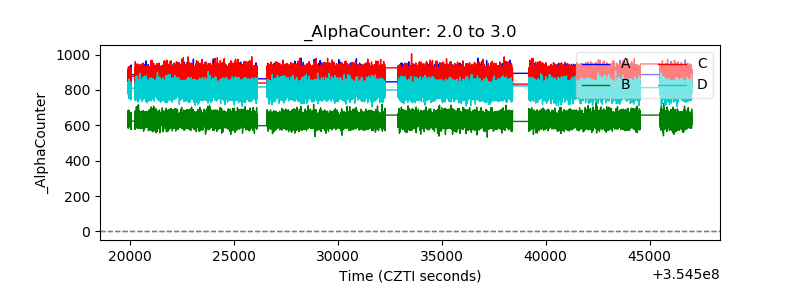 |
| _CPM_Rate | 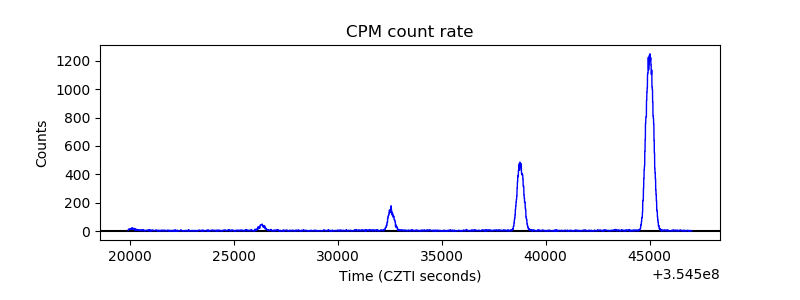 |
| CZT Counter | 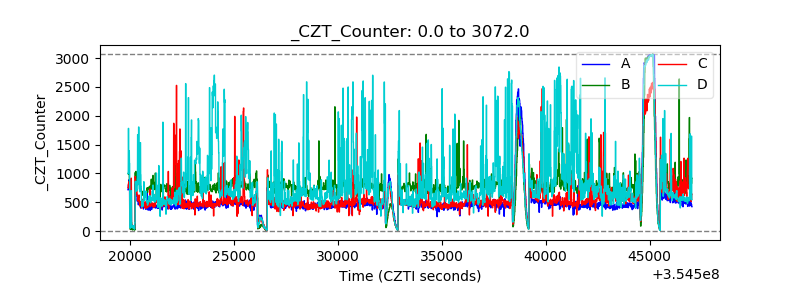 |
| +2.5 Volts monitor |  |
| +5 Volts monitor | 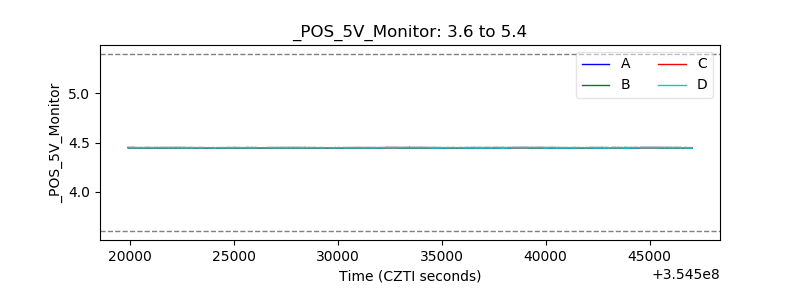 |
| _ROLL_ROT | 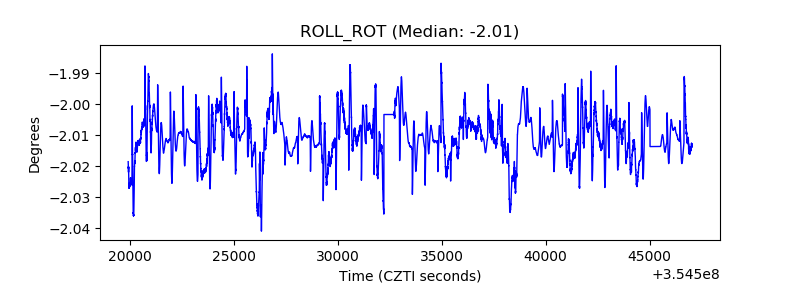 |
| _Roll_DEC | 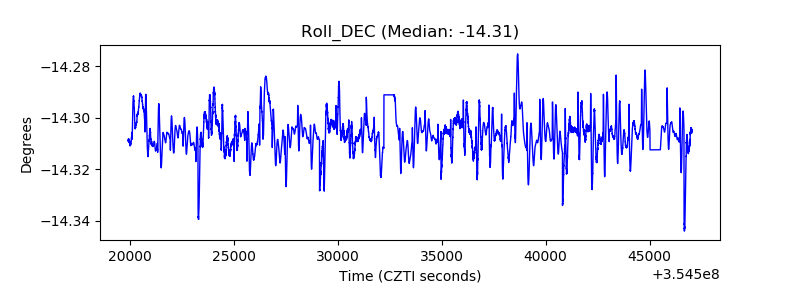 |
| _Roll_RA |  |
| Veto Counter | 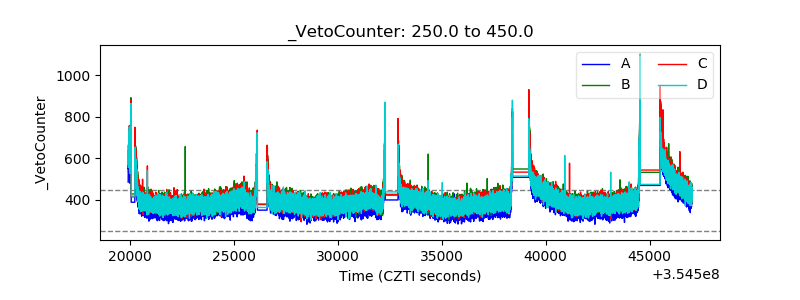 |