| Param | Original file | Final file |
|---|---|---|
| Filename | modeM0/AS1A10_007T01_9000004276_29714cztM0_level2.evt | modeM0/AS1A10_007T01_9000004276_29714cztM0_level2_quad_clean.evt |
| Size (bytes) | 598,996,800 | 63,650,880 |
| Size | 571.2 MB | 60.7 MB |
| Events in quadrant A | 3,291,472 | 375,272 |
| Events in quadrant B | 5,476,307 | 374,589 |
| Events in quadrant C | 4,616,737 | 364,315 |
| Events in quadrant D | 4,315,726 | 358,506 |
| Mode SS | |||
|---|---|---|---|
| Quadrant | BADHDUFLAG | Total packets | Discarded packets |
| A | 0 | 132 | 0 |
| B | 0 | 132 | 0 |
| C | 0 | 132 | 0 |
| D | 0 | 132 | 0 |
| Mode M0 | |||
|---|---|---|---|
| Quadrant | BADHDUFLAG | Total packets | Discarded packets |
| A | 0 | 13953 | 2 |
| B | 0 | 20604 | 1 |
| C | 0 | 18305 | 1 |
| D | 0 | 17095 | 1 |
| Mode M9 | |||
|---|---|---|---|
| Quadrant | BADHDUFLAG | Total packets | Discarded packets |
| A | 0 | 11 | 0 |
| B | 0 | 11 | 0 |
| C | 0 | 11 | 0 |
| D | 0 | 11 | 0 |
| Quadrant | Total seconds | Saturated seconds | Saturation percentage |
|---|---|---|---|
| A | 6516 | 48 | 0.736648% |
| B | 6516 | 149 | 2.286679% |
| C | 6516 | 163 | 2.501535% |
| D | 6517 | 93 | 1.427037% |
Noise dominated data is calculated using 1-second bins in cleaned event files. If a bin has >2000 counts, and if more than 50% of those come from <1% of pixels, then it is considered to be noise-dominated and hence unusable.
| Quadrant | # 1 sec bins | Bins with >0 counts | Bins with >2000 counts | High rate bins dominated by noise | Noise dominated (total time) | Noise dominated (detector-on time) | Marked lightcurve |
|---|---|---|---|---|---|---|---|
| A | 7626 | 6516 | 0 | 0 | 0.00% | 0.00% | 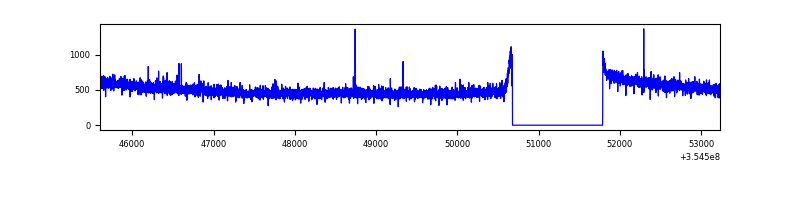 |
| B | 7626 | 6516 | 21 | 21 | 0.28% | 0.32% | 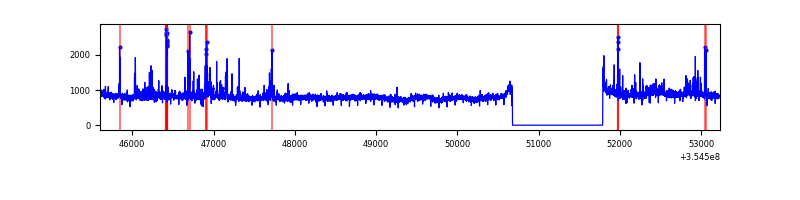 |
| C | 7626 | 6516 | 22 | 22 | 0.29% | 0.34% | 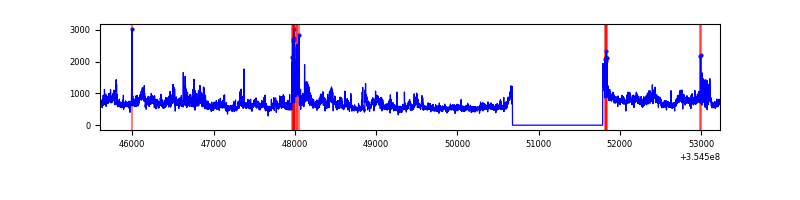 |
| D | 7627 | 6517 | 37 | 37 | 0.49% | 0.57% | 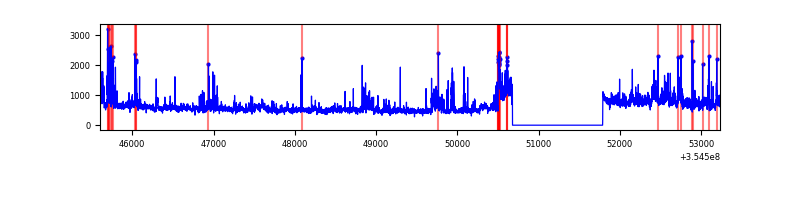 |
Top three noisy pixels from each quadrant. If the there are fewer than three noisy pixels in the level2.evt file, extra rows are filled as -1
| Pixel properties | Quadrant properties | ||||||
|---|---|---|---|---|---|---|---|
| Quadrant | DetID | PixID | Counts | Sigma | Mean | Median | Sigma |
| A | 13 | 254 | 13015 | 71.55 | 853 | 837 | 170.2 |
| A | 3 | 137 | 8119 | 42.78 | 853 | 837 | 170.2 |
| A | 0 | 226 | 7191 | 37.33 | 853 | 837 | 170.2 |
| B | 6 | 159 | 1882780 | 11875.9 | 838 | 818 | 158.5 |
| B | 0 | 229 | 245734 | 1545.51 | 838 | 818 | 158.5 |
| B | 0 | 190 | 27002 | 165.23 | 838 | 818 | 158.5 |
| C | 3 | 233 | 1236082 | 6552.4 | 813 | 818 | 188.5 |
| C | 14 | 238 | 132099 | 696.37 | 813 | 818 | 188.5 |
| C | 10 | 22 | 61573 | 322.27 | 813 | 818 | 188.5 |
| D | 8 | 195 | 490280 | 2521.25 | 825 | 809 | 194.1 |
| D | 7 | 80 | 418754 | 2152.82 | 825 | 809 | 194.1 |
| D | 7 | 238 | 109787 | 561.34 | 825 | 809 | 194.1 |
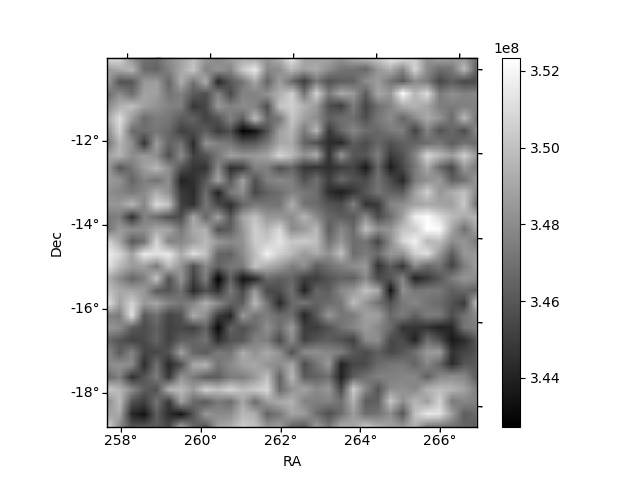
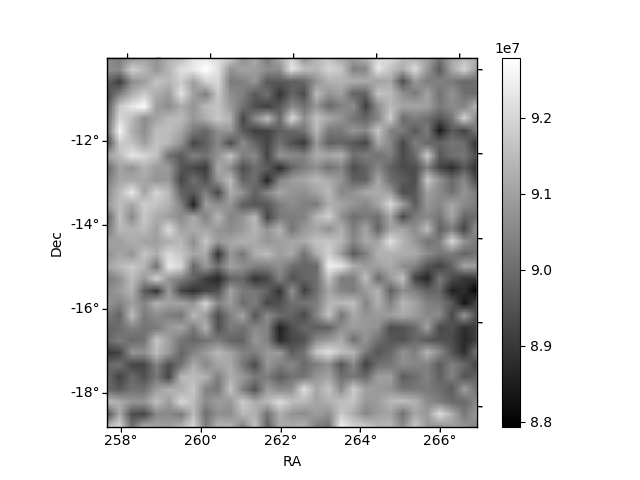
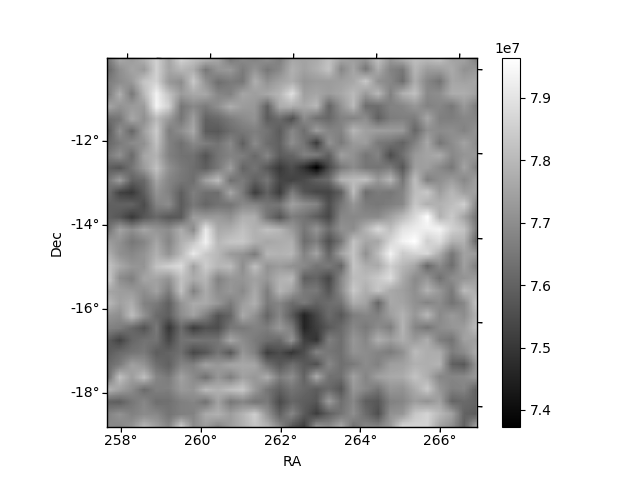
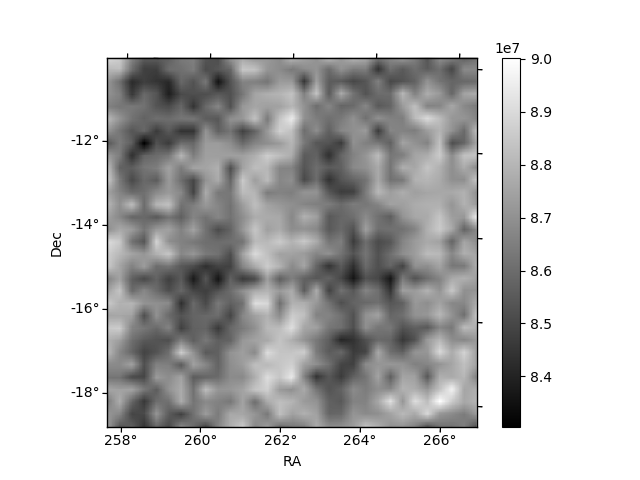
Histogram calculated using DETX and DETY for each event in the final _common_clean file
| Quadrant A | 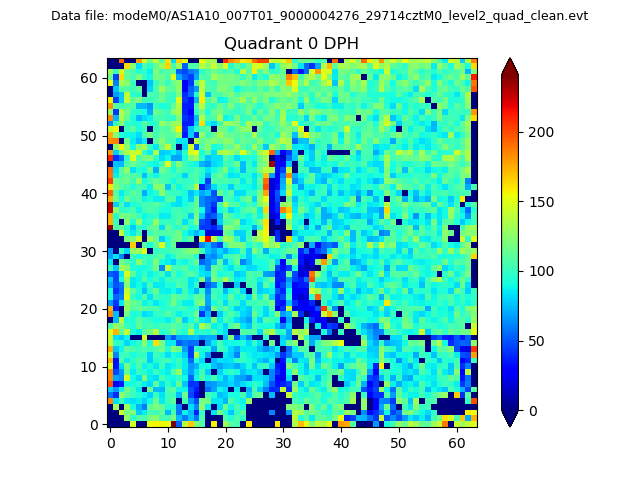 |
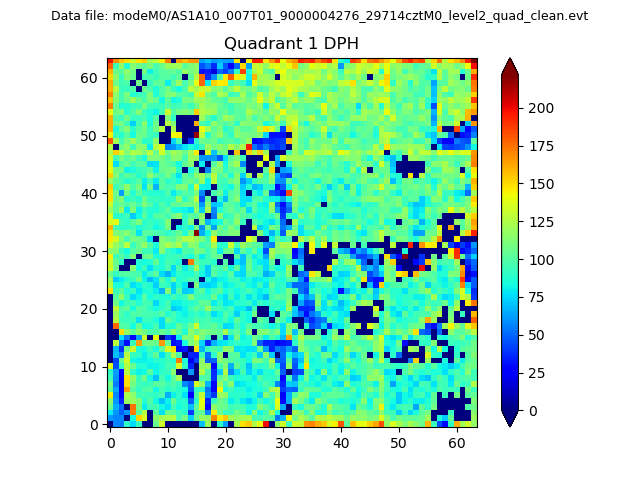 |
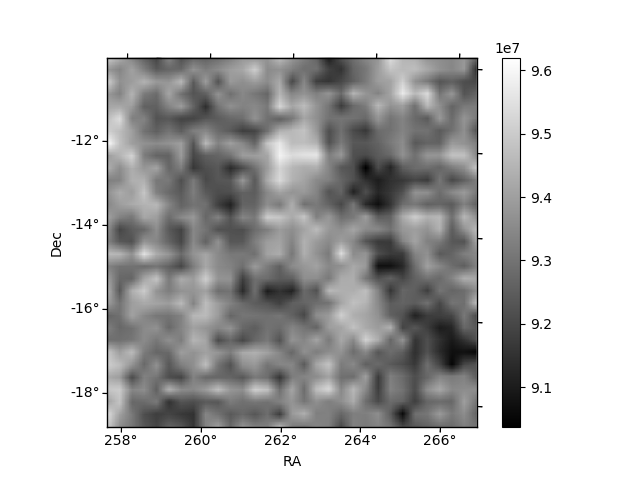
Quadrant B |
|---|---|---|---|
| Quadrant D | 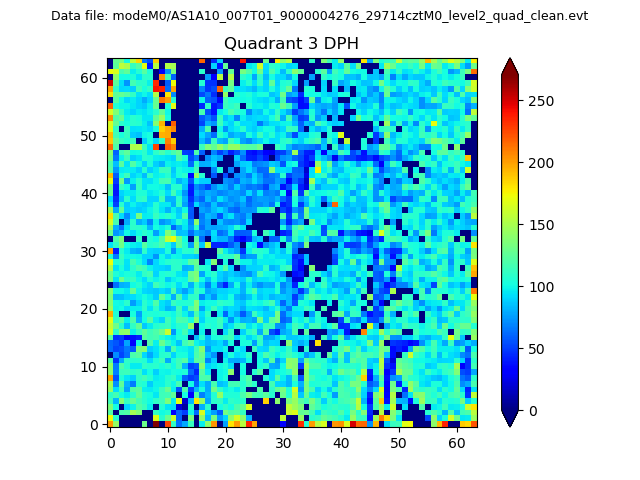 |
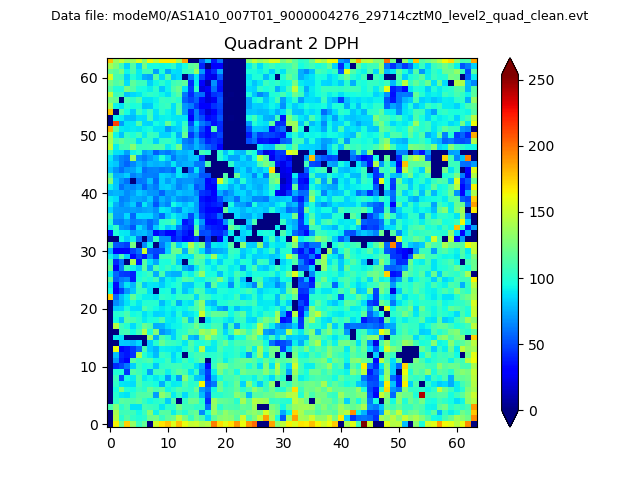 |
Quadrant C |
| Plot type | Count rate plots | Images |
|---|---|---|
| Comparison with Poisson distribution Blue bars denote a histogram of data divided into 1 sec bins. Red curve is a Poisson curve with rate = median count rate of data. |
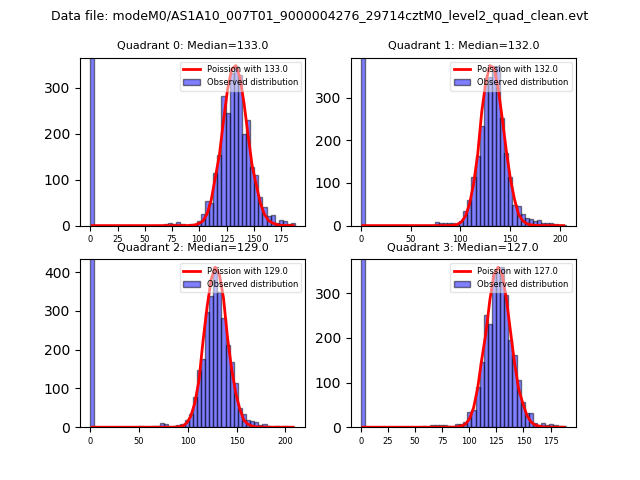 |
 |
| Quadrant-wise count rates Data is divided into 100 sec bins |
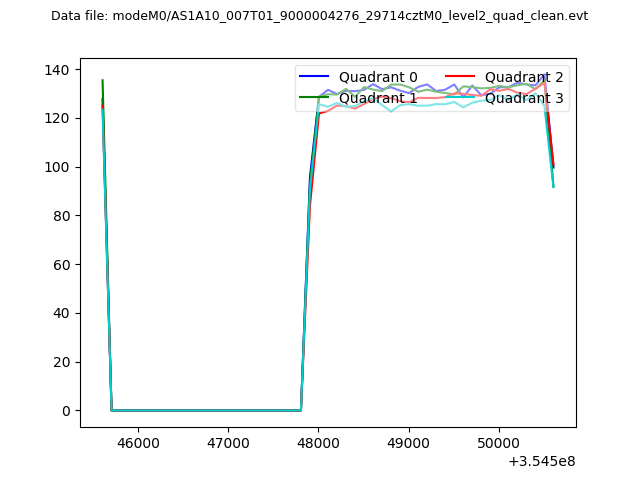 |
|
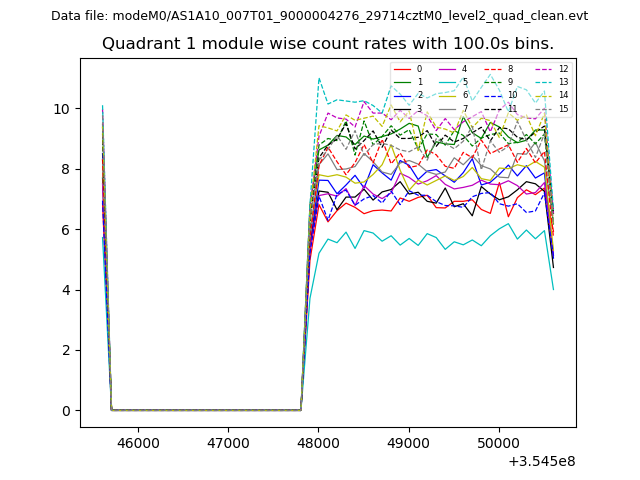
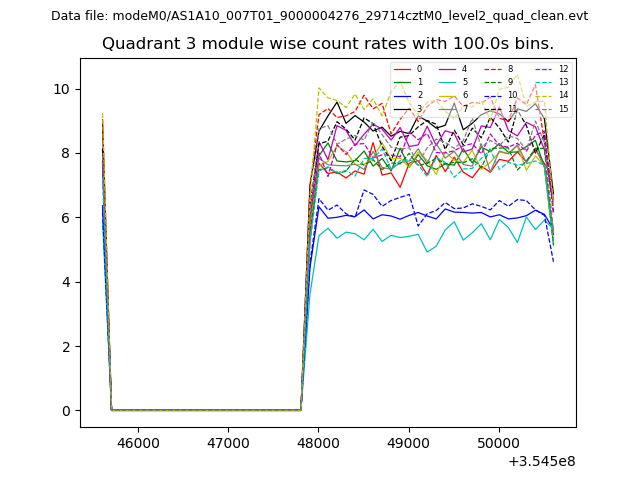
| Module-wise count rates for Quadrant A Data is divided into 100 sec bins |
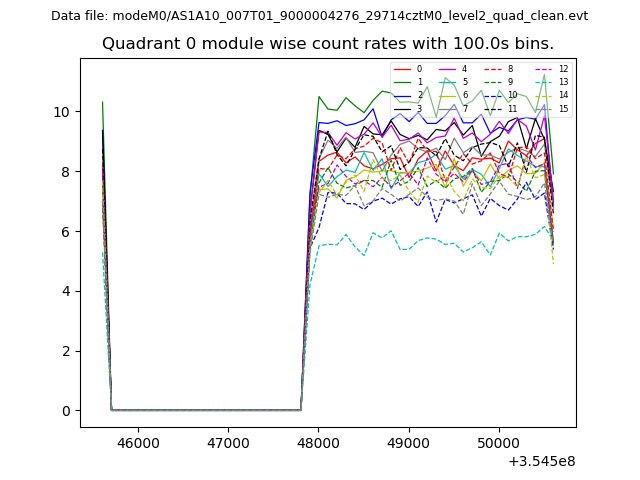 |
 |
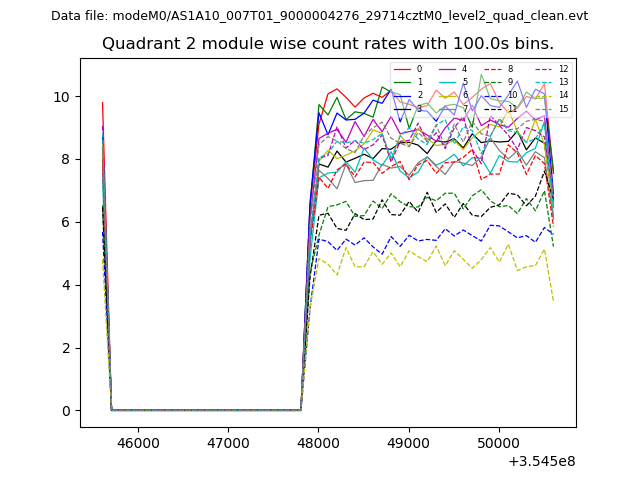
| Module-wise count rates for Quadrant B Data is divided into 100 sec bins |
 |
 |
| Module-wise count rates for Quadrant C Data is divided into 100 sec bins |
 |
 |
| Module-wise count rates for Quadrant D Data is divided into 100 sec bins |
 |
 |
| Parameter | Plot |
|---|---|
| CZT HV Monitor | 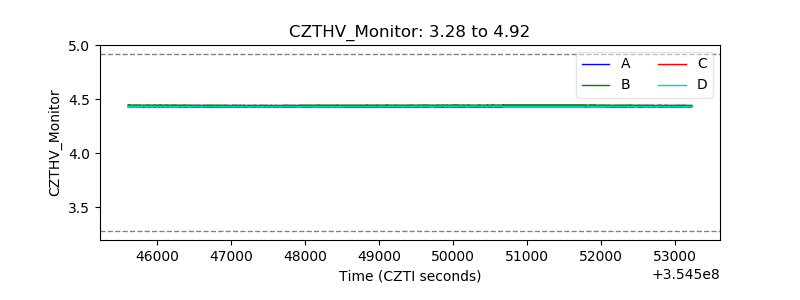 |
| D_VDD | 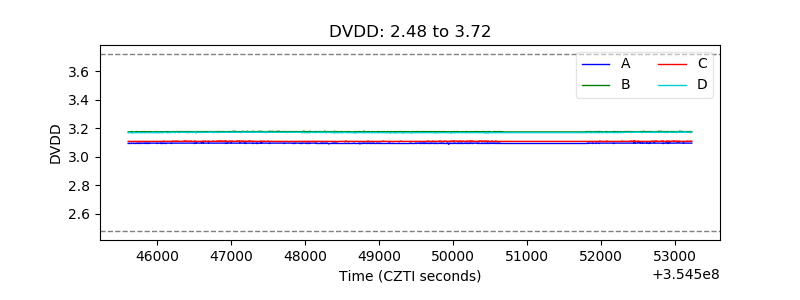 |
| Temperature 1 | 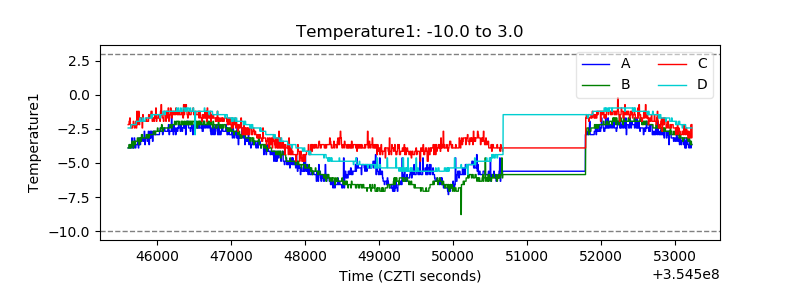 |
| Veto HV Monitor | 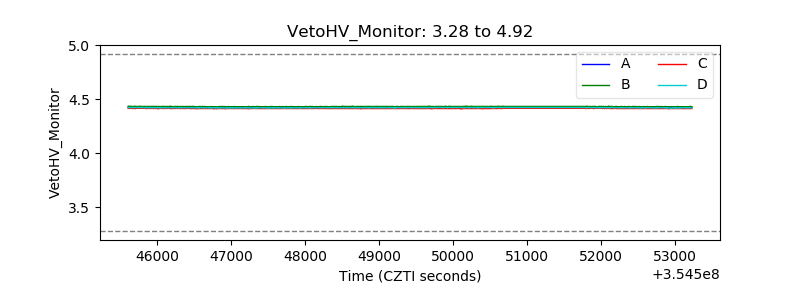 |
| Veto LLD | 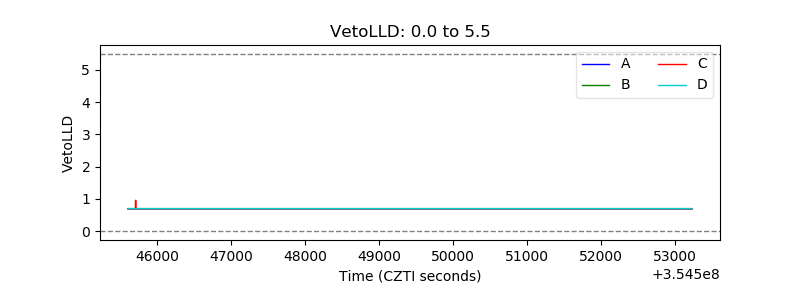 |
| Alpha Counter | 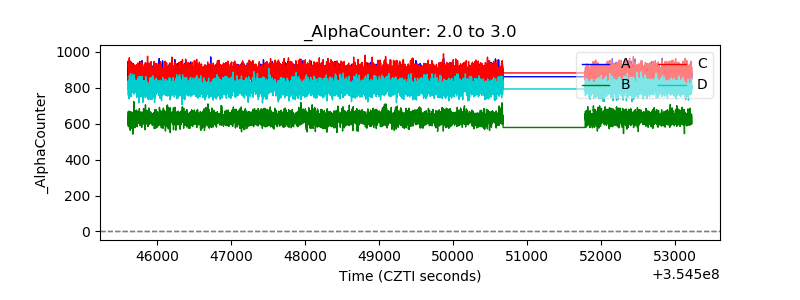 |
| _CPM_Rate | 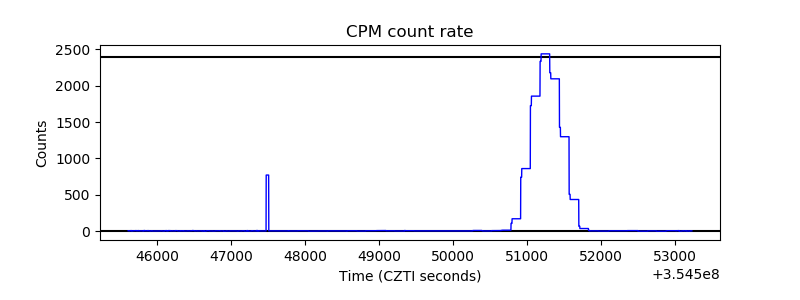 |
| CZT Counter | 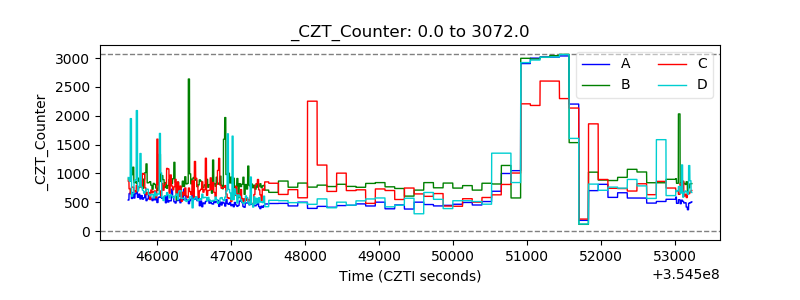 |
| +2.5 Volts monitor | 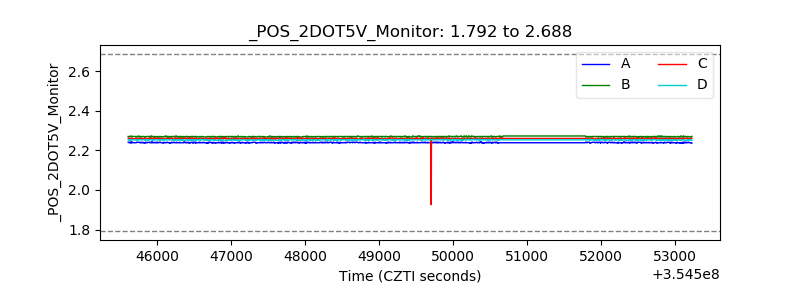 |
| +5 Volts monitor | 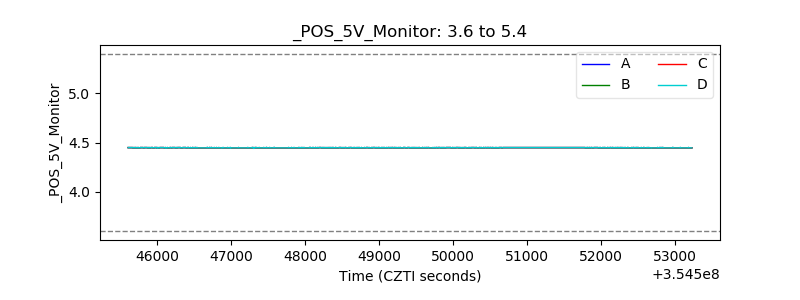 |
| _ROLL_ROT | 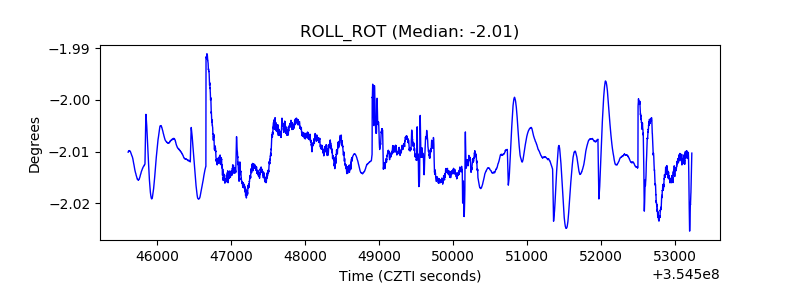 |
| _Roll_DEC | 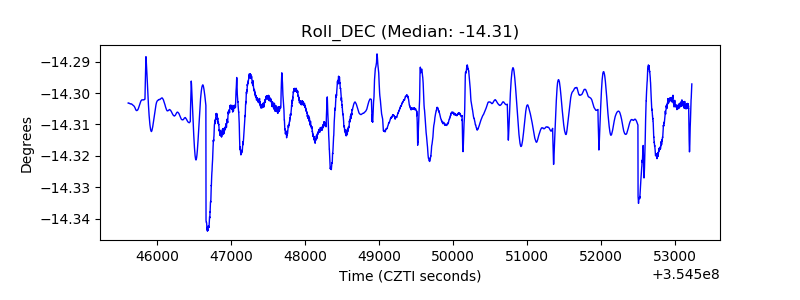 |
| _Roll_RA | 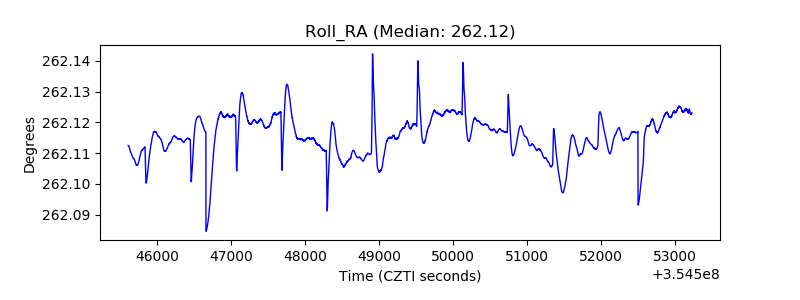 |
| Veto Counter | 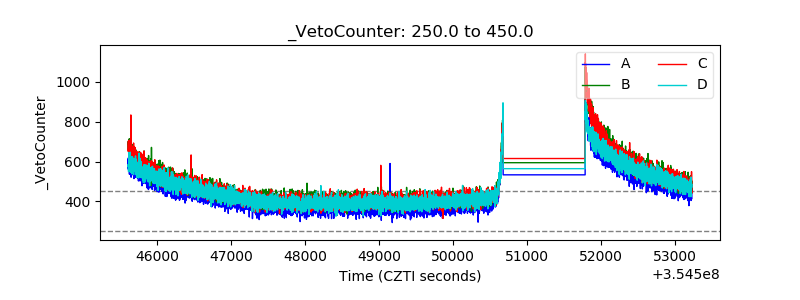 |