| Param | Original file | Final file |
|---|---|---|
| Filename | modeM0/AS1A10_007T01_9000004276_29717cztM0_level2.evt | modeM0/AS1A10_007T01_9000004276_29717cztM0_level2_quad_clean.evt |
| Size (bytes) | 632,640,960 | 92,105,280 |
| Size | 603.3 MB | 87.8 MB |
| Events in quadrant A | 3,147,894 | 620,373 |
| Events in quadrant B | 5,216,618 | 628,480 |
| Events in quadrant C | 6,475,990 | 542,159 |
| Events in quadrant D | 3,921,250 | 586,110 |
| Mode SS | |||
|---|---|---|---|
| Quadrant | BADHDUFLAG | Total packets | Discarded packets |
| A | 0 | 120 | 0 |
| B | 0 | 120 | 0 |
| C | 0 | 120 | 0 |
| D | 0 | 120 | 0 |
| Mode M0 | |||
|---|---|---|---|
| Quadrant | BADHDUFLAG | Total packets | Discarded packets |
| A | 0 | 12977 | 1 |
| B | 0 | 19221 | 1 |
| C | 0 | 23629 | 1 |
| D | 0 | 15623 | 1 |
| Mode M9 | |||
|---|---|---|---|
| Quadrant | BADHDUFLAG | Total packets | Discarded packets |
| A | 0 | 13 | 0 |
| B | 0 | 13 | 0 |
| C | 0 | 13 | 0 |
| D | 0 | 13 | 0 |
| Quadrant | Total seconds | Saturated seconds | Saturation percentage |
|---|---|---|---|
| A | 5894 | 68 | 1.153716% |
| B | 5894 | 206 | 3.495080% |
| C | 5894 | 1019 | 17.288768% |
| D | 5894 | 50 | 0.848320% |
Noise dominated data is calculated using 1-second bins in cleaned event files. If a bin has >2000 counts, and if more than 50% of those come from <1% of pixels, then it is considered to be noise-dominated and hence unusable.
| Quadrant | # 1 sec bins | Bins with >0 counts | Bins with >2000 counts | High rate bins dominated by noise | Noise dominated (total time) | Noise dominated (detector-on time) | Marked lightcurve |
|---|---|---|---|---|---|---|---|
| A | 7229 | 5894 | 0 | 0 | 0.00% | 0.00% | 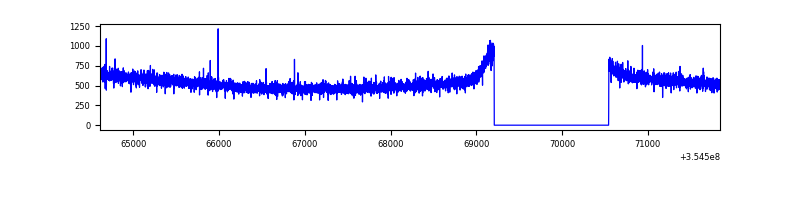 |
| B | 7229 | 5894 | 31 | 31 | 0.43% | 0.53% | 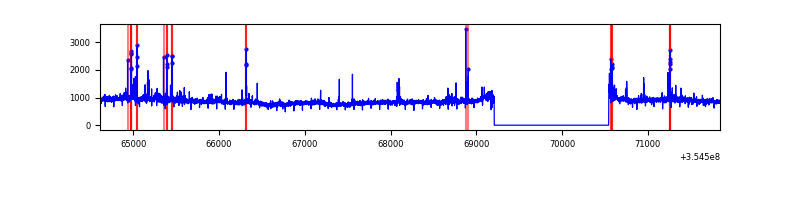 |
| C | 7229 | 5894 | 720 | 720 | 9.96% | 12.22% | 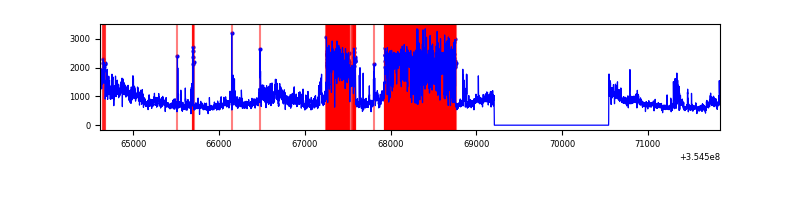 |
| D | 7229 | 5895 | 6 | 6 | 0.08% | 0.10% | 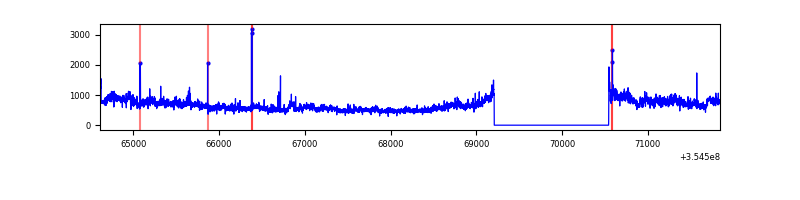 |
Top three noisy pixels from each quadrant. If the there are fewer than three noisy pixels in the level2.evt file, extra rows are filled as -1
| Pixel properties | Quadrant properties | ||||||
|---|---|---|---|---|---|---|---|
| Quadrant | DetID | PixID | Counts | Sigma | Mean | Median | Sigma |
| A | 13 | 254 | 12047 | 68.93 | 815 | 800 | 163.2 |
| A | 3 | 137 | 7617 | 41.78 | 815 | 800 | 163.2 |
| A | 0 | 226 | 6880 | 37.26 | 815 | 800 | 163.2 |
| B | 6 | 159 | 1816789 | 12000.23 | 809 | 793 | 151.3 |
| B | 0 | 229 | 129827 | 852.67 | 809 | 793 | 151.3 |
| B | 10 | 245 | 39689 | 257.03 | 809 | 793 | 151.3 |
| C | 3 | 233 | 3330604 | 19208.08 | 741 | 748 | 173.4 |
| C | 14 | 238 | 122210 | 700.65 | 741 | 748 | 173.4 |
| C | 10 | 22 | 74285 | 424.19 | 741 | 748 | 173.4 |
| D | 8 | 195 | 769805 | 4173.95 | 786 | 769 | 184.2 |
| D | 13 | 172 | 64850 | 347.8 | 786 | 769 | 184.2 |
| D | 12 | 227 | 38291 | 203.65 | 786 | 769 | 184.2 |
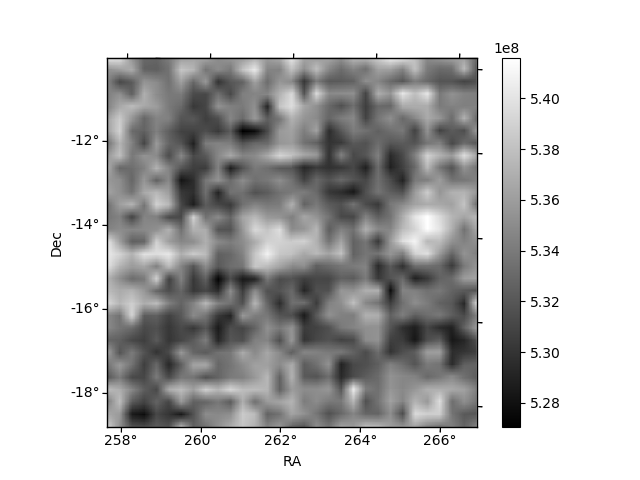
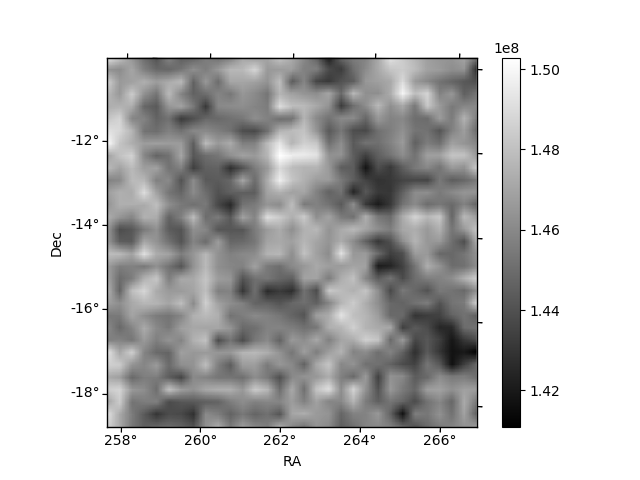
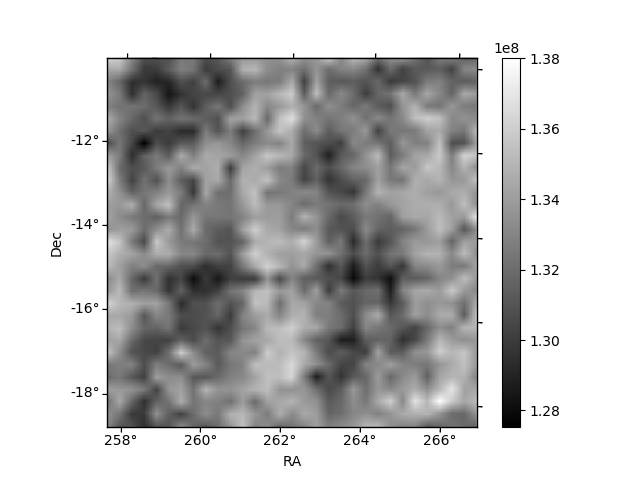
Histogram calculated using DETX and DETY for each event in the final _common_clean file
| Quadrant A | 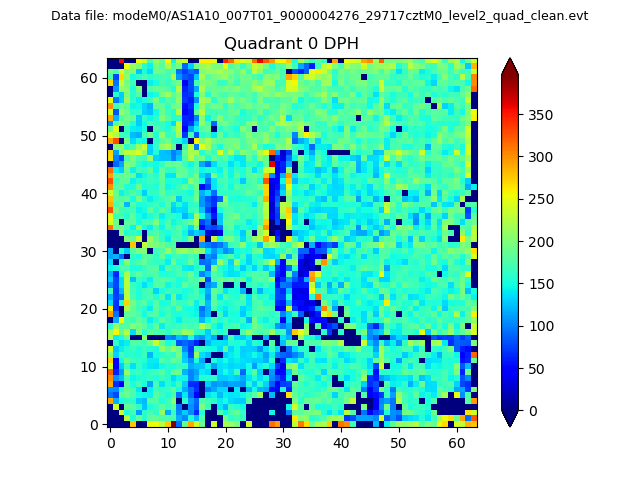 |
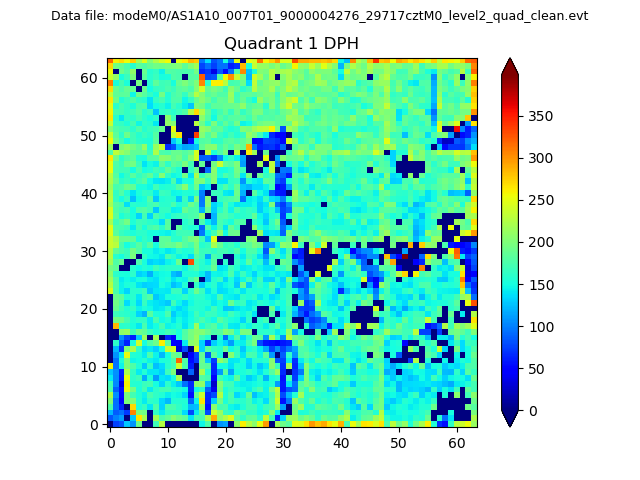 |
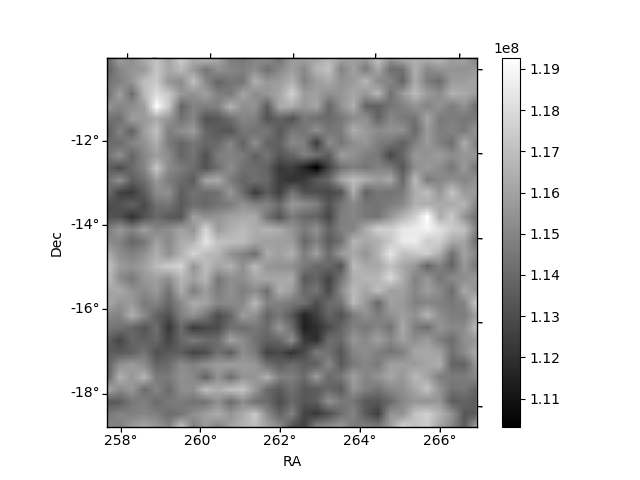
Quadrant B |
|---|---|---|---|
| Quadrant D | 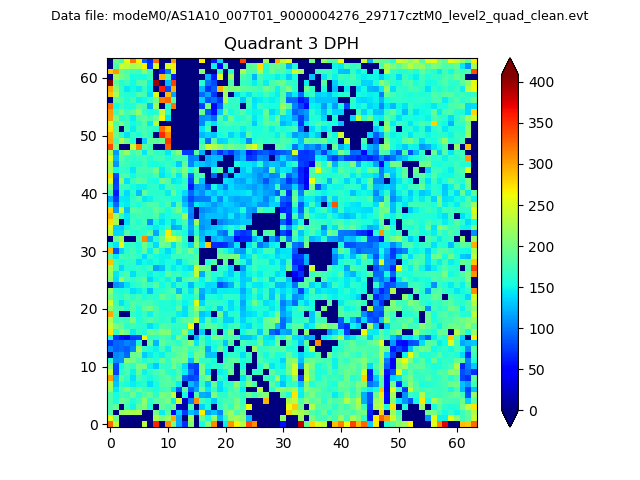 |
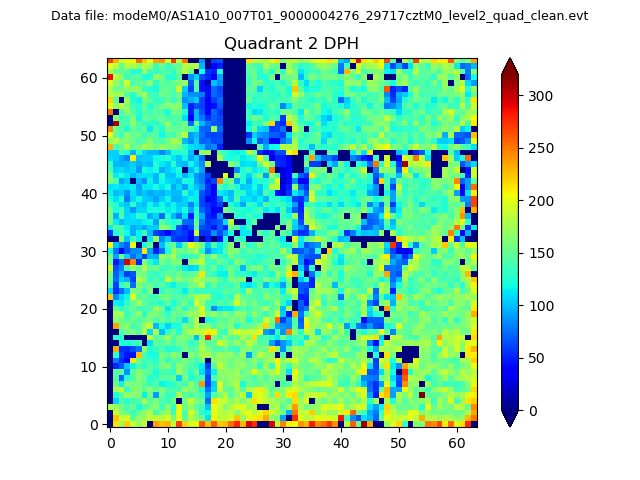 |
Quadrant C |
| Plot type | Count rate plots | Images |
|---|---|---|
| Comparison with Poisson distribution Blue bars denote a histogram of data divided into 1 sec bins. Red curve is a Poisson curve with rate = median count rate of data. |
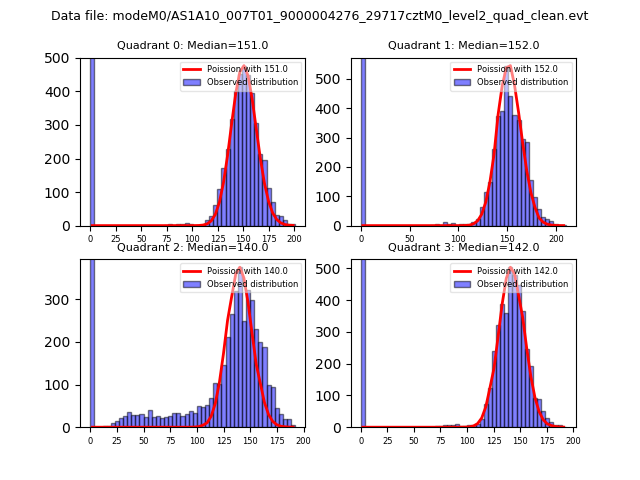 |
 |
| Quadrant-wise count rates Data is divided into 100 sec bins |
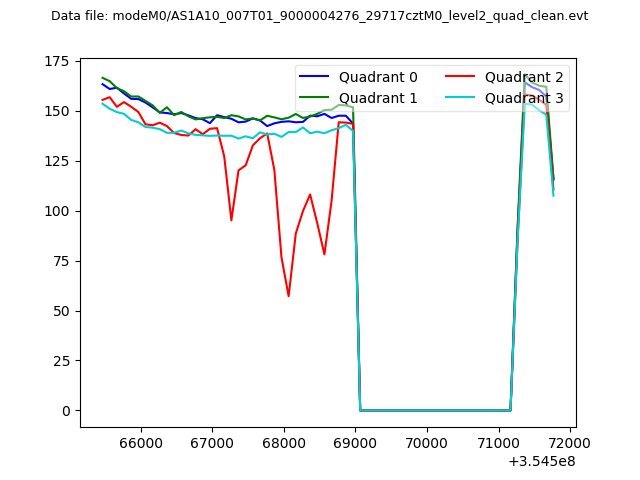 |
|
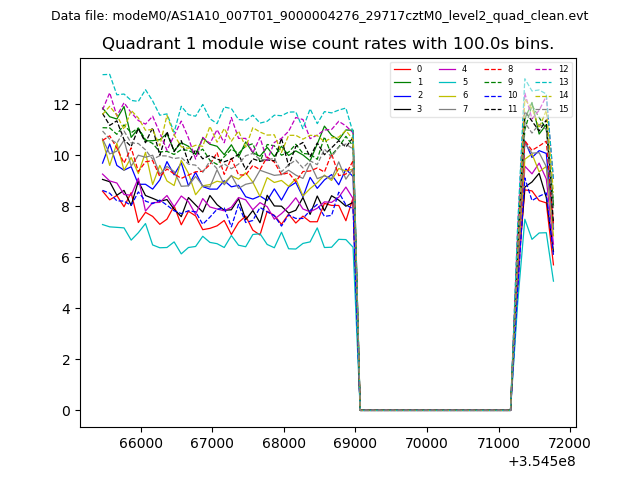
| Module-wise count rates for Quadrant A Data is divided into 100 sec bins |
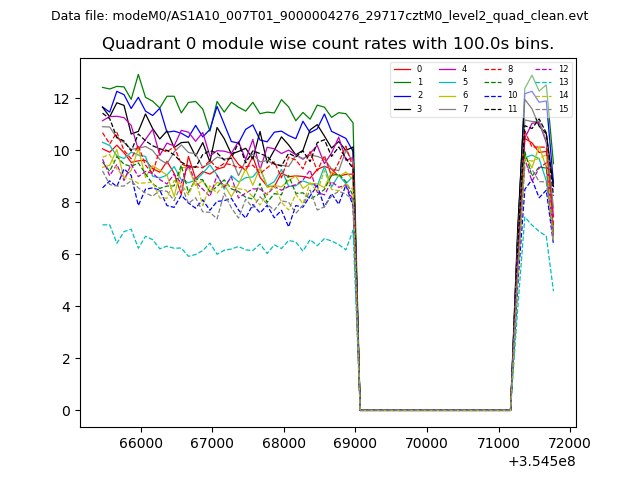 |
 |
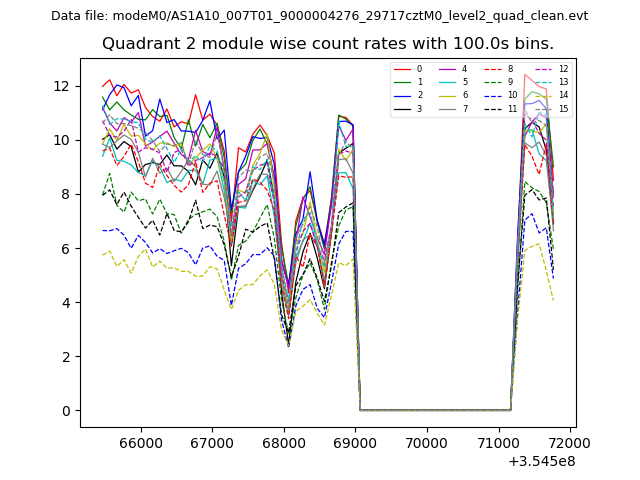
| Module-wise count rates for Quadrant B Data is divided into 100 sec bins |
 |
 |
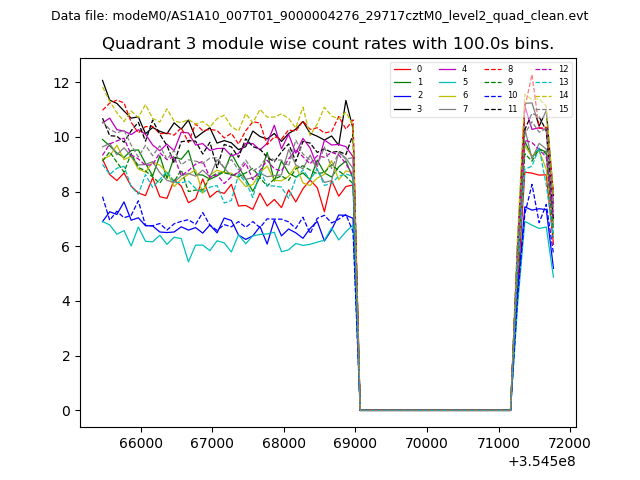
| Module-wise count rates for Quadrant C Data is divided into 100 sec bins |
 |
 |
| Module-wise count rates for Quadrant D Data is divided into 100 sec bins |
 |
 |
| Parameter | Plot |
|---|---|
| CZT HV Monitor | 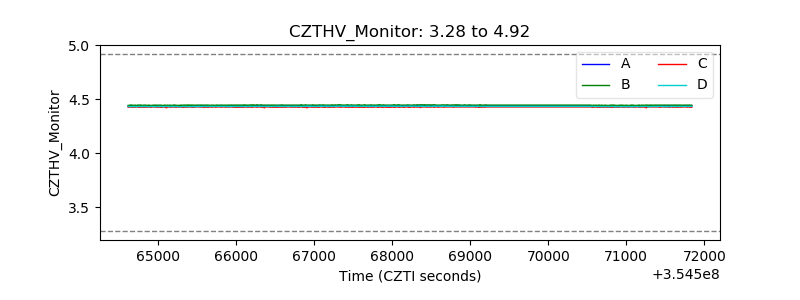 |
| D_VDD | 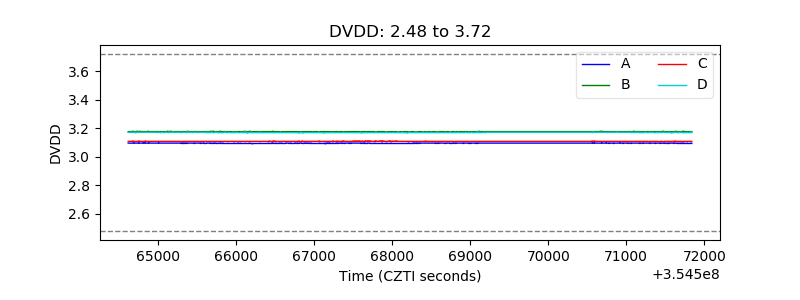 |
| Temperature 1 |  |
| Veto HV Monitor | 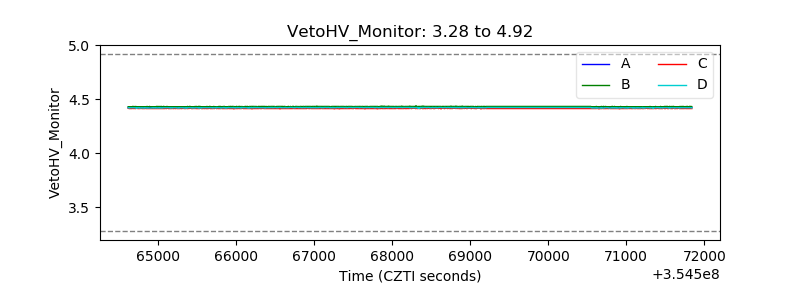 |
| Veto LLD | 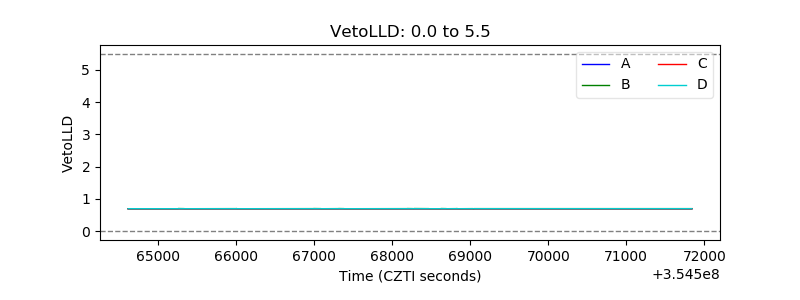 |
| Alpha Counter | 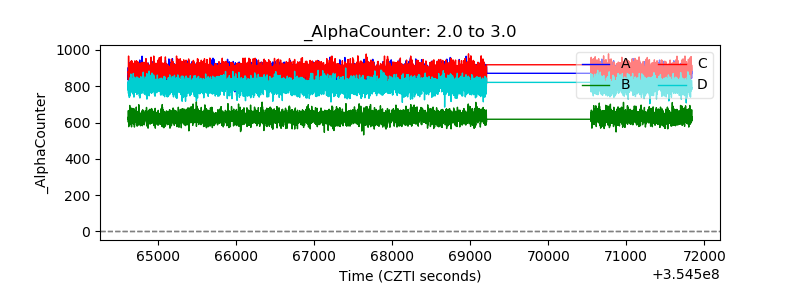 |
| _CPM_Rate | 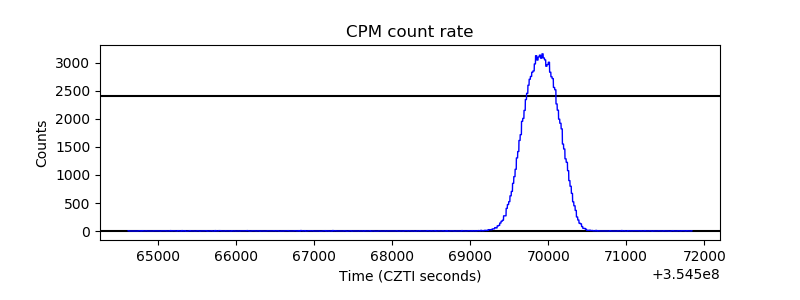 |
| CZT Counter | 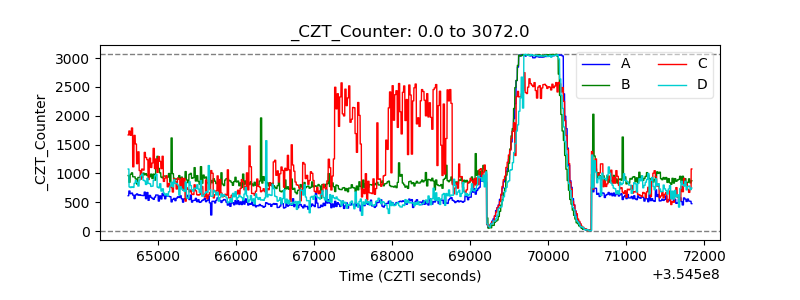 |
| +2.5 Volts monitor | 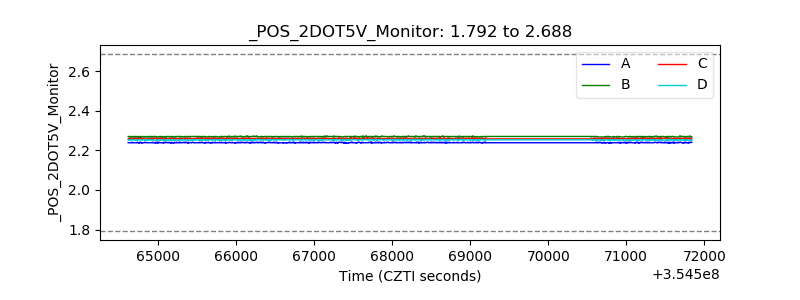 |
| +5 Volts monitor |  |
| _ROLL_ROT | 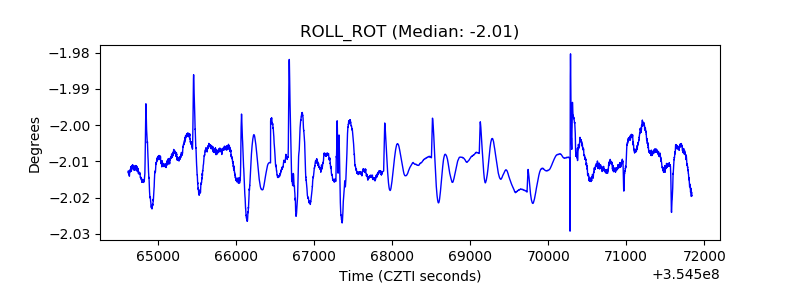 |
| _Roll_DEC | 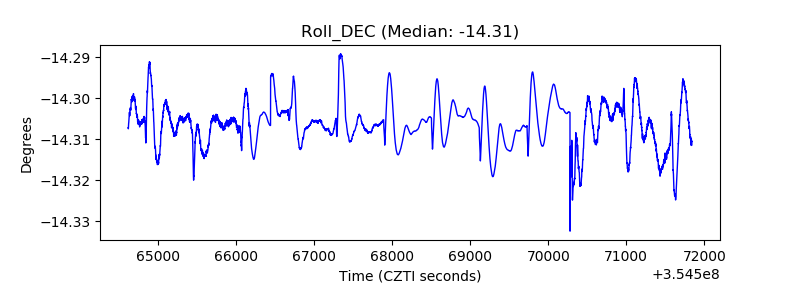 |
| _Roll_RA | 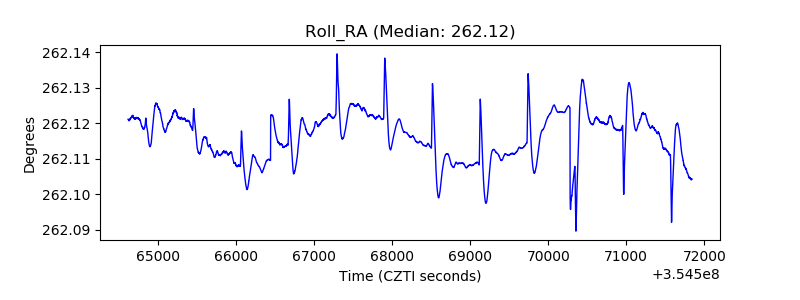 |
| Veto Counter | 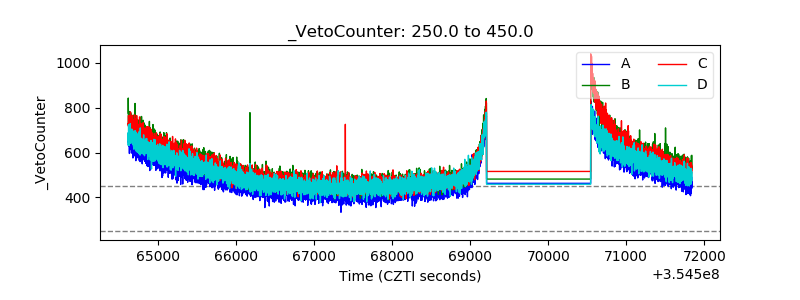 |