| Param | Original file | Final file |
|---|---|---|
| Filename | modeM0/AS1A10_007T01_9000004276_29718cztM0_level2.evt | modeM0/AS1A10_007T01_9000004276_29718cztM0_level2_quad_clean.evt |
| Size (bytes) | 590,437,440 | 101,067,840 |
| Size | 563.1 MB | 96.4 MB |
| Events in quadrant A | 3,300,448 | 666,382 |
| Events in quadrant B | 5,500,090 | 675,334 |
| Events in quadrant C | 4,422,927 | 648,076 |
| Events in quadrant D | 4,230,718 | 629,949 |
| Mode SS | |||
|---|---|---|---|
| Quadrant | BADHDUFLAG | Total packets | Discarded packets |
| A | 0 | 130 | 0 |
| B | 0 | 130 | 0 |
| C | 0 | 130 | 0 |
| D | 0 | 130 | 0 |
| Mode M0 | |||
|---|---|---|---|
| Quadrant | BADHDUFLAG | Total packets | Discarded packets |
| A | 0 | 13678 | 2 |
| B | 0 | 20255 | 2 |
| C | 0 | 17433 | 3 |
| D | 0 | 16891 | 2 |
| Mode M9 | |||
|---|---|---|---|
| Quadrant | BADHDUFLAG | Total packets | Discarded packets |
| A | 0 | 22 | 0 |
| B | 0 | 23 | 0 |
| C | 0 | 23 | 0 |
| D | 0 | 23 | 0 |
| Quadrant | Total seconds | Saturated seconds | Saturation percentage |
|---|---|---|---|
| A | 6317 | 100 | 1.583030% |
| B | 6317 | 243 | 3.846763% |
| C | 6316 | 271 | 4.290690% |
| D | 6316 | 117 | 1.852438% |
Noise dominated data is calculated using 1-second bins in cleaned event files. If a bin has >2000 counts, and if more than 50% of those come from <1% of pixels, then it is considered to be noise-dominated and hence unusable.
| Quadrant | # 1 sec bins | Bins with >0 counts | Bins with >2000 counts | High rate bins dominated by noise | Noise dominated (total time) | Noise dominated (detector-on time) | Marked lightcurve |
|---|---|---|---|---|---|---|---|
| A | 7557 | 6317 | 0 | 0 | 0.00% | 0.00% | 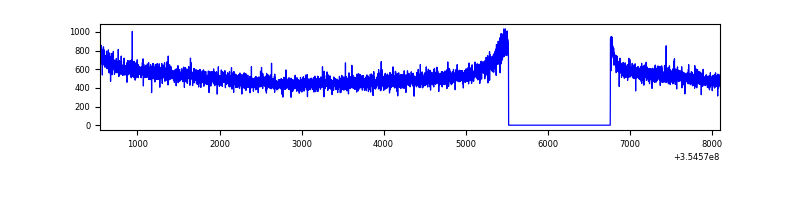 |
| B | 7557 | 6317 | 26 | 26 | 0.34% | 0.41% | 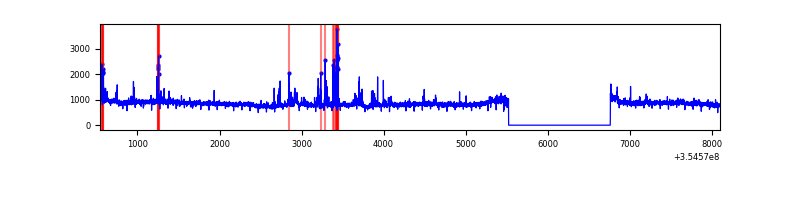 |
| C | 7556 | 6316 | 29 | 29 | 0.38% | 0.46% | 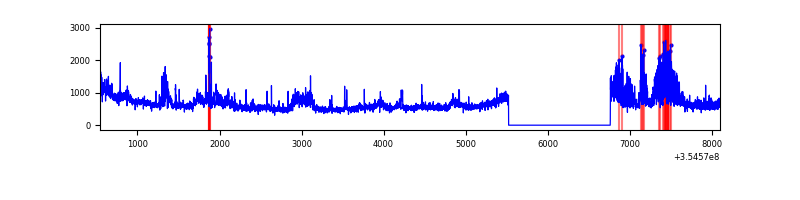 |
| D | 7556 | 6316 | 35 | 35 | 0.46% | 0.55% | 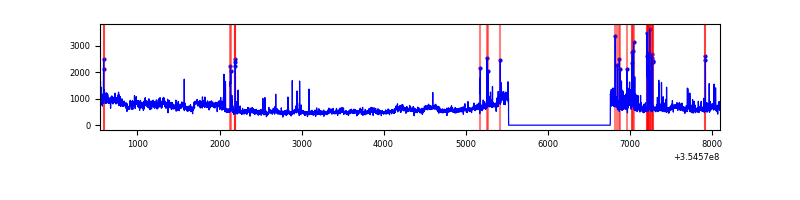 |
Top three noisy pixels from each quadrant. If the there are fewer than three noisy pixels in the level2.evt file, extra rows are filled as -1
| Pixel properties | Quadrant properties | ||||||
|---|---|---|---|---|---|---|---|
| Quadrant | DetID | PixID | Counts | Sigma | Mean | Median | Sigma |
| A | 13 | 254 | 12209 | 66.42 | 855 | 840 | 171.2 |
| A | 3 | 137 | 8056 | 42.16 | 855 | 840 | 171.2 |
| A | 0 | 226 | 7297 | 37.72 | 855 | 840 | 171.2 |
| B | 6 | 159 | 1906102 | 11869.5 | 850 | 831 | 160.5 |
| B | 0 | 229 | 177461 | 1100.37 | 850 | 831 | 160.5 |
| B | 10 | 245 | 52698 | 323.12 | 850 | 831 | 160.5 |
| C | 3 | 233 | 927813 | 4803.4 | 824 | 832 | 193.0 |
| C | 14 | 238 | 138654 | 714.16 | 824 | 832 | 193.0 |
| C | 7 | 247 | 64751 | 331.21 | 824 | 832 | 193.0 |
| D | 8 | 195 | 736916 | 3753.93 | 825 | 806 | 196.1 |
| D | 7 | 80 | 151516 | 768.57 | 825 | 806 | 196.1 |
| D | 13 | 172 | 64900 | 326.86 | 825 | 806 | 196.1 |
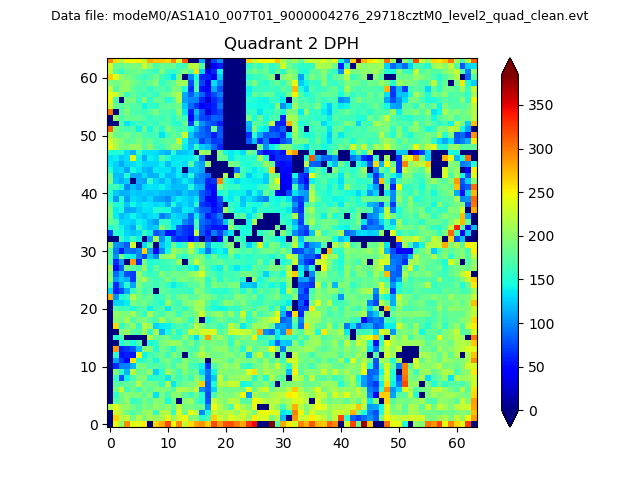
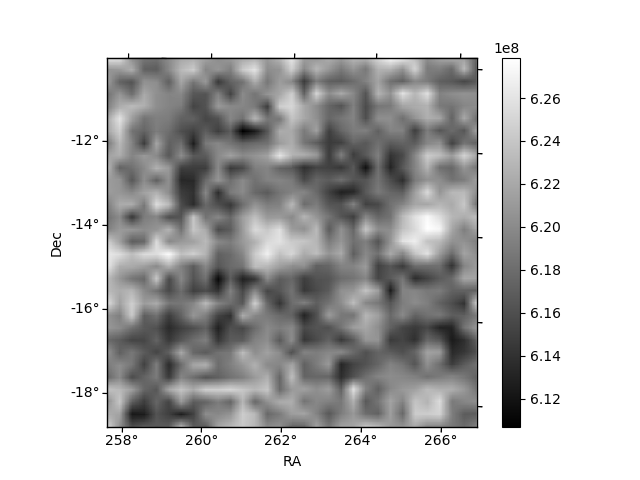
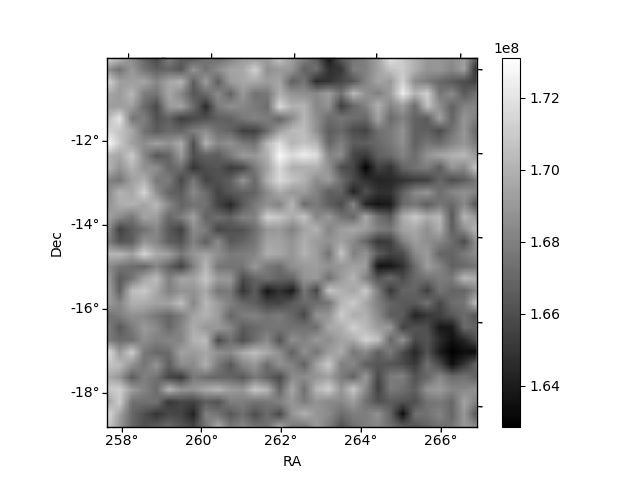
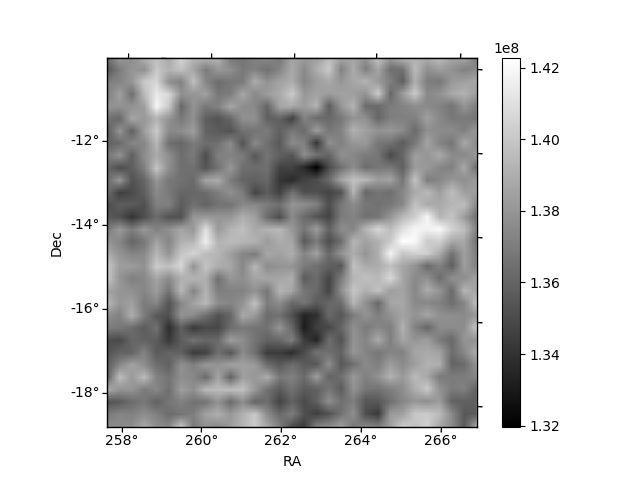
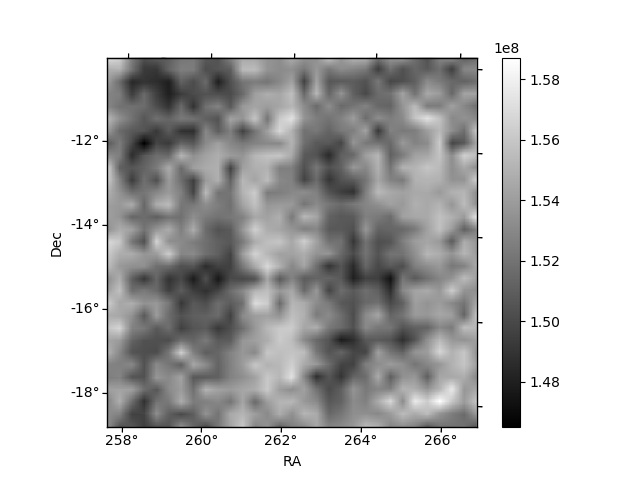
Histogram calculated using DETX and DETY for each event in the final _common_clean file
| Quadrant A | 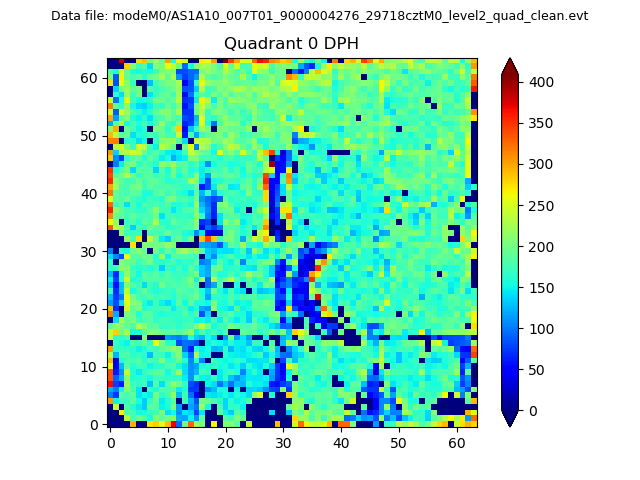 |
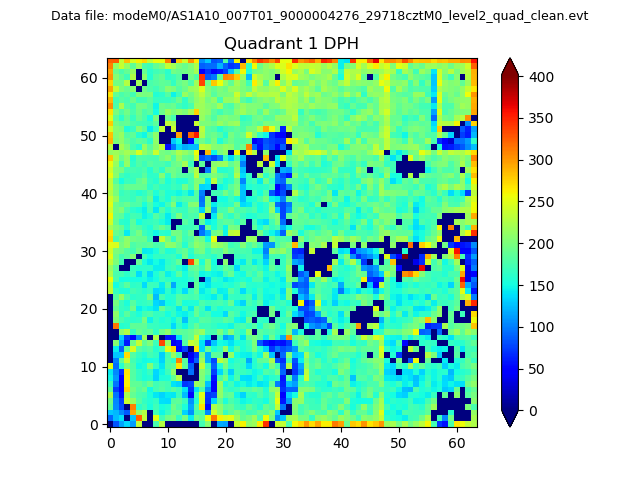 |
Quadrant B |
|---|---|---|---|
| Quadrant D | 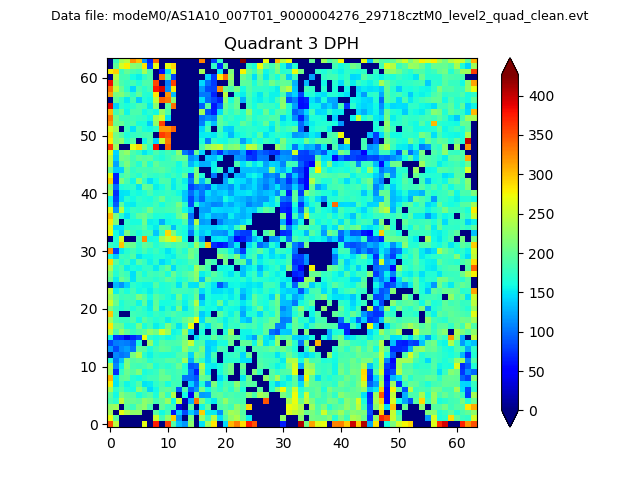 |
 |
Quadrant C |
| Plot type | Count rate plots | Images |
|---|---|---|
| Comparison with Poisson distribution Blue bars denote a histogram of data divided into 1 sec bins. Red curve is a Poisson curve with rate = median count rate of data. |
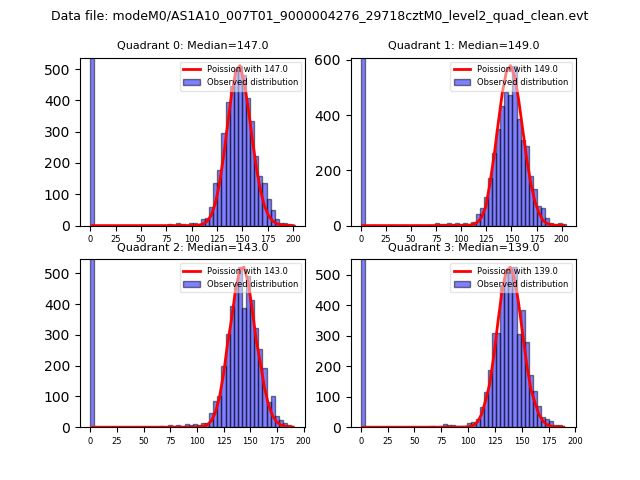 |
 |
| Quadrant-wise count rates Data is divided into 100 sec bins |
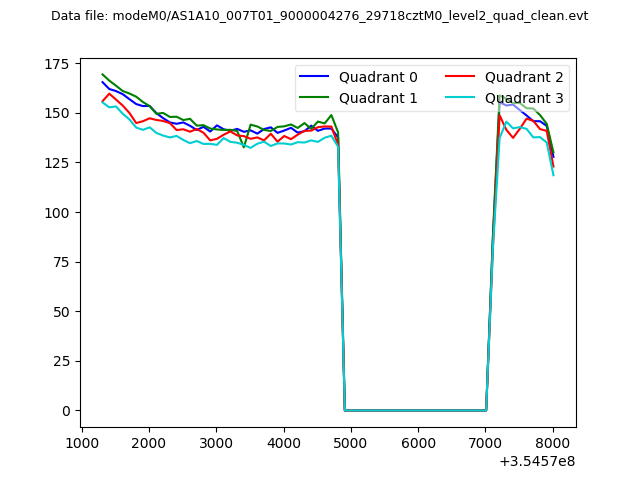 |
|
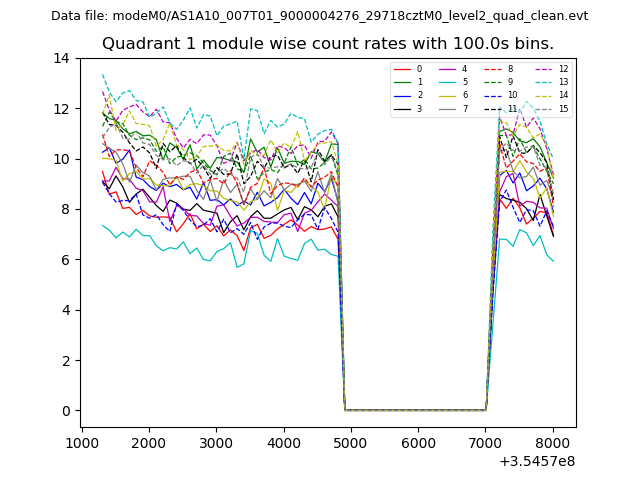
| Module-wise count rates for Quadrant A Data is divided into 100 sec bins |
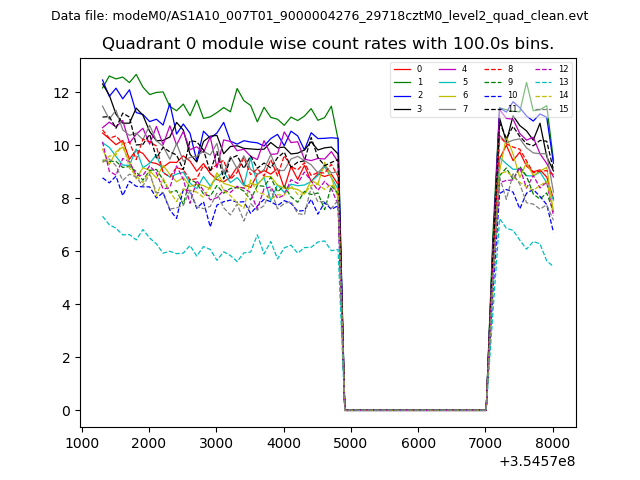 |
 |
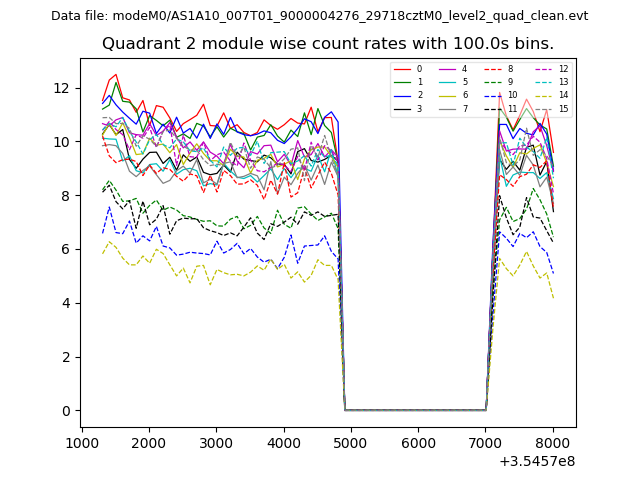
| Module-wise count rates for Quadrant B Data is divided into 100 sec bins |
 |
 |
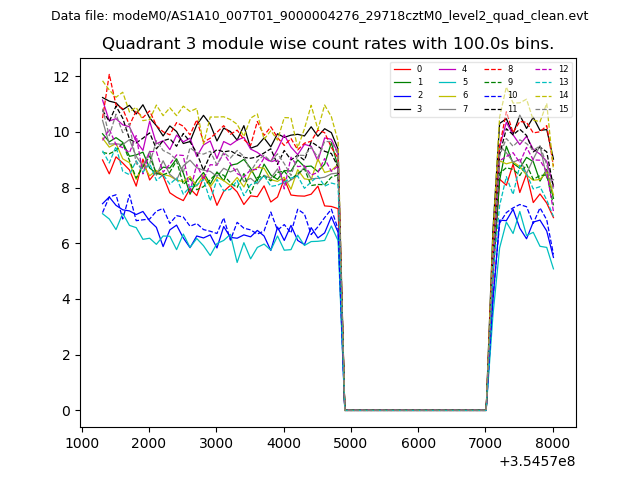
| Module-wise count rates for Quadrant C Data is divided into 100 sec bins |
 |
 |
| Module-wise count rates for Quadrant D Data is divided into 100 sec bins |
 |
 |
| Parameter | Plot |
|---|---|
| CZT HV Monitor | 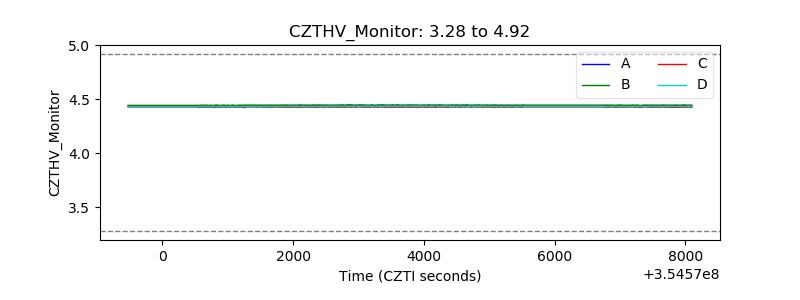 |
| D_VDD | 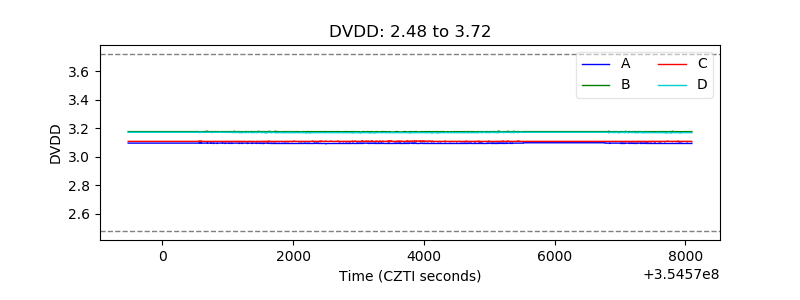 |
| Temperature 1 | 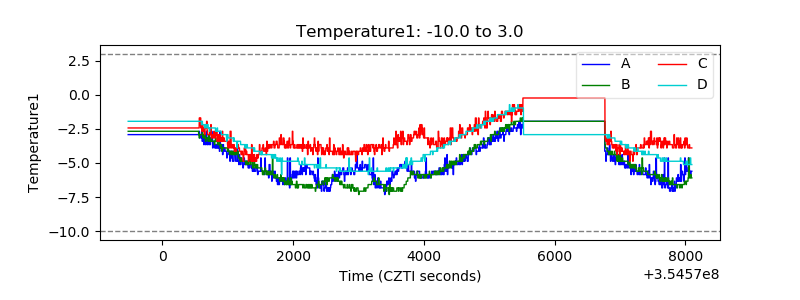 |
| Veto HV Monitor | 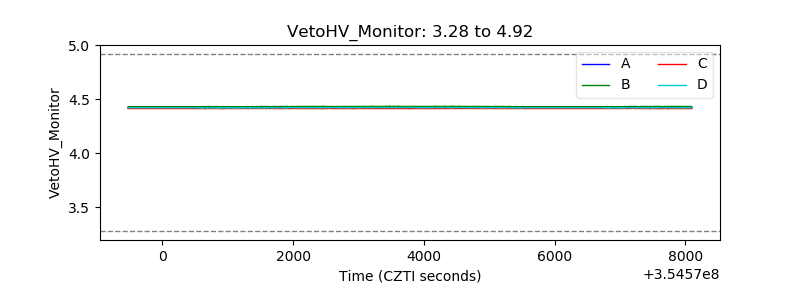 |
| Veto LLD | 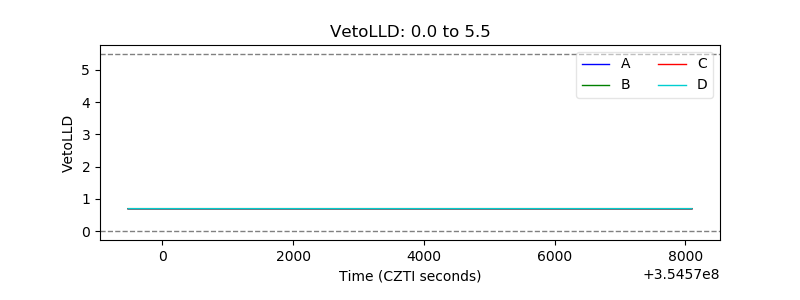 |
| Alpha Counter | 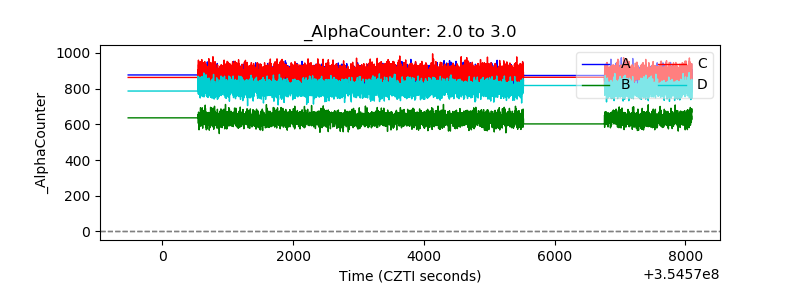 |
| _CPM_Rate | 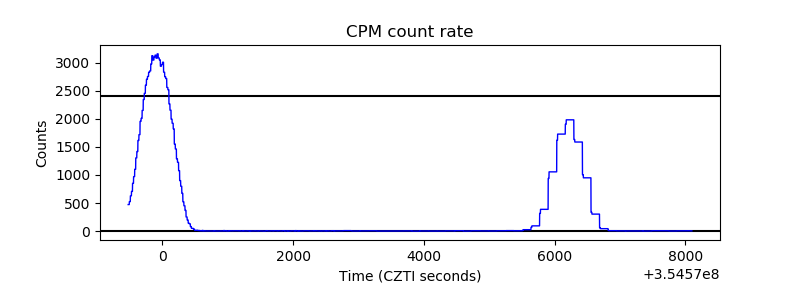 |
| CZT Counter |  |
| +2.5 Volts monitor |  |
| +5 Volts monitor |  |
| _ROLL_ROT | 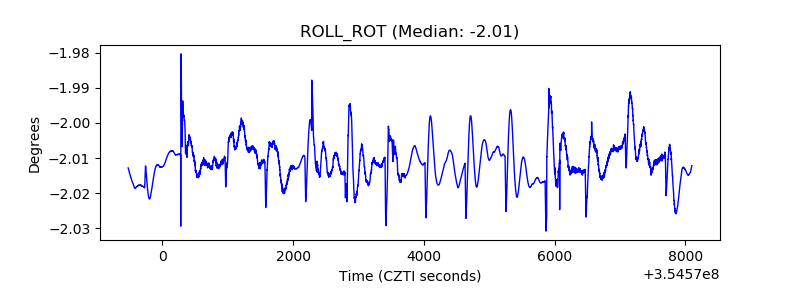 |
| _Roll_DEC |  |
| _Roll_RA | 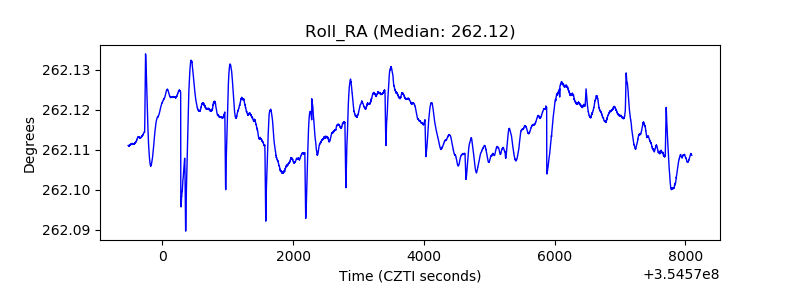 |
| Veto Counter | 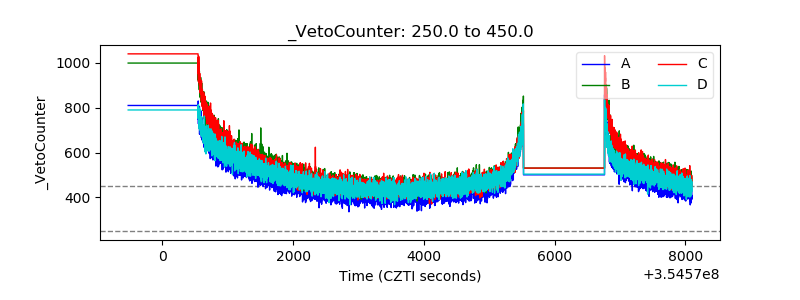 |