| Param | Original file | Final file |
|---|---|---|
| Filename | modeM0/AS1A10_007T01_9000004276_29719cztM0_level2.evt | modeM0/AS1A10_007T01_9000004276_29719cztM0_level2_quad_clean.evt |
| Size (bytes) | 585,138,240 | 103,829,760 |
| Size | 558.0 MB | 99.0 MB |
| Events in quadrant A | 3,203,636 | 681,163 |
| Events in quadrant B | 5,615,197 | 691,109 |
| Events in quadrant C | 4,223,941 | 671,376 |
| Events in quadrant D | 4,240,204 | 649,255 |
| Mode SS | |||
|---|---|---|---|
| Quadrant | BADHDUFLAG | Total packets | Discarded packets |
| A | 0 | 132 | 0 |
| B | 0 | 132 | 0 |
| C | 0 | 132 | 0 |
| D | 0 | 132 | 0 |
| Mode M0 | |||
|---|---|---|---|
| Quadrant | BADHDUFLAG | Total packets | Discarded packets |
| A | 0 | 13582 | 2 |
| B | 0 | 20942 | 2 |
| C | 0 | 16872 | 2 |
| D | 0 | 16923 | 2 |
| Mode M9 | |||
|---|---|---|---|
| Quadrant | BADHDUFLAG | Total packets | Discarded packets |
| A | 0 | 11 | 0 |
| B | 0 | 11 | 0 |
| C | 0 | 11 | 0 |
| D | 0 | 11 | 0 |
| Quadrant | Total seconds | Saturated seconds | Saturation percentage |
|---|---|---|---|
| A | 6474 | 42 | 0.648749% |
| B | 6475 | 225 | 3.474903% |
| C | 6475 | 242 | 3.737452% |
| D | 6475 | 78 | 1.204633% |
Noise dominated data is calculated using 1-second bins in cleaned event files. If a bin has >2000 counts, and if more than 50% of those come from <1% of pixels, then it is considered to be noise-dominated and hence unusable.
| Quadrant | # 1 sec bins | Bins with >0 counts | Bins with >2000 counts | High rate bins dominated by noise | Noise dominated (total time) | Noise dominated (detector-on time) | Marked lightcurve |
|---|---|---|---|---|---|---|---|
| A | 7574 | 6475 | 0 | 0 | 0.00% | 0.00% | 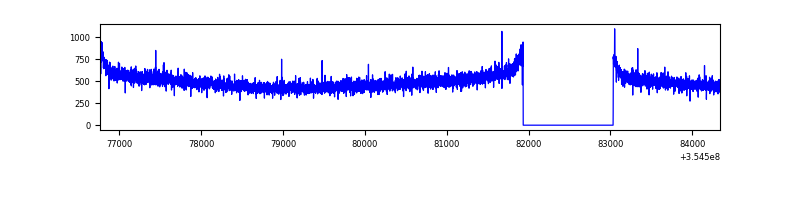 |
| B | 7575 | 6475 | 34 | 34 | 0.45% | 0.53% | 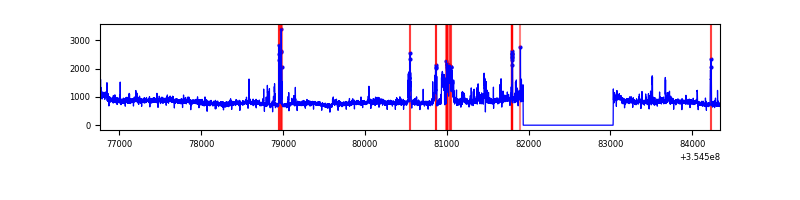 |
| C | 7575 | 6476 | 28 | 28 | 0.37% | 0.43% |  |
| D | 7575 | 6476 | 38 | 38 | 0.50% | 0.59% | 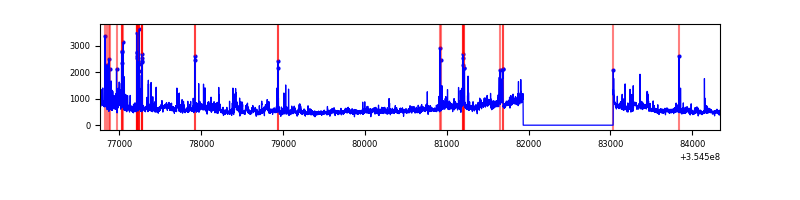 |
Top three noisy pixels from each quadrant. If the there are fewer than three noisy pixels in the level2.evt file, extra rows are filled as -1
| Pixel properties | Quadrant properties | ||||||
|---|---|---|---|---|---|---|---|
| Quadrant | DetID | PixID | Counts | Sigma | Mean | Median | Sigma |
| A | 13 | 254 | 12178 | 67.91 | 830 | 814 | 167.3 |
| A | 3 | 137 | 8029 | 43.12 | 830 | 814 | 167.3 |
| A | 0 | 226 | 6838 | 36.0 | 830 | 814 | 167.3 |
| B | 6 | 159 | 1920167 | 12147.7 | 826 | 804 | 158.0 |
| B | 0 | 229 | 343787 | 2170.75 | 826 | 804 | 158.0 |
| B | 10 | 245 | 70665 | 442.15 | 826 | 804 | 158.0 |
| C | 3 | 233 | 863446 | 4557.24 | 808 | 819 | 189.3 |
| C | 14 | 238 | 132363 | 694.94 | 808 | 819 | 189.3 |
| C | 10 | 22 | 49303 | 256.14 | 808 | 819 | 189.3 |
| D | 8 | 195 | 716635 | 3748.02 | 805 | 786 | 191.0 |
| D | 7 | 80 | 160666 | 837.09 | 805 | 786 | 191.0 |
| D | 7 | 238 | 80773 | 418.79 | 805 | 786 | 191.0 |
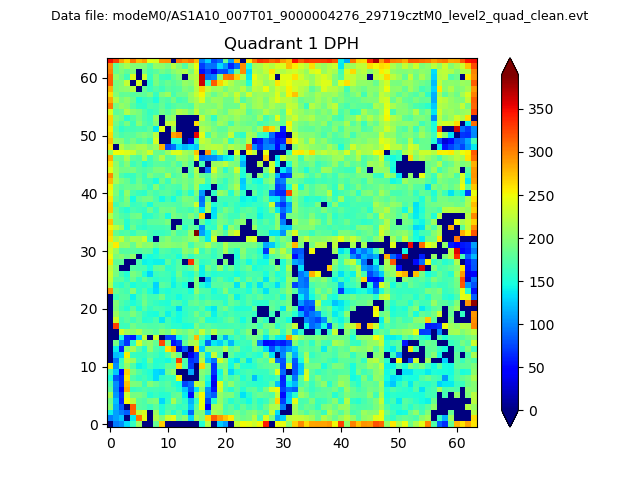
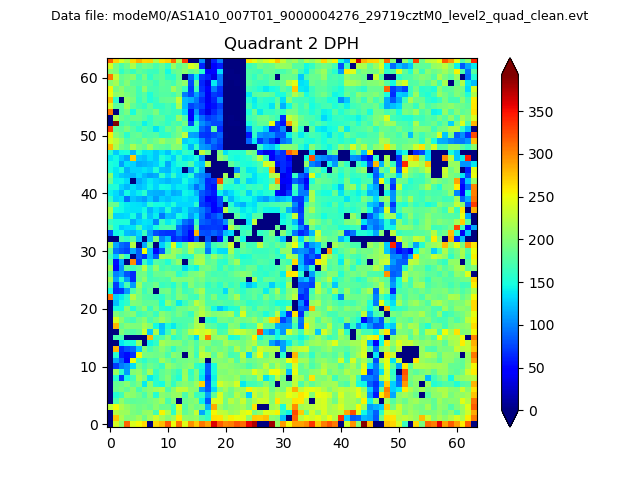
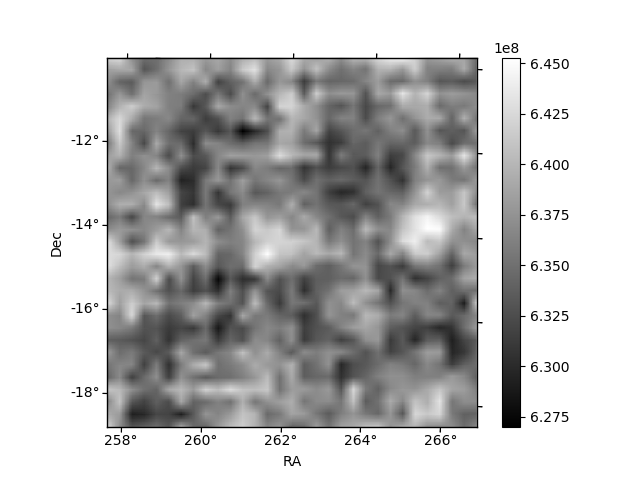
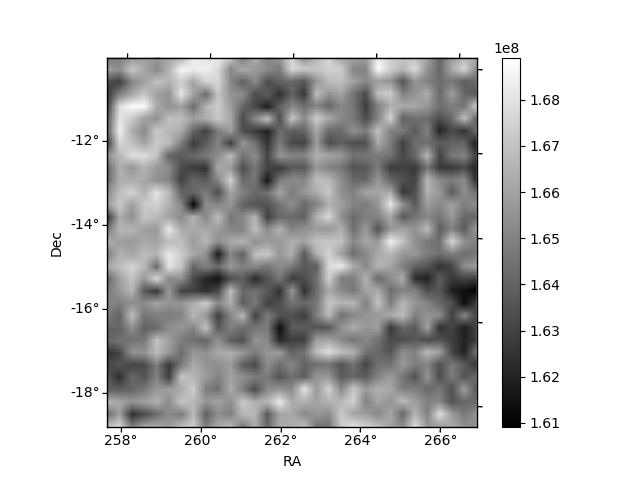
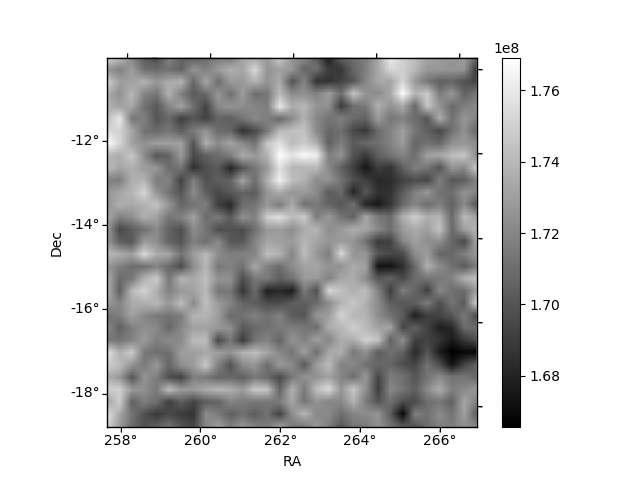
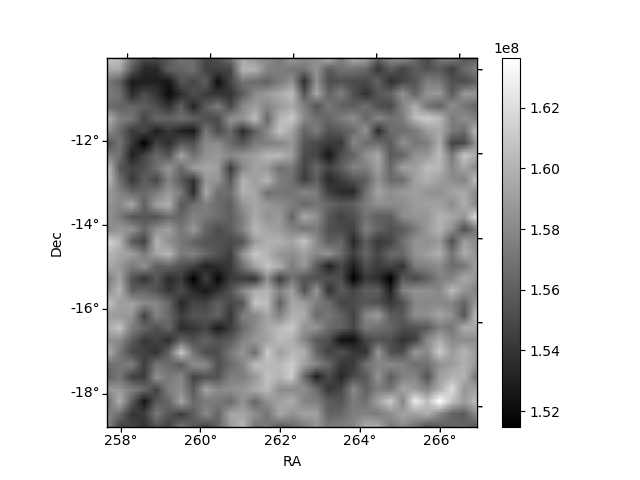
Histogram calculated using DETX and DETY for each event in the final _common_clean file
| Quadrant A | 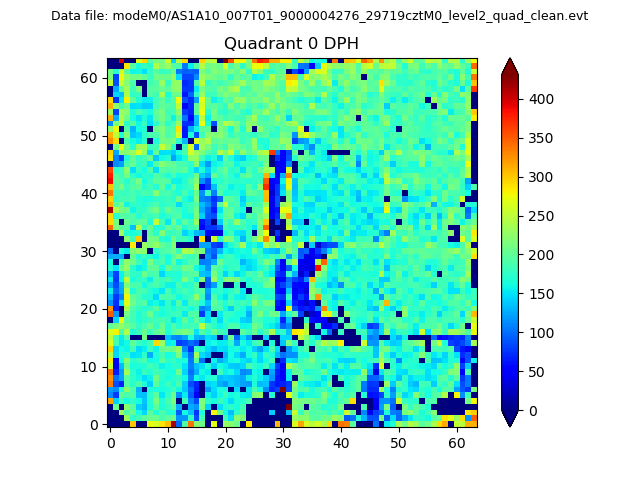 |
 |
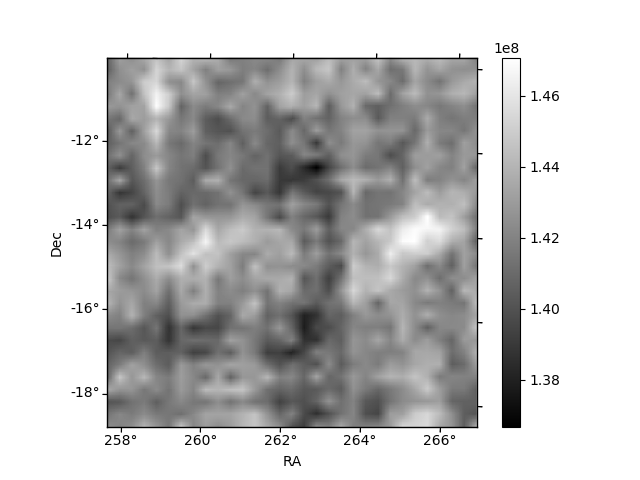
Quadrant B |
|---|---|---|---|
| Quadrant D | 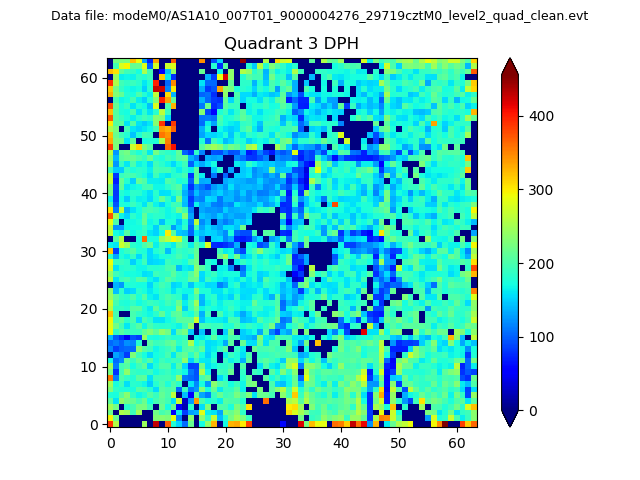 |
 |
Quadrant C |
| Plot type | Count rate plots | Images |
|---|---|---|
| Comparison with Poisson distribution Blue bars denote a histogram of data divided into 1 sec bins. Red curve is a Poisson curve with rate = median count rate of data. |
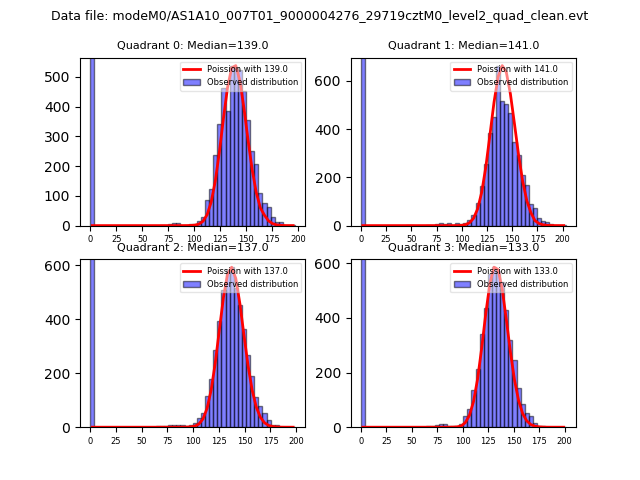 |
 |
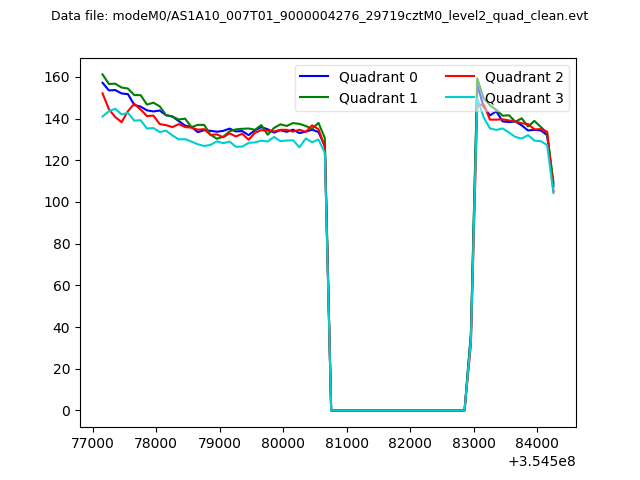
| Quadrant-wise count rates Data is divided into 100 sec bins |
 |
|
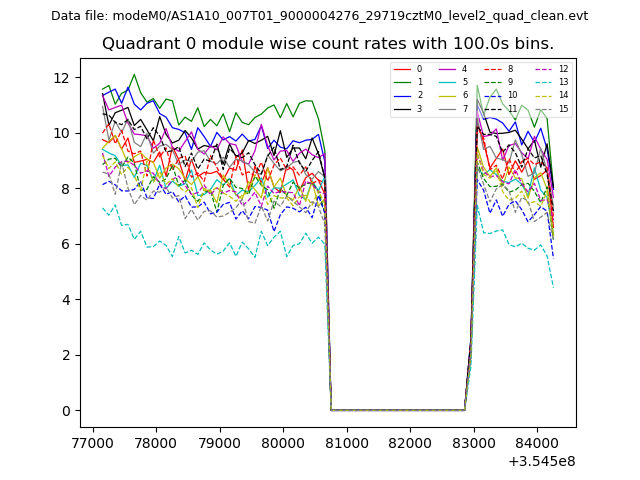
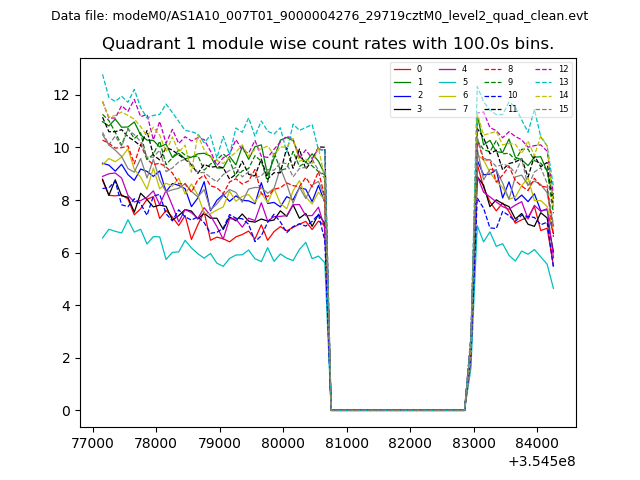
| Module-wise count rates for Quadrant A Data is divided into 100 sec bins |
 |
 |
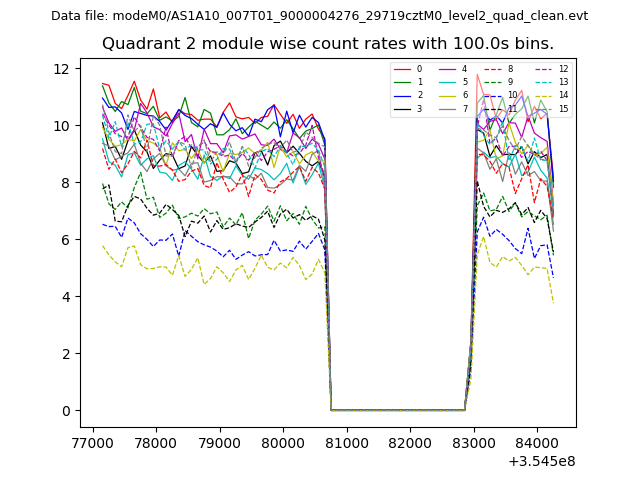
| Module-wise count rates for Quadrant B Data is divided into 100 sec bins |
 |
 |
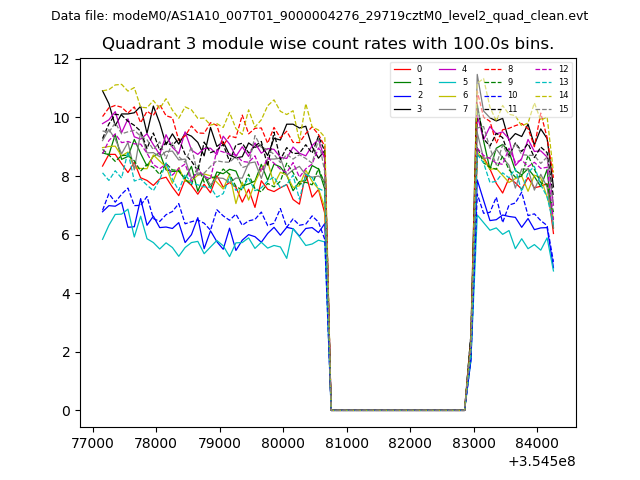
| Module-wise count rates for Quadrant C Data is divided into 100 sec bins |
 |
 |
| Module-wise count rates for Quadrant D Data is divided into 100 sec bins |
 |
 |
| Parameter | Plot |
|---|---|
| CZT HV Monitor | 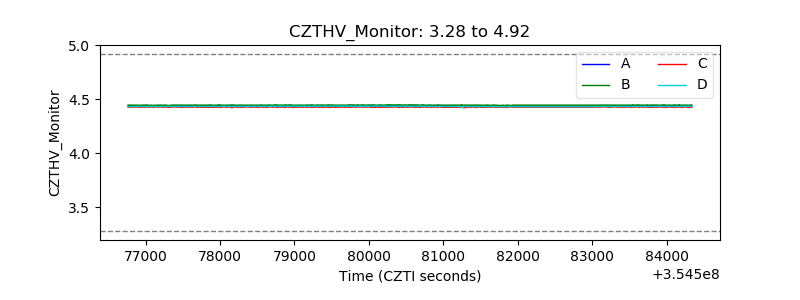 |
| D_VDD | 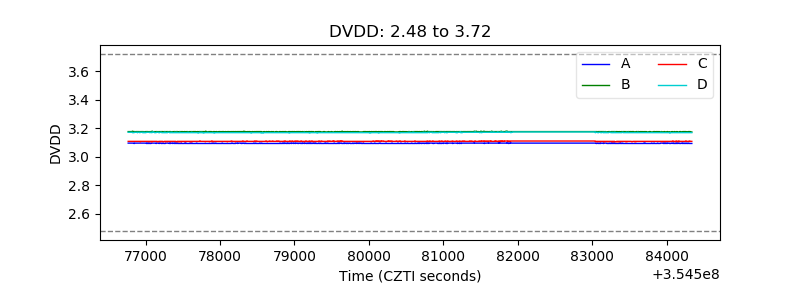 |
| Temperature 1 | 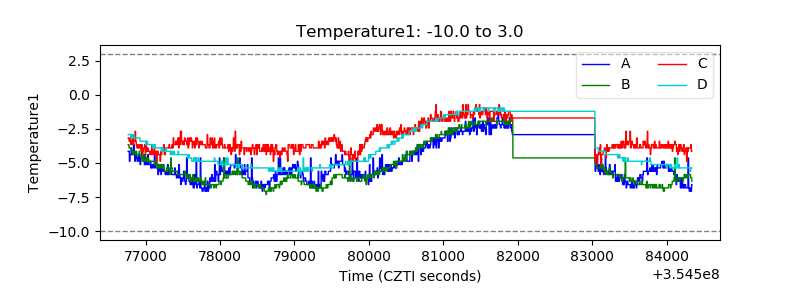 |
| Veto HV Monitor | 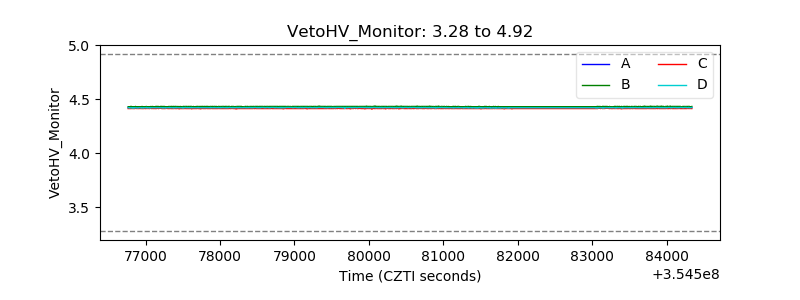 |
| Veto LLD | 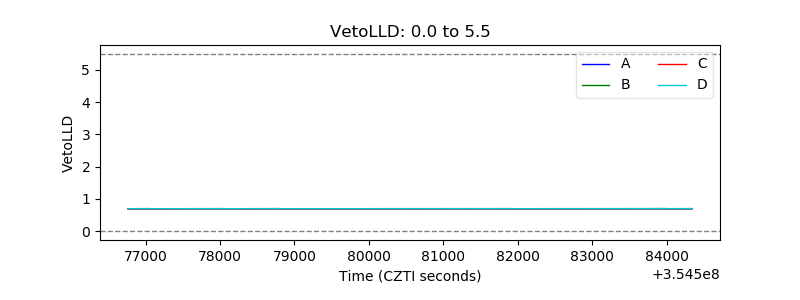 |
| Alpha Counter | 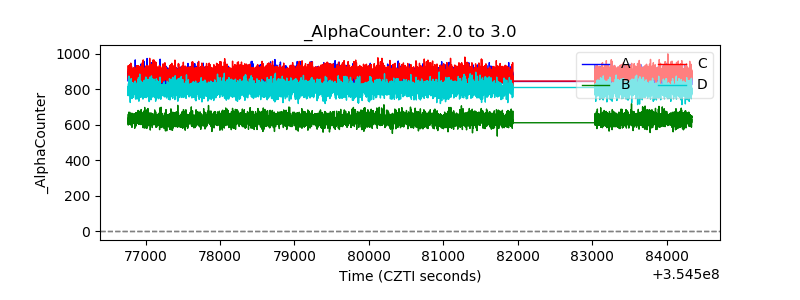 |
| _CPM_Rate | 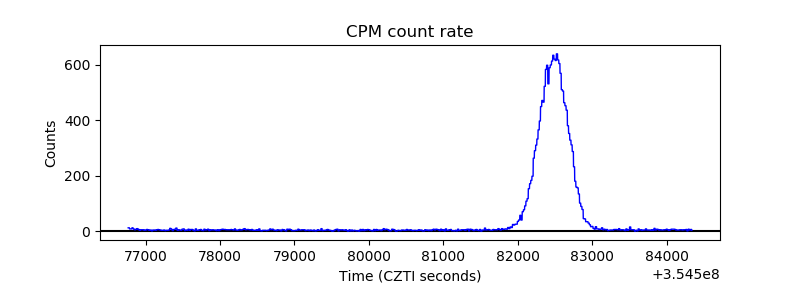 |
| CZT Counter | 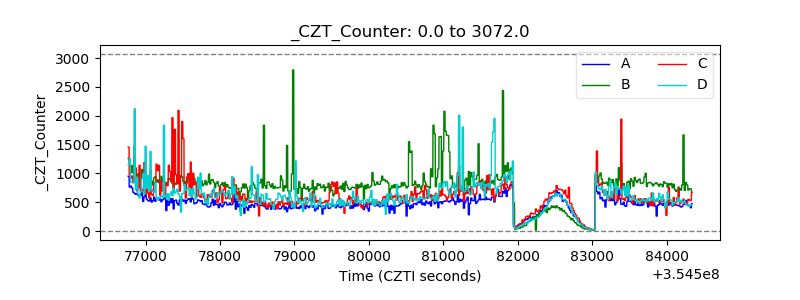 |
| +2.5 Volts monitor |  |
| +5 Volts monitor |  |
| _ROLL_ROT | 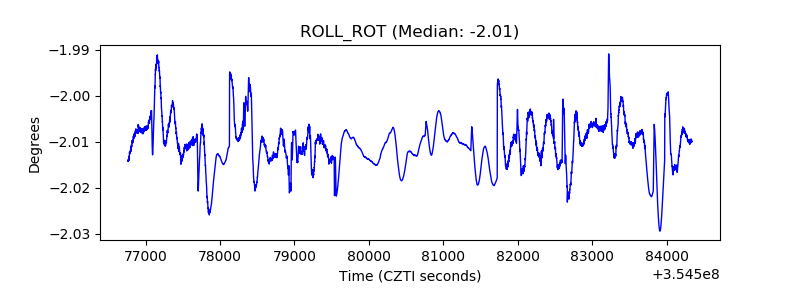 |
| _Roll_DEC | 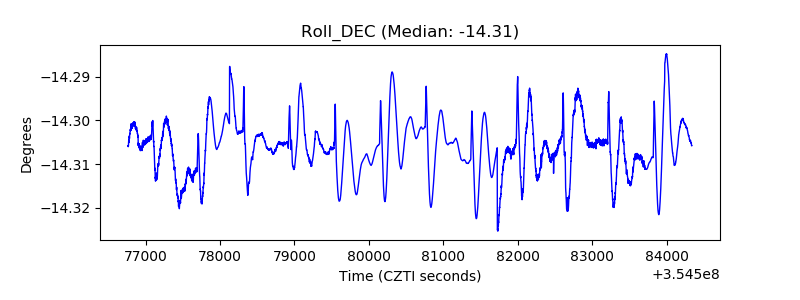 |
| _Roll_RA | 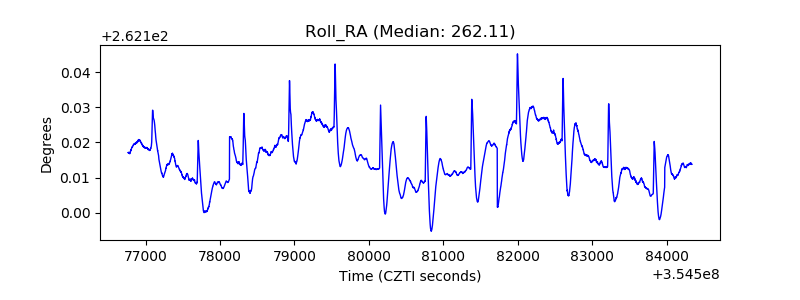 |
| Veto Counter | 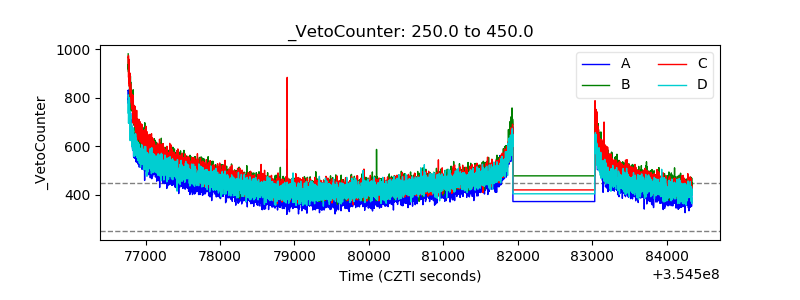 |