| Param | Original file | Final file |
|---|---|---|
| Filename | modeM0/AS1A10_007T01_9000004276_29720cztM0_level2.evt | modeM0/AS1A10_007T01_9000004276_29720cztM0_level2_quad_clean.evt |
| Size (bytes) | 605,687,040 | 100,768,320 |
| Size | 577.6 MB | 96.1 MB |
| Events in quadrant A | 3,290,680 | 649,717 |
| Events in quadrant B | 5,500,157 | 659,182 |
| Events in quadrant C | 3,759,653 | 647,177 |
| Events in quadrant D | 5,330,786 | 619,727 |
| Mode SS | |||
|---|---|---|---|
| Quadrant | BADHDUFLAG | Total packets | Discarded packets |
| A | 0 | 138 | 0 |
| B | 0 | 138 | 0 |
| C | 0 | 138 | 0 |
| D | 0 | 138 | 0 |
| Mode M0 | |||
|---|---|---|---|
| Quadrant | BADHDUFLAG | Total packets | Discarded packets |
| A | 0 | 14151 | 2 |
| B | 0 | 21136 | 2 |
| C | 0 | 15250 | 2 |
| D | 0 | 20352 | 2 |
| Mode M9 | |||
|---|---|---|---|
| Quadrant | BADHDUFLAG | Total packets | Discarded packets |
| A | 0 | 15 | 0 |
| B | 0 | 16 | 0 |
| C | 0 | 16 | 0 |
| D | 0 | 16 | 0 |
| Quadrant | Total seconds | Saturated seconds | Saturation percentage |
|---|---|---|---|
| A | 6832 | 41 | 0.600117% |
| B | 6832 | 157 | 2.298009% |
| C | 6832 | 152 | 2.224824% |
| D | 6832 | 369 | 5.401054% |
Noise dominated data is calculated using 1-second bins in cleaned event files. If a bin has >2000 counts, and if more than 50% of those come from <1% of pixels, then it is considered to be noise-dominated and hence unusable.
| Quadrant | # 1 sec bins | Bins with >0 counts | Bins with >2000 counts | High rate bins dominated by noise | Noise dominated (total time) | Noise dominated (detector-on time) | Marked lightcurve |
|---|---|---|---|---|---|---|---|
| A | 7527 | 6833 | 0 | 0 | 0.00% | 0.00% | 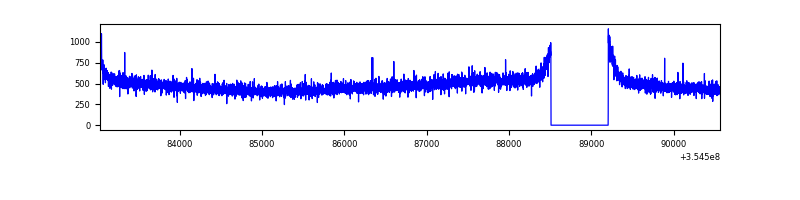 |
| B | 7527 | 6833 | 6 | 6 | 0.08% | 0.09% |  |
| C | 7527 | 6833 | 5 | 5 | 0.07% | 0.07% | 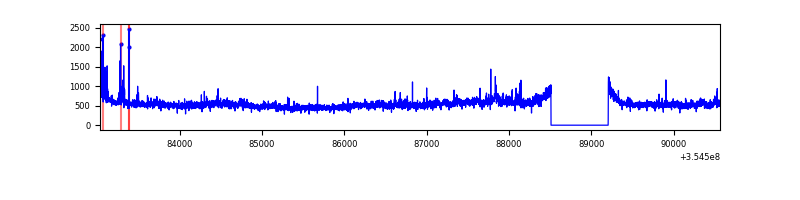 |
| D | 7527 | 6833 | 263 | 263 | 3.49% | 3.85% | 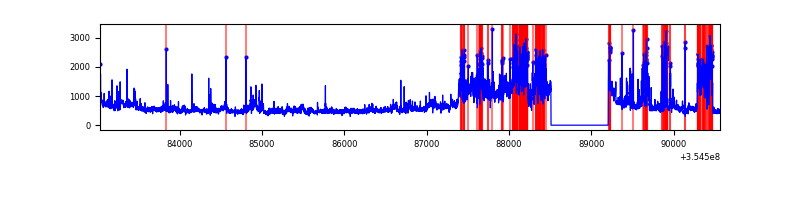 |
Top three noisy pixels from each quadrant. If the there are fewer than three noisy pixels in the level2.evt file, extra rows are filled as -1
| Pixel properties | Quadrant properties | ||||||
|---|---|---|---|---|---|---|---|
| Quadrant | DetID | PixID | Counts | Sigma | Mean | Median | Sigma |
| A | 13 | 254 | 12963 | 70.45 | 852 | 833 | 172.2 |
| A | 3 | 137 | 8649 | 45.4 | 852 | 833 | 172.2 |
| A | 0 | 226 | 6991 | 35.77 | 852 | 833 | 172.2 |
| B | 6 | 159 | 1999691 | 12178.98 | 849 | 824 | 164.1 |
| B | 0 | 229 | 101452 | 613.12 | 849 | 824 | 164.1 |
| B | 10 | 245 | 25929 | 152.96 | 849 | 824 | 164.1 |
| C | 3 | 233 | 321286 | 1642.56 | 830 | 838 | 195.1 |
| C | 14 | 238 | 140230 | 714.5 | 830 | 838 | 195.1 |
| C | 10 | 22 | 27097 | 134.6 | 830 | 838 | 195.1 |
| D | 8 | 195 | 1578357 | 8073.54 | 818 | 796 | 195.4 |
| D | 7 | 80 | 288881 | 1474.34 | 818 | 796 | 195.4 |
| D | 13 | 189 | 79187 | 401.18 | 818 | 796 | 195.4 |
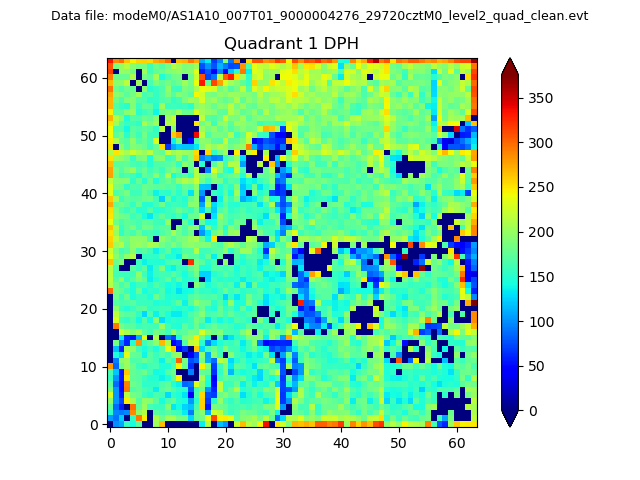
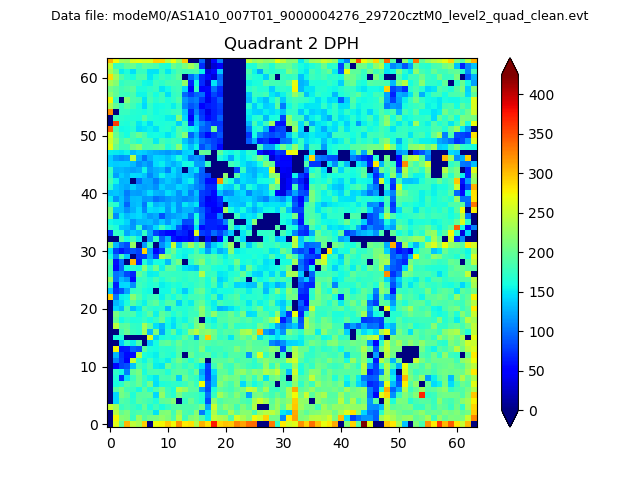
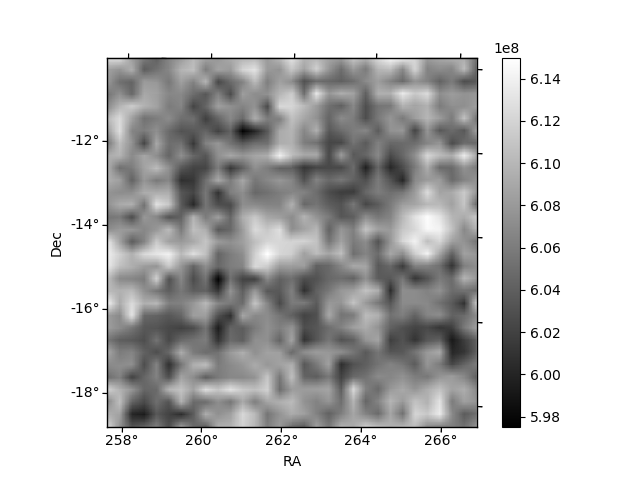
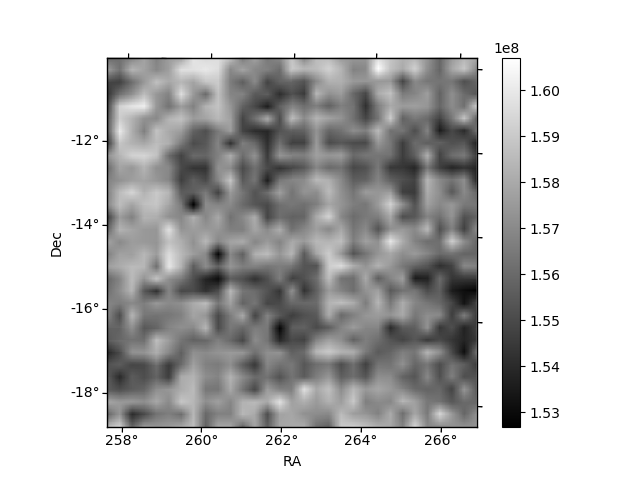
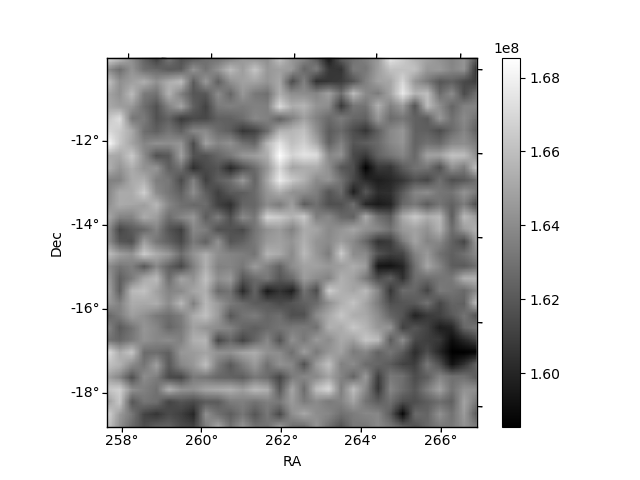
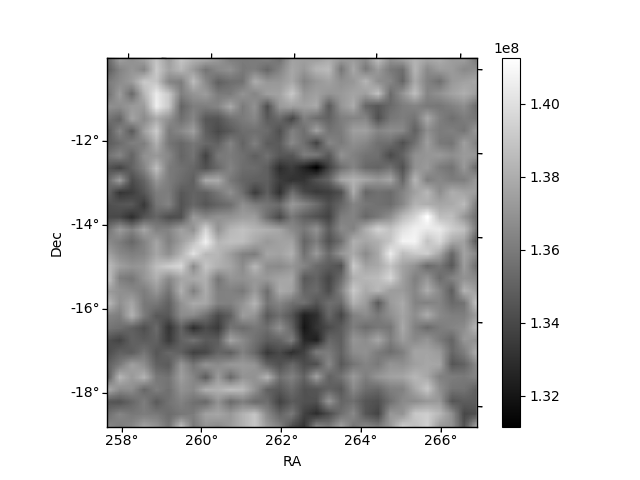
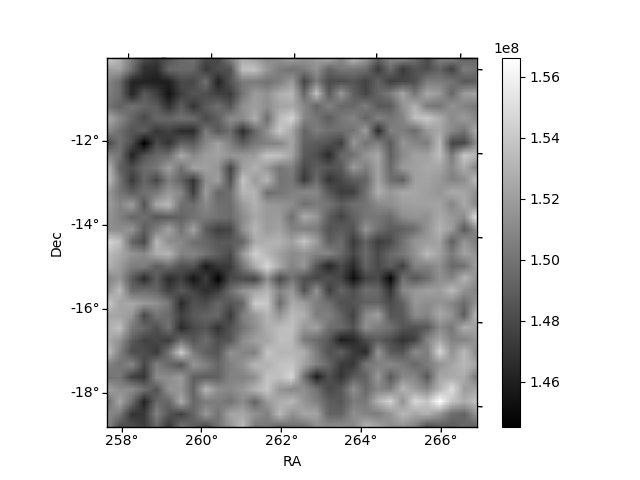
Histogram calculated using DETX and DETY for each event in the final _common_clean file
| Quadrant A | 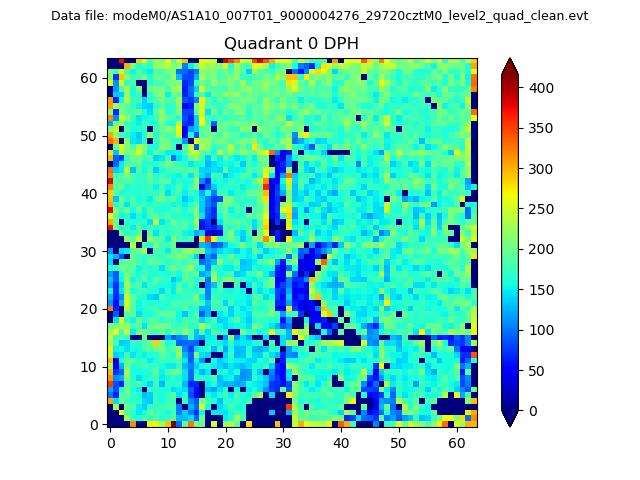 |
 |
Quadrant B |
|---|---|---|---|
| Quadrant D | 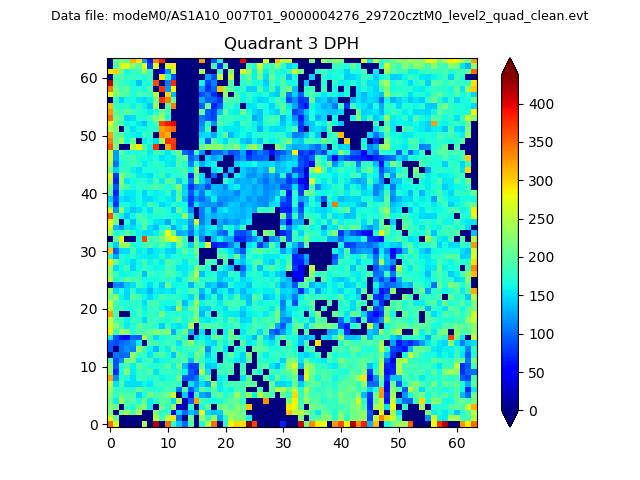 |
 |
Quadrant C |
| Plot type | Count rate plots | Images |
|---|---|---|
| Comparison with Poisson distribution Blue bars denote a histogram of data divided into 1 sec bins. Red curve is a Poisson curve with rate = median count rate of data. |
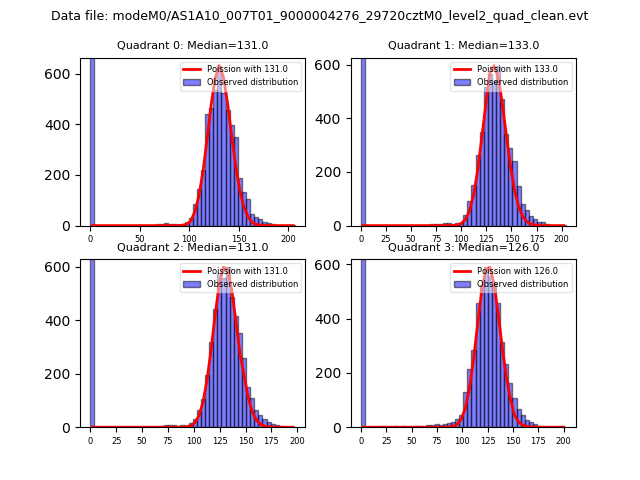 |
 |
| Quadrant-wise count rates Data is divided into 100 sec bins |
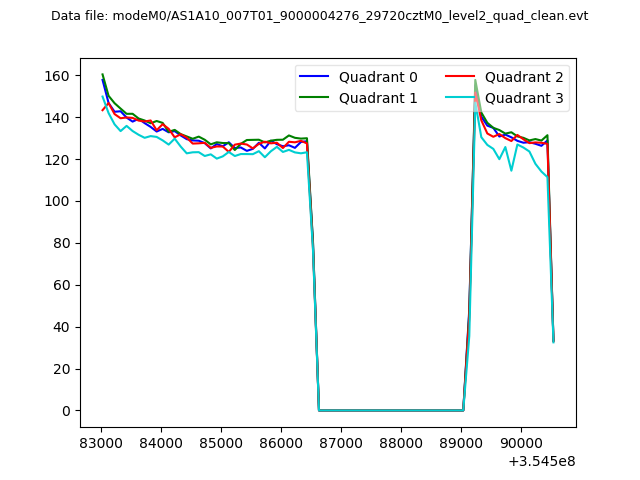 |
|
| Module-wise count rates for Quadrant A Data is divided into 100 sec bins |
 |
 |
| Module-wise count rates for Quadrant B Data is divided into 100 sec bins |
 |
 |
| Module-wise count rates for Quadrant C Data is divided into 100 sec bins |
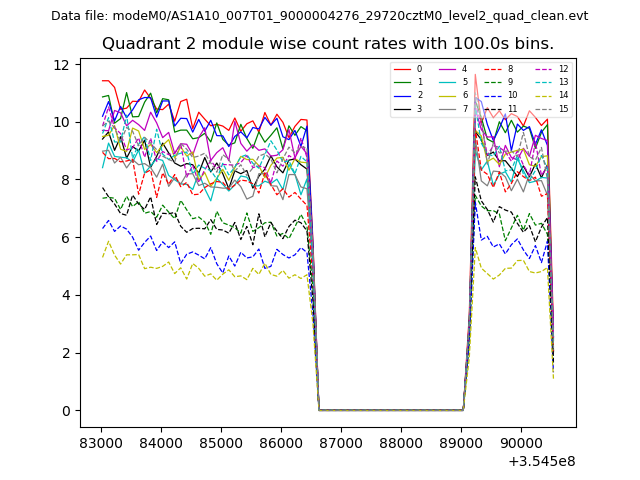 |
 |
| Module-wise count rates for Quadrant D Data is divided into 100 sec bins |
 |
 |
| Parameter | Plot |
|---|---|
| CZT HV Monitor |  |
| D_VDD | 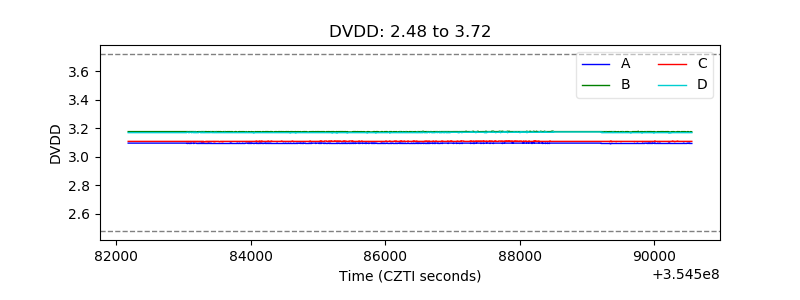 |
| Temperature 1 | 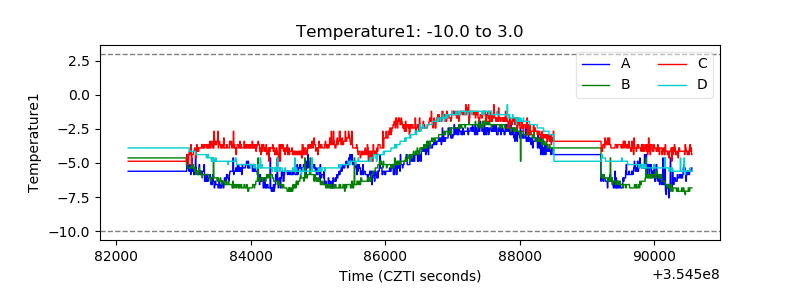 |
| Veto HV Monitor | 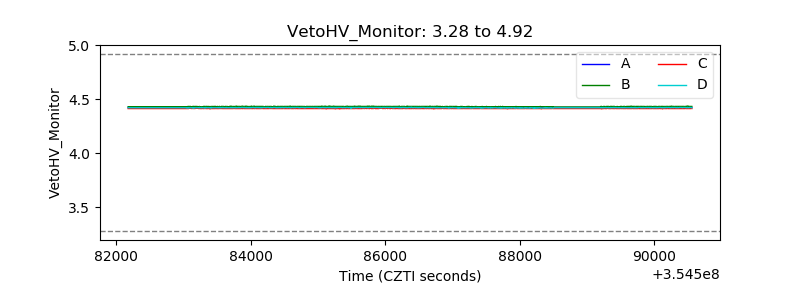 |
| Veto LLD | 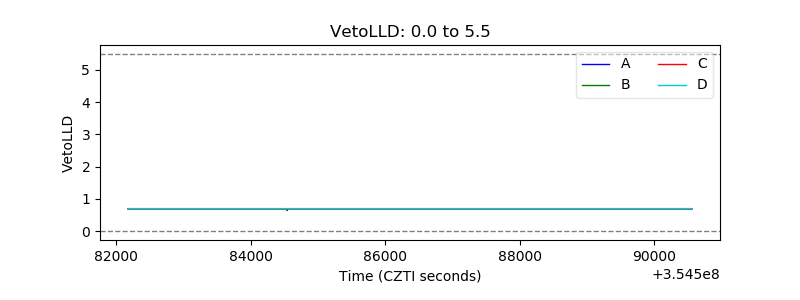 |
| Alpha Counter | 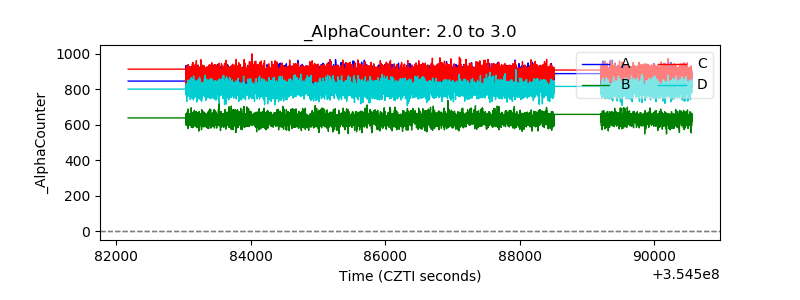 |
| _CPM_Rate | 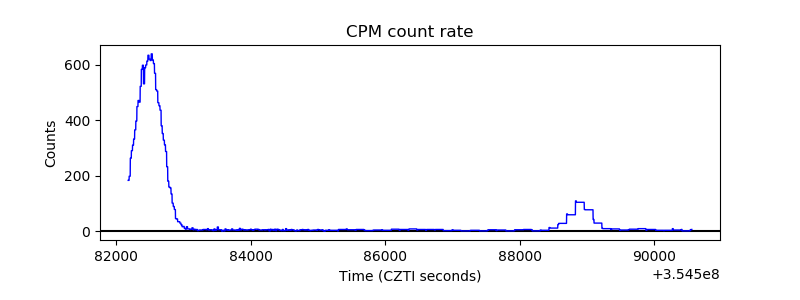 |
| CZT Counter | 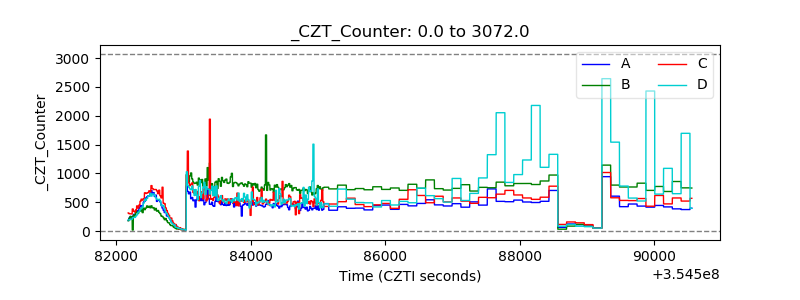 |
| +2.5 Volts monitor | 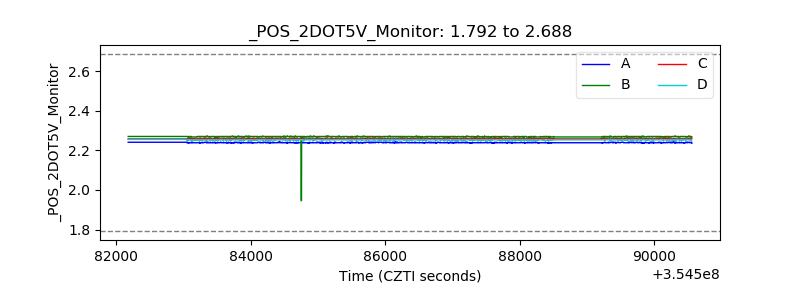 |
| +5 Volts monitor |  |
| _ROLL_ROT | 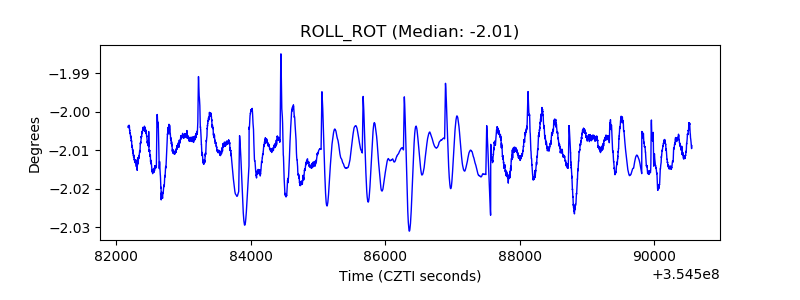 |
| _Roll_DEC | 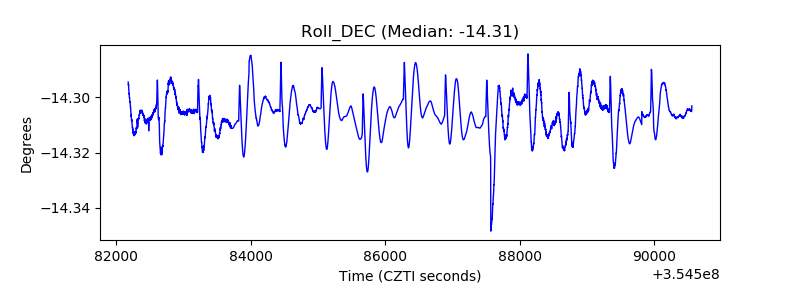 |
| _Roll_RA | 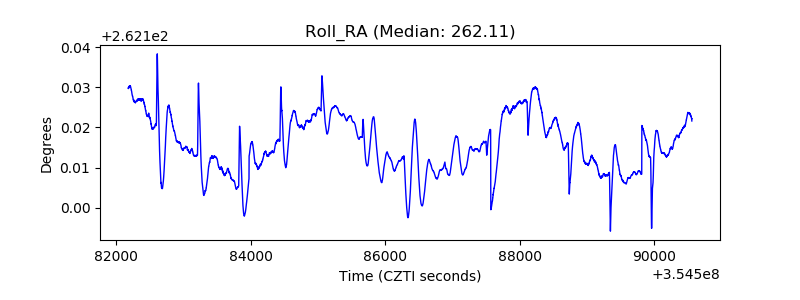 |
| Veto Counter |  |