| Param | Original file | Final file |
|---|---|---|
| Filename | modeM0/AS1A10_007T01_9000004276_29726cztM0_level2.evt | modeM0/AS1A10_007T01_9000004276_29726cztM0_level2_quad_clean.evt |
| Size (bytes) | 2,031,422,400 | 244,563,840 |
| Size | 1.9 GB | 233.2 MB |
| Events in quadrant A | 9,458,805 | 1,555,755 |
| Events in quadrant B | 16,565,432 | 1,554,850 |
| Events in quadrant C | 11,358,590 | 1,534,768 |
| Events in quadrant D | 22,802,606 | 1,391,174 |
| Mode SS | |||
|---|---|---|---|
| Quadrant | BADHDUFLAG | Total packets | Discarded packets |
| A | 0 | 404 | 0 |
| B | 0 | 404 | 0 |
| C | 0 | 404 | 0 |
| D | 0 | 404 | 0 |
| Mode M0 | |||
|---|---|---|---|
| Quadrant | BADHDUFLAG | Total packets | Discarded packets |
| A | 0 | 40730 | 4 |
| B | 0 | 63405 | 4 |
| C | 0 | 45679 | 4 |
| D | 0 | 81878 | 4 |
| Mode M9 | |||
|---|---|---|---|
| Quadrant | BADHDUFLAG | Total packets | Discarded packets |
| A | 0 | 25 | 0 |
| B | 0 | 25 | 0 |
| C | 0 | 25 | 0 |
| D | 0 | 25 | 0 |
| Quadrant | Total seconds | Saturated seconds | Saturation percentage |
|---|---|---|---|
| A | 19892 | 301 | 1.513171% |
| B | 19892 | 963 | 4.841142% |
| C | 19892 | 647 | 3.252564% |
| D | 19892 | 3559 | 17.891615% |
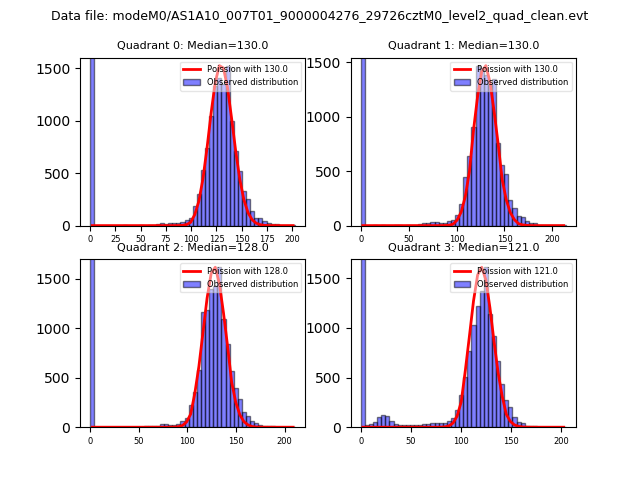
Noise dominated data is calculated using 1-second bins in cleaned event files. If a bin has >2000 counts, and if more than 50% of those come from <1% of pixels, then it is considered to be noise-dominated and hence unusable.
| Quadrant | # 1 sec bins | Bins with >0 counts | Bins with >2000 counts | High rate bins dominated by noise | Noise dominated (total time) | Noise dominated (detector-on time) | Marked lightcurve |
|---|---|---|---|---|---|---|---|
| A | 22317 | 19892 | 0 | 0 | 0.00% | 0.00% | 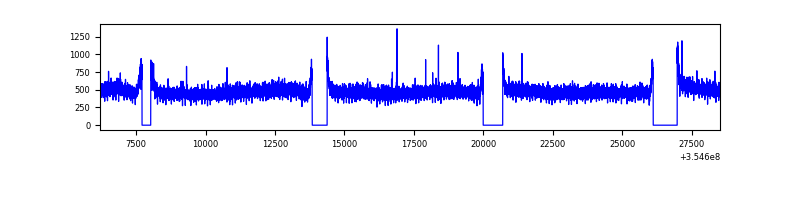 |
| B | 22317 | 19892 | 365 | 365 | 1.64% | 1.83% | 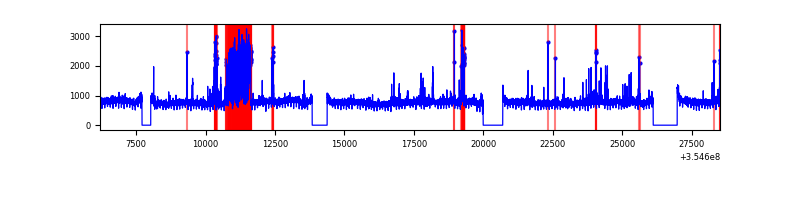 |
| C | 22317 | 19892 | 126 | 126 | 0.56% | 0.63% | 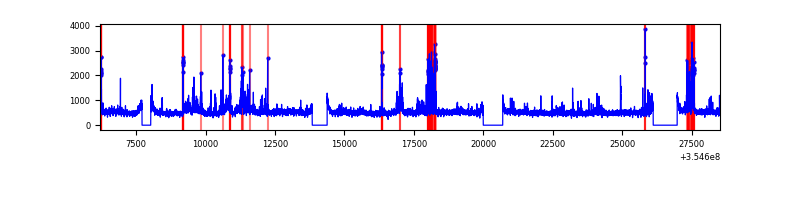 |
| D | 22317 | 19892 | 3206 | 3206 | 14.37% | 16.12% | 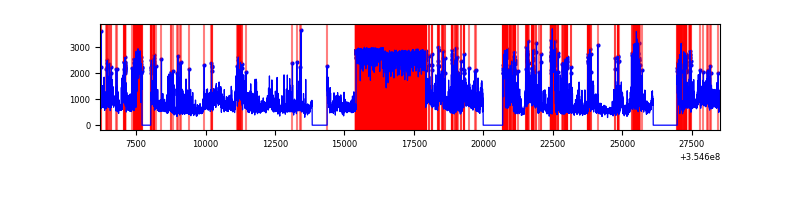 |
Top three noisy pixels from each quadrant. If the there are fewer than three noisy pixels in the level2.evt file, extra rows are filled as -1
| Pixel properties | Quadrant properties | ||||||
|---|---|---|---|---|---|---|---|
| Quadrant | DetID | PixID | Counts | Sigma | Mean | Median | Sigma |
| A | 13 | 254 | 37094 | 70.39 | 2449 | 2395 | 492.9 |
| A | 3 | 137 | 25437 | 46.74 | 2449 | 2395 | 492.9 |
| A | 0 | 226 | 20495 | 36.72 | 2449 | 2395 | 492.9 |
| B | 6 | 159 | 5604324 | 12129.71 | 2397 | 2332 | 461.8 |
| B | 10 | 245 | 1048202 | 2264.57 | 2397 | 2332 | 461.8 |
| B | 0 | 229 | 371030 | 798.32 | 2397 | 2332 | 461.8 |
| C | 3 | 233 | 1095328 | 1984.52 | 2357 | 2374 | 550.7 |
| C | 10 | 22 | 525439 | 949.75 | 2357 | 2374 | 550.7 |
| C | 14 | 238 | 393376 | 709.96 | 2357 | 2374 | 550.7 |
| D | 7 | 223 | 6363205 | 12327.98 | 2155 | 2100 | 516.0 |
| D | 8 | 195 | 4689368 | 9084.04 | 2155 | 2100 | 516.0 |
| D | 7 | 80 | 2939370 | 5692.5 | 2155 | 2100 | 516.0 |
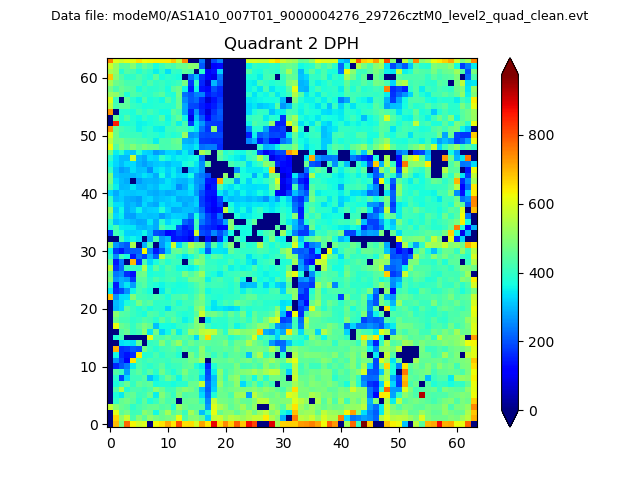
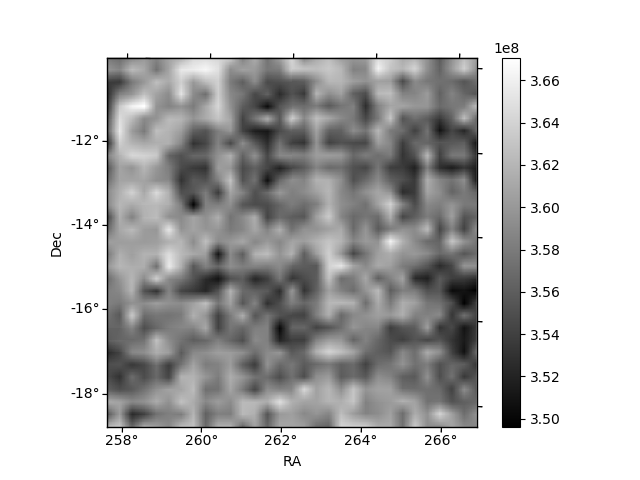
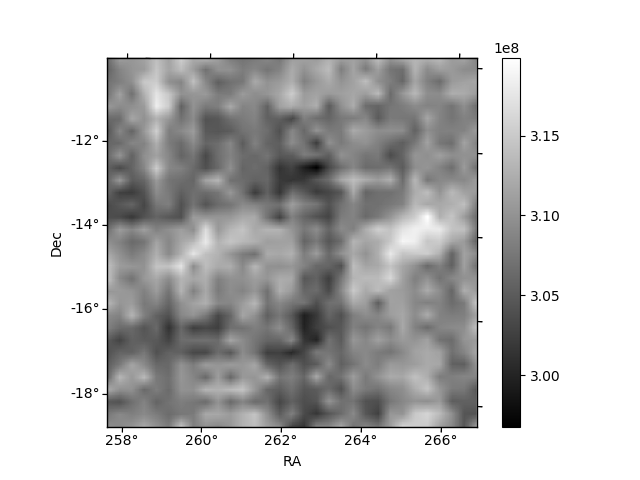
Histogram calculated using DETX and DETY for each event in the final _common_clean file
| Quadrant A | 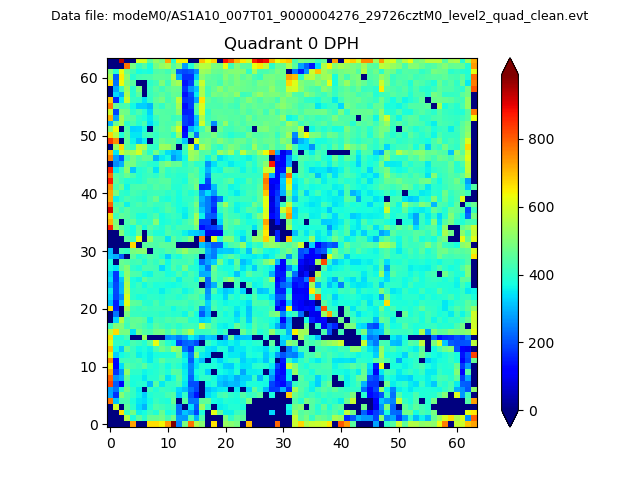 |
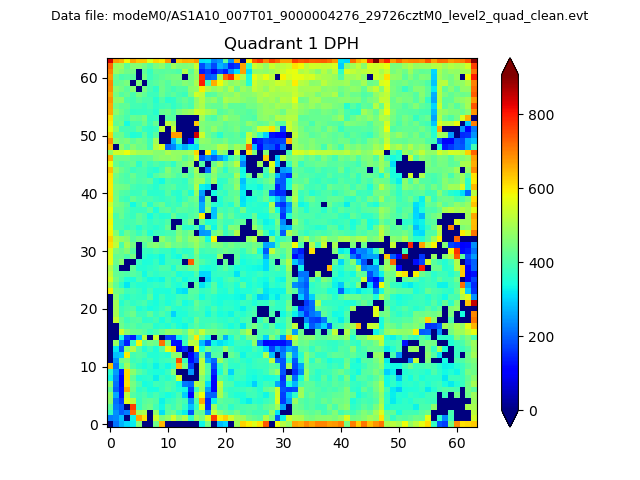 |
Quadrant B |
|---|---|---|---|
| Quadrant D | 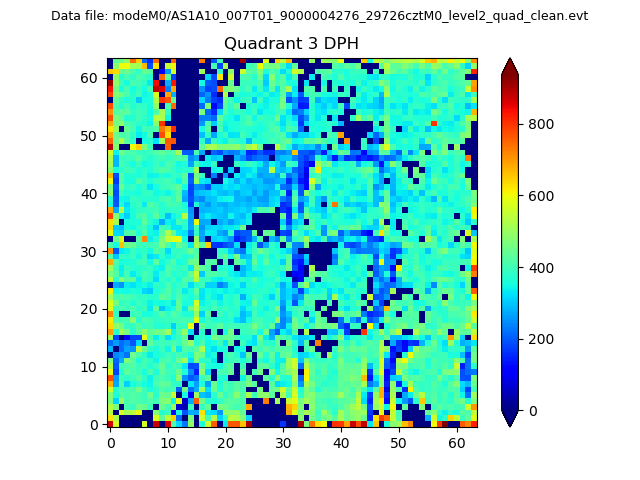 |
 |
Quadrant C |
| Plot type | Count rate plots | Images |
|---|---|---|
| Comparison with Poisson distribution Blue bars denote a histogram of data divided into 1 sec bins. Red curve is a Poisson curve with rate = median count rate of data. |
 |
 |
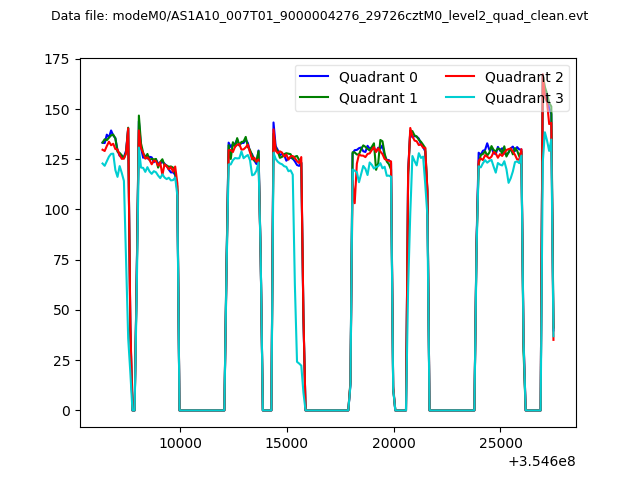
| Quadrant-wise count rates Data is divided into 100 sec bins |
 |
|
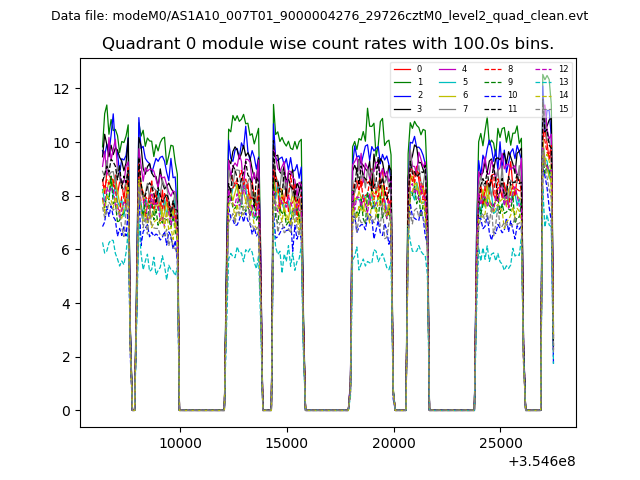
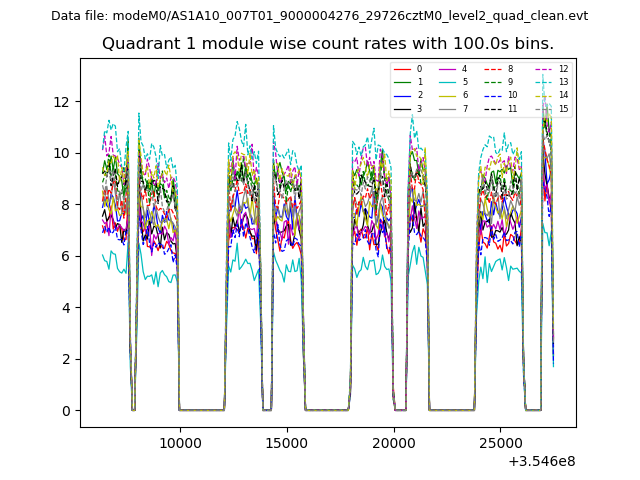
| Module-wise count rates for Quadrant A Data is divided into 100 sec bins |
 |
 |
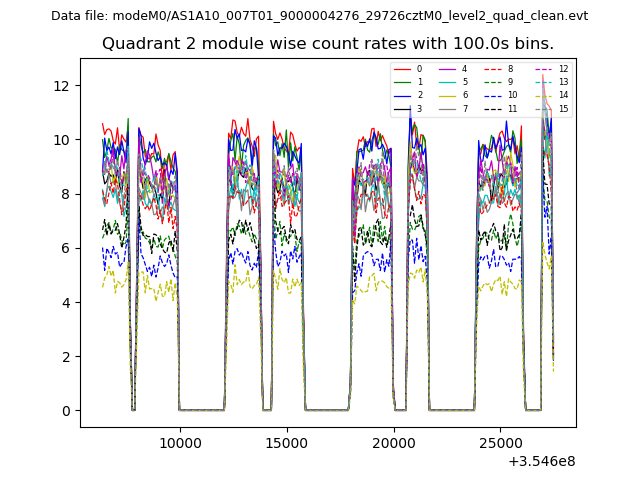
| Module-wise count rates for Quadrant B Data is divided into 100 sec bins |
 |
 |
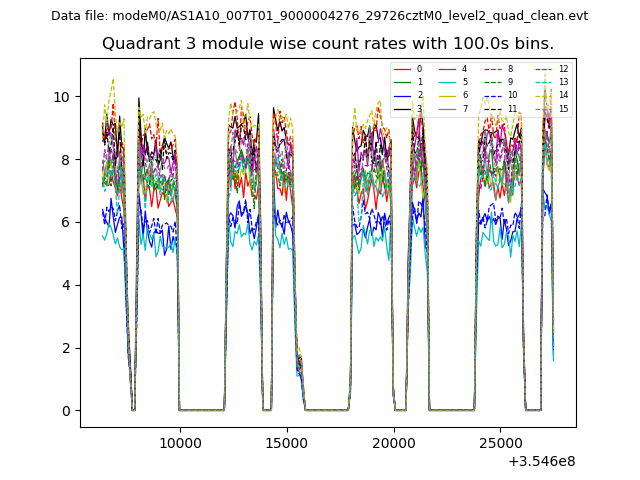
| Module-wise count rates for Quadrant C Data is divided into 100 sec bins |
 |
 |
| Module-wise count rates for Quadrant D Data is divided into 100 sec bins |
 |
 |
| Parameter | Plot |
|---|---|
| CZT HV Monitor | 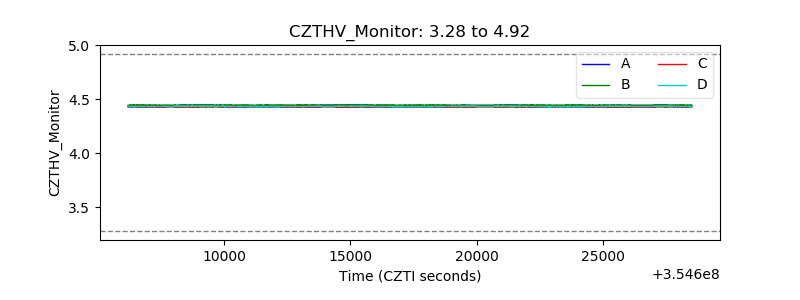 |
| D_VDD |  |
| Temperature 1 |  |
| Veto HV Monitor | 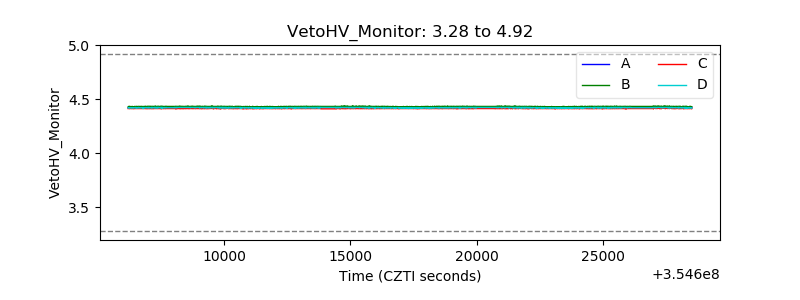 |
| Veto LLD |  |
| Alpha Counter | 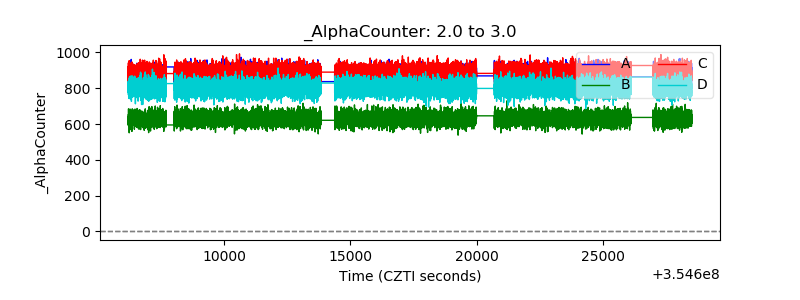 |
| _CPM_Rate | 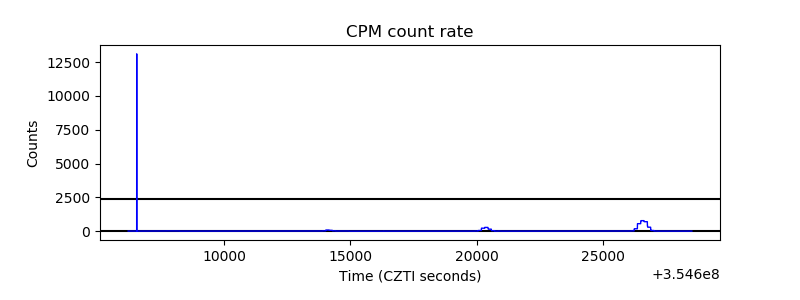 |
| CZT Counter | 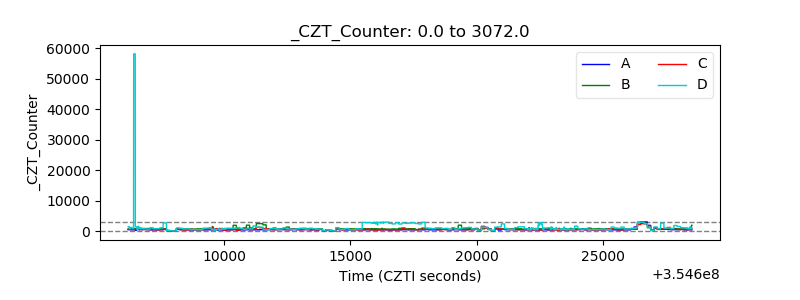 |
| +2.5 Volts monitor |  |
| +5 Volts monitor |  |
| _ROLL_ROT | 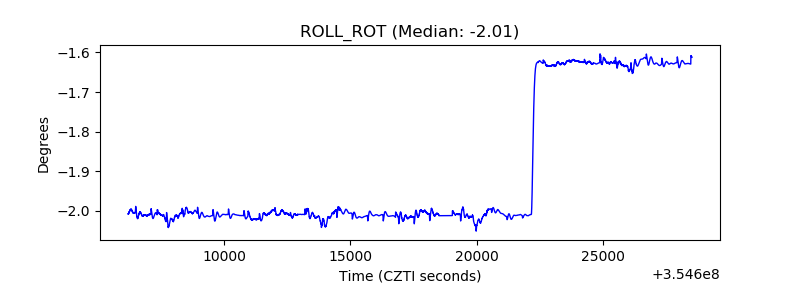 |
| _Roll_DEC | 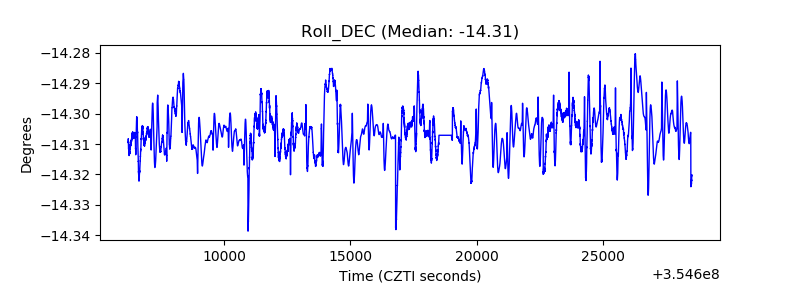 |
| _Roll_RA | 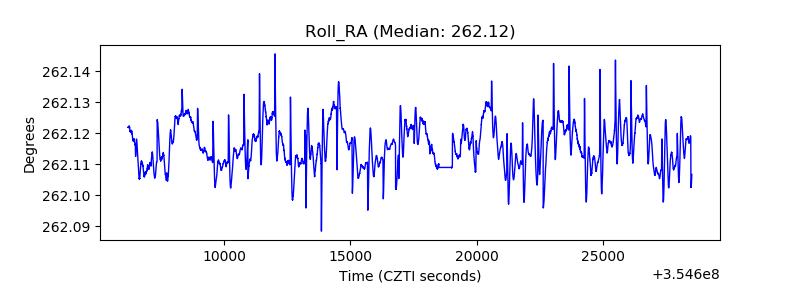 |
| Veto Counter | 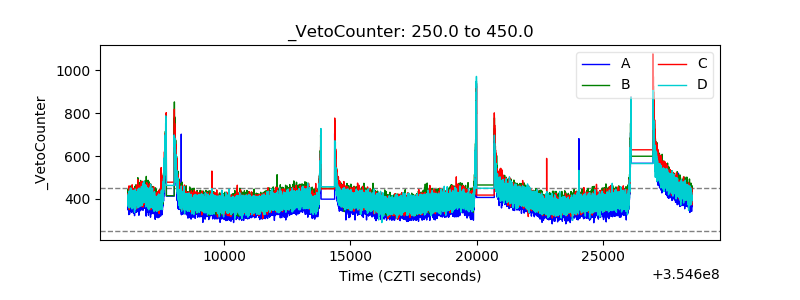 |