| Param | Original file | Final file |
|---|---|---|
| Filename | modeM0/AS1A10_007T01_9000004276_29727cztM0_level2.evt | modeM0/AS1A10_007T01_9000004276_29727cztM0_level2_quad_clean.evt |
| Size (bytes) | 3,615,085,440 | 430,801,920 |
| Size | 3.4 GB | 410.8 MB |
| Events in quadrant A | 17,243,363 | 2,711,131 |
| Events in quadrant B | 29,449,696 | 2,719,936 |
| Events in quadrant C | 21,904,606 | 2,664,673 |
| Events in quadrant D | 38,466,449 | 2,475,388 |
| Mode SS | |||
|---|---|---|---|
| Quadrant | BADHDUFLAG | Total packets | Discarded packets |
| A | 0 | 730 | 0 |
| B | 0 | 730 | 0 |
| C | 0 | 730 | 0 |
| D | 0 | 730 | 0 |
| Mode M0 | |||
|---|---|---|---|
| Quadrant | BADHDUFLAG | Total packets | Discarded packets |
| A | 0 | 74515 | 7 |
| B | 0 | 113442 | 7 |
| C | 0 | 87464 | 8 |
| D | 0 | 139659 | 7 |
| Mode M9 | |||
|---|---|---|---|
| Quadrant | BADHDUFLAG | Total packets | Discarded packets |
| A | 0 | 34 | 0 |
| B | 0 | 34 | 0 |
| C | 0 | 34 | 0 |
| D | 0 | 34 | 0 |
| Quadrant | Total seconds | Saturated seconds | Saturation percentage |
|---|---|---|---|
| A | 36054 | 501 | 1.389582% |
| B | 36055 | 1468 | 4.071557% |
| C | 36054 | 1483 | 4.113275% |
| D | 36054 | 4936 | 13.690575% |
Noise dominated data is calculated using 1-second bins in cleaned event files. If a bin has >2000 counts, and if more than 50% of those come from <1% of pixels, then it is considered to be noise-dominated and hence unusable.
| Quadrant | # 1 sec bins | Bins with >0 counts | Bins with >2000 counts | High rate bins dominated by noise | Noise dominated (total time) | Noise dominated (detector-on time) | Marked lightcurve |
|---|---|---|---|---|---|---|---|
| A | 44808 | 36056 | 0 | 0 | 0.00% | 0.00% | 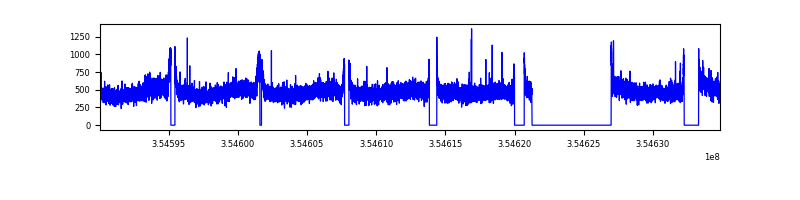 |
| B | 44809 | 36057 | 401 | 401 | 0.89% | 1.11% | 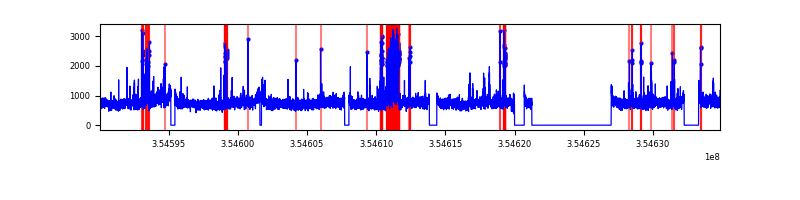 |
| C | 44809 | 36057 | 438 | 438 | 0.98% | 1.21% |  |
| D | 44809 | 36056 | 4271 | 4271 | 9.53% | 11.85% | 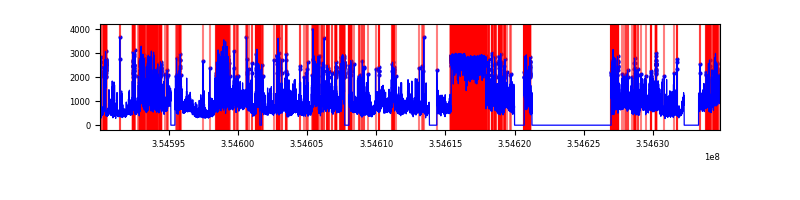 |
Top three noisy pixels from each quadrant. If the there are fewer than three noisy pixels in the level2.evt file, extra rows are filled as -1
| Pixel properties | Quadrant properties | ||||||
|---|---|---|---|---|---|---|---|
| Quadrant | DetID | PixID | Counts | Sigma | Mean | Median | Sigma |
| A | 13 | 254 | 66527 | 69.68 | 4463 | 4366 | 892.1 |
| A | 3 | 137 | 45682 | 46.32 | 4463 | 4366 | 892.1 |
| A | 0 | 226 | 37609 | 37.27 | 4463 | 4366 | 892.1 |
| B | 6 | 159 | 10233724 | 12233.49 | 4376 | 4267 | 836.2 |
| B | 10 | 245 | 1059527 | 1261.99 | 4376 | 4267 | 836.2 |
| B | 0 | 229 | 663128 | 787.94 | 4376 | 4267 | 836.2 |
| C | 3 | 233 | 2681464 | 2679.7 | 4284 | 4316 | 999.0 |
| C | 10 | 22 | 1550713 | 1547.87 | 4284 | 4316 | 999.0 |
| C | 14 | 238 | 699247 | 695.59 | 4284 | 4316 | 999.0 |
| D | 8 | 195 | 10060889 | 10377.3 | 4064 | 3959 | 969.1 |
| D | 7 | 223 | 6364542 | 6563.2 | 4064 | 3959 | 969.1 |
| D | 7 | 80 | 4631783 | 4775.24 | 4064 | 3959 | 969.1 |
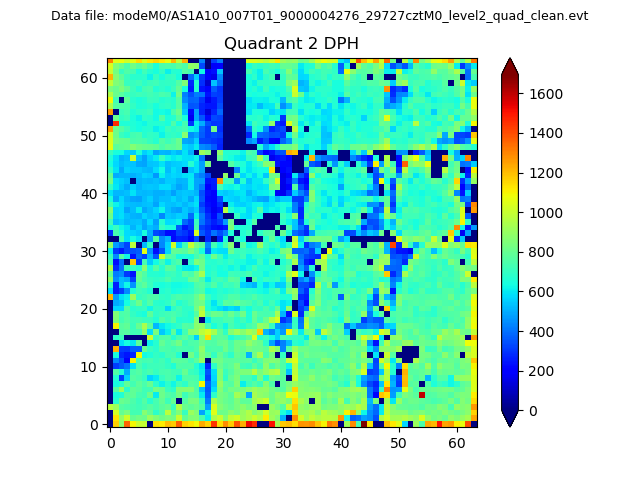
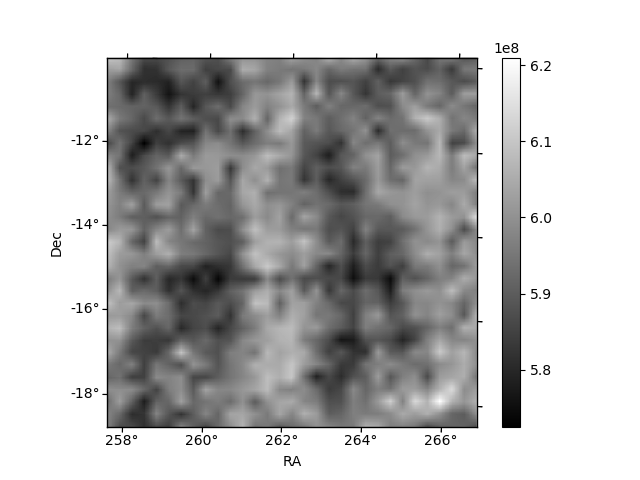
Histogram calculated using DETX and DETY for each event in the final _common_clean file
| Quadrant A | 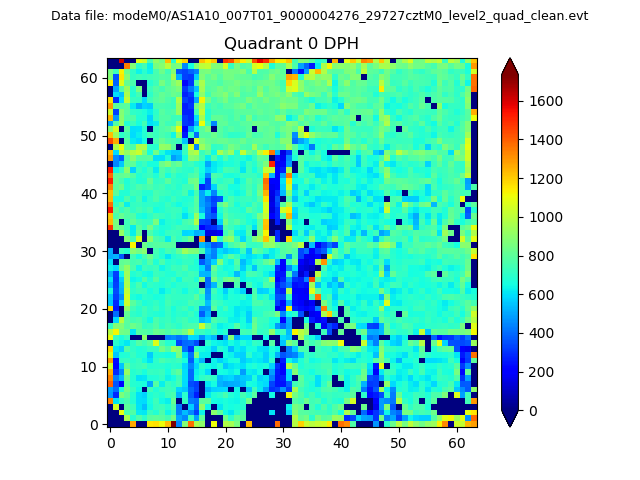 |
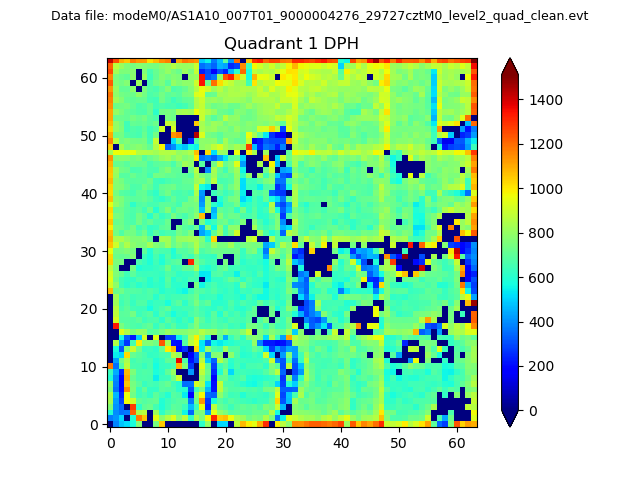 |
Quadrant B |
|---|---|---|---|
| Quadrant D | 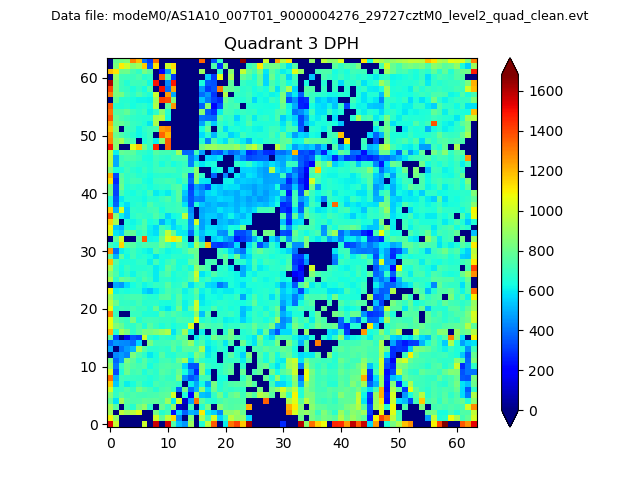 |
 |
Quadrant C |
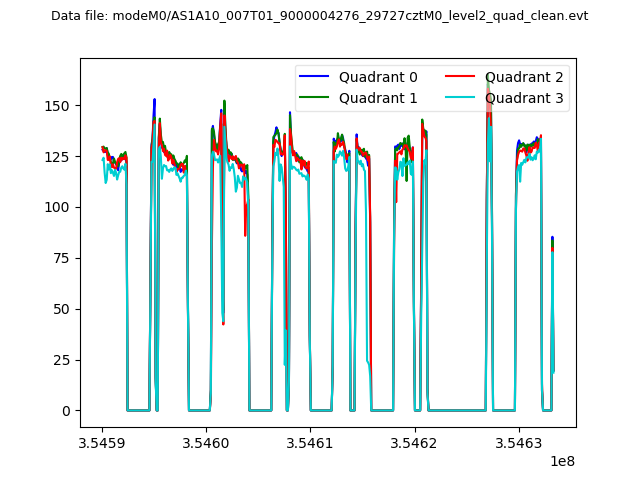
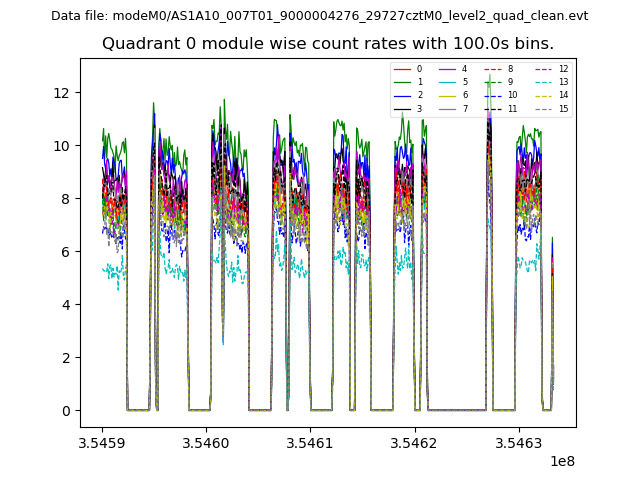
| Plot type | Count rate plots | Images |
|---|---|---|
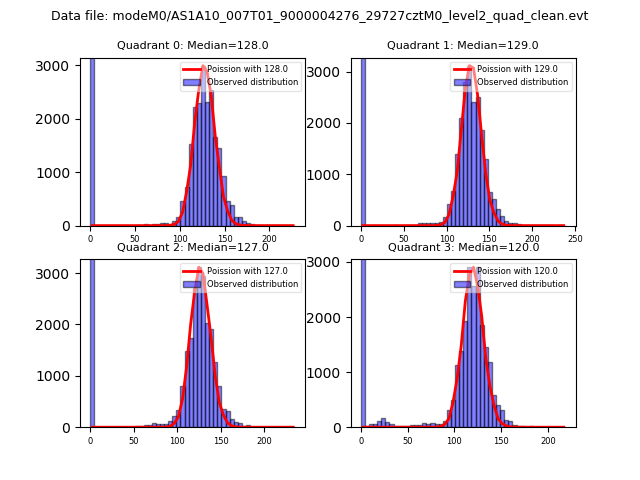
| Comparison with Poisson distribution Blue bars denote a histogram of data divided into 1 sec bins. Red curve is a Poisson curve with rate = median count rate of data. |
 |
 |
| Quadrant-wise count rates Data is divided into 100 sec bins |
 |
|
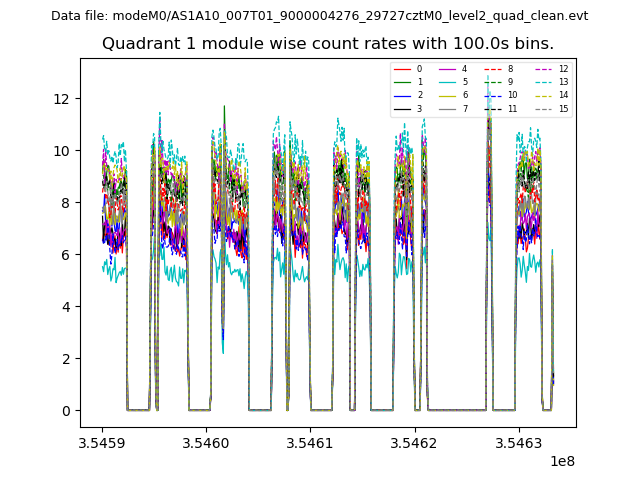
| Module-wise count rates for Quadrant A Data is divided into 100 sec bins |
 |
 |
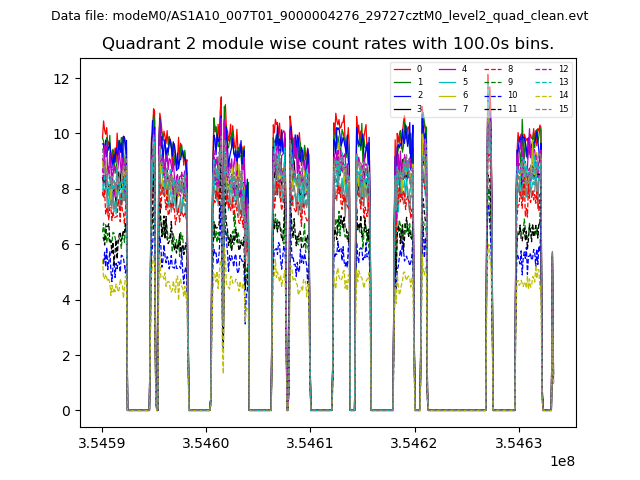
| Module-wise count rates for Quadrant B Data is divided into 100 sec bins |
 |
 |
| Module-wise count rates for Quadrant C Data is divided into 100 sec bins |
 |
 |
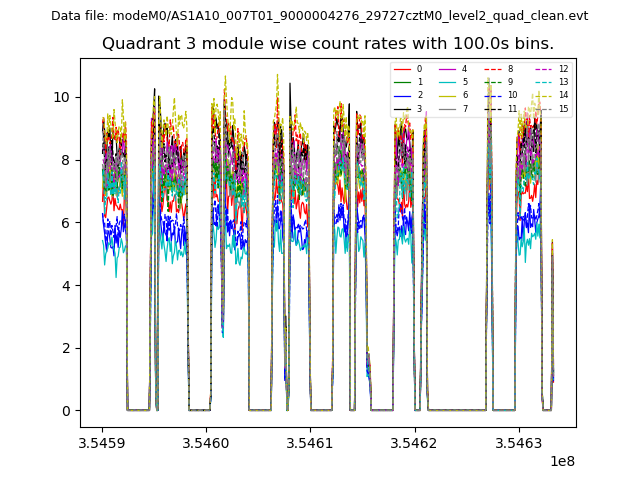
| Module-wise count rates for Quadrant D Data is divided into 100 sec bins |
 |
 |
| Parameter | Plot |
|---|---|
| CZT HV Monitor | 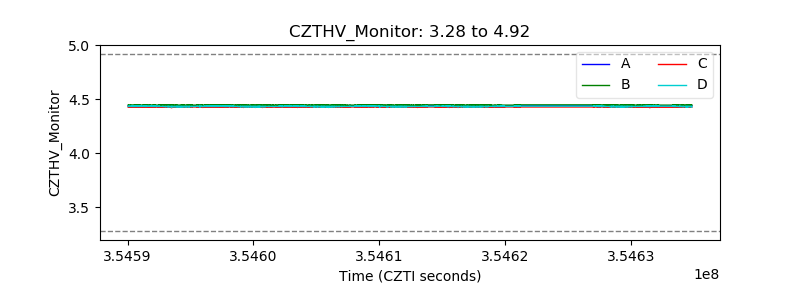 |
| D_VDD | 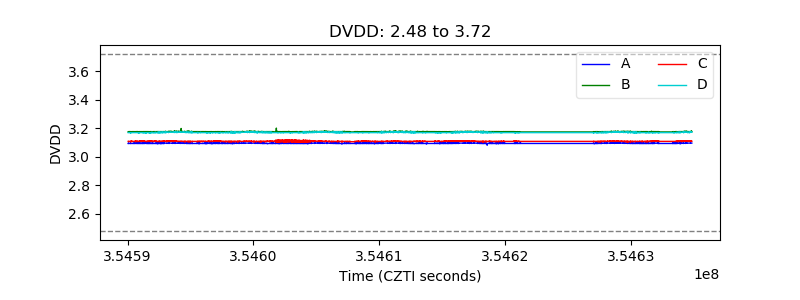 |
| Temperature 1 | 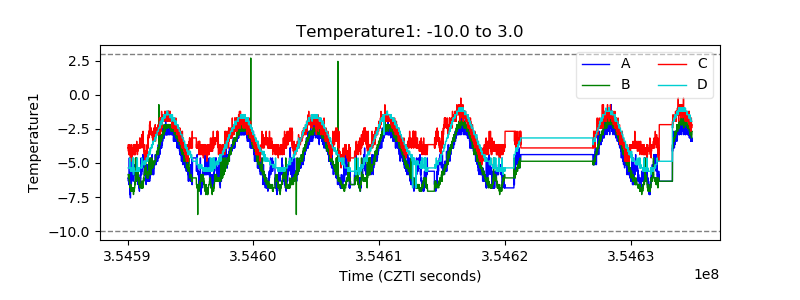 |
| Veto HV Monitor | 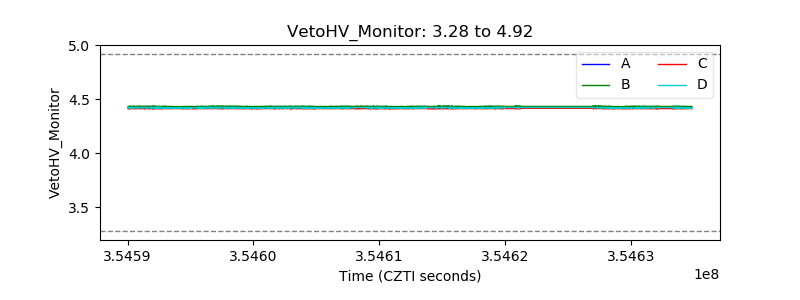 |
| Veto LLD | 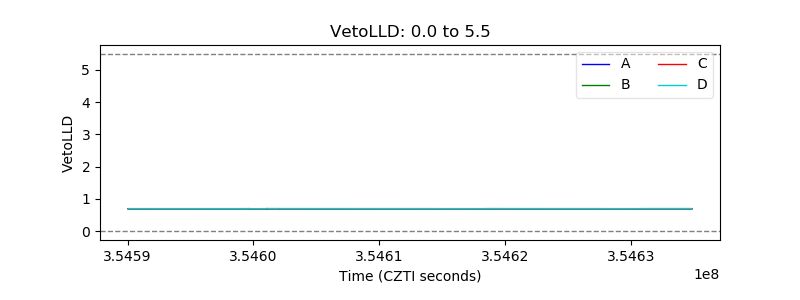 |
| Alpha Counter | 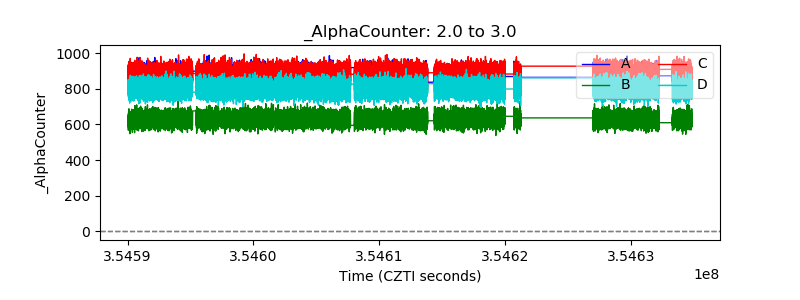 |
| _CPM_Rate | 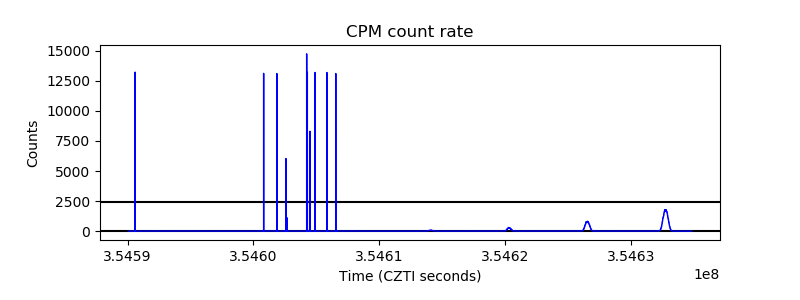 |
| CZT Counter | 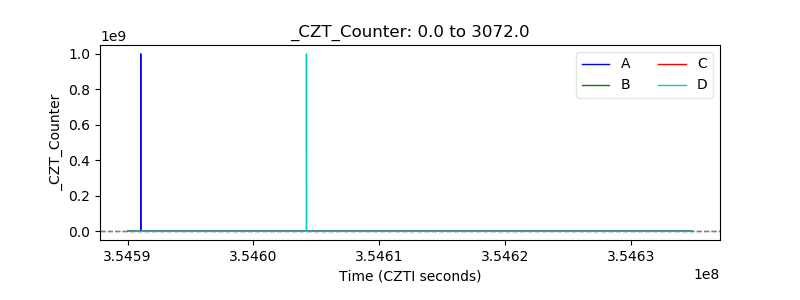 |
| +2.5 Volts monitor |  |
| +5 Volts monitor |  |
| _ROLL_ROT | 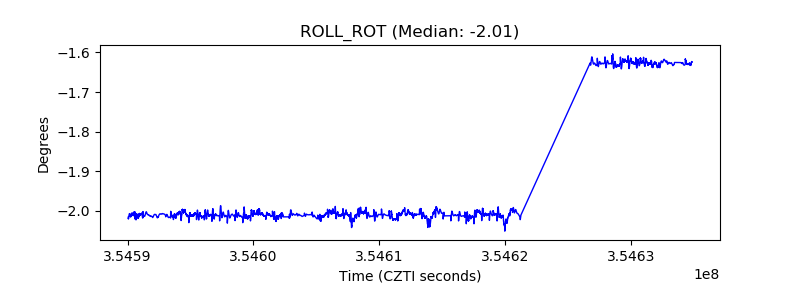 |
| _Roll_DEC | 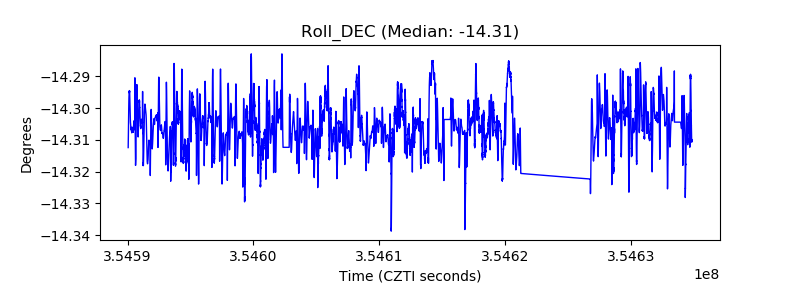 |
| _Roll_RA | 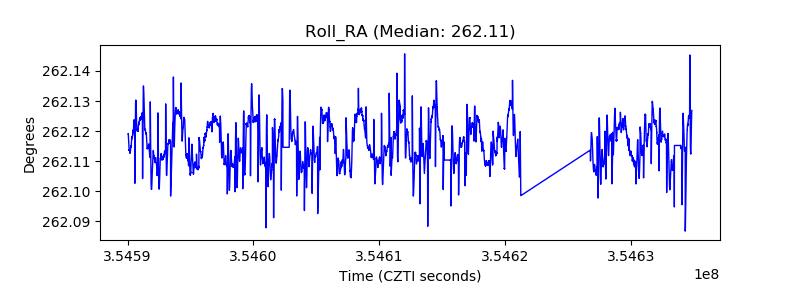 |
| Veto Counter |  |