| Param | Original file | Final file |
|---|---|---|
| Filename | modeM0/AS1A10_007T01_9000004276_29729cztM0_level2.evt | modeM0/AS1A10_007T01_9000004276_29729cztM0_level2_quad_clean.evt |
| Size (bytes) | 722,894,400 | 65,407,680 |
| Size | 689.4 MB | 62.4 MB |
| Events in quadrant A | 3,450,467 | 389,925 |
| Events in quadrant B | 5,505,817 | 389,382 |
| Events in quadrant C | 5,401,143 | 376,336 |
| Events in quadrant D | 7,093,496 | 367,337 |
| Mode SS | |||
|---|---|---|---|
| Quadrant | BADHDUFLAG | Total packets | Discarded packets |
| A | 0 | 134 | 0 |
| B | 0 | 134 | 0 |
| C | 0 | 134 | 0 |
| D | 0 | 134 | 0 |
| Mode M0 | |||
|---|---|---|---|
| Quadrant | BADHDUFLAG | Total packets | Discarded packets |
| A | 0 | 14503 | 2 |
| B | 0 | 20692 | 2 |
| C | 0 | 20401 | 2 |
| D | 0 | 25660 | 2 |
| Mode M9 | |||
|---|---|---|---|
| Quadrant | BADHDUFLAG | Total packets | Discarded packets |
| A | 0 | 12 | 0 |
| B | 0 | 13 | 0 |
| C | 0 | 13 | 0 |
| D | 0 | 13 | 0 |
| Quadrant | Total seconds | Saturated seconds | Saturation percentage |
|---|---|---|---|
| A | 6554 | 71 | 1.083308% |
| B | 6554 | 149 | 2.273421% |
| C | 6554 | 841 | 12.831858% |
| D | 6554 | 635 | 9.688740% |
Noise dominated data is calculated using 1-second bins in cleaned event files. If a bin has >2000 counts, and if more than 50% of those come from <1% of pixels, then it is considered to be noise-dominated and hence unusable.
| Quadrant | # 1 sec bins | Bins with >0 counts | Bins with >2000 counts | High rate bins dominated by noise | Noise dominated (total time) | Noise dominated (detector-on time) | Marked lightcurve |
|---|---|---|---|---|---|---|---|
| A | 7714 | 6554 | 0 | 0 | 0.00% | 0.00% | 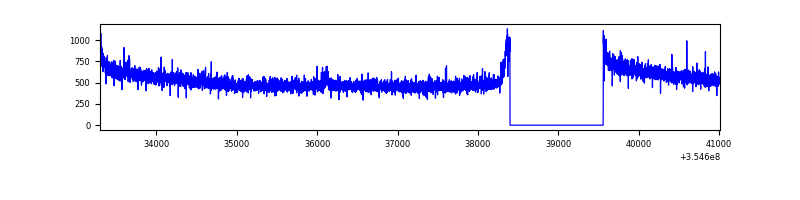 |
| B | 7714 | 6554 | 8 | 8 | 0.10% | 0.12% | 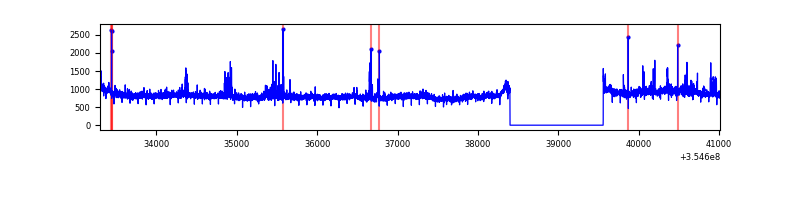 |
| C | 7714 | 6554 | 315 | 315 | 4.08% | 4.81% | 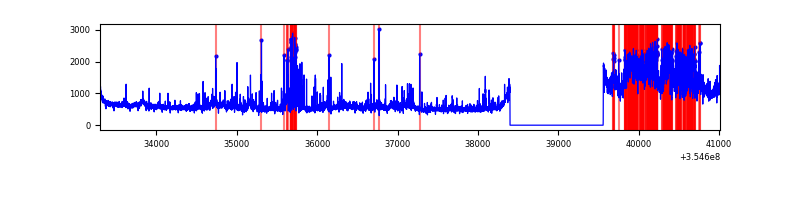 |
| D | 7714 | 6554 | 543 | 543 | 7.04% | 8.29% | 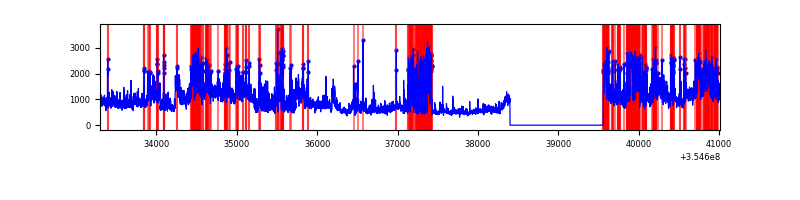 |
Top three noisy pixels from each quadrant. If the there are fewer than three noisy pixels in the level2.evt file, extra rows are filled as -1
| Pixel properties | Quadrant properties | ||||||
|---|---|---|---|---|---|---|---|
| Quadrant | DetID | PixID | Counts | Sigma | Mean | Median | Sigma |
| A | 13 | 254 | 12169 | 64.27 | 892 | 876 | 175.7 |
| A | 3 | 137 | 8471 | 43.22 | 892 | 876 | 175.7 |
| A | 0 | 226 | 7414 | 37.21 | 892 | 876 | 175.7 |
| B | 6 | 159 | 1878005 | 11241.24 | 879 | 858 | 167.0 |
| B | 0 | 229 | 125262 | 744.99 | 879 | 858 | 167.0 |
| B | 0 | 190 | 35810 | 209.31 | 879 | 858 | 167.0 |
| C | 3 | 233 | 1806831 | 9452.74 | 823 | 832 | 191.1 |
| C | 10 | 22 | 154851 | 806.15 | 823 | 832 | 191.1 |
| C | 14 | 238 | 147658 | 768.5 | 823 | 832 | 191.1 |
| D | 8 | 195 | 2460932 | 12503.39 | 837 | 817 | 196.8 |
| D | 7 | 80 | 482289 | 2447.05 | 837 | 817 | 196.8 |
| D | 7 | 238 | 371761 | 1885.3 | 837 | 817 | 196.8 |
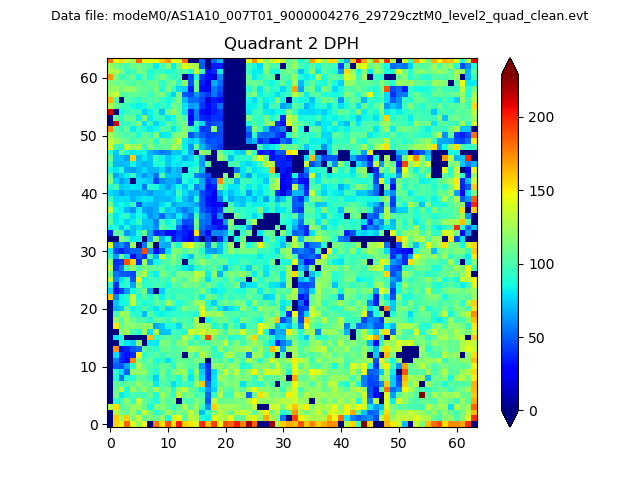
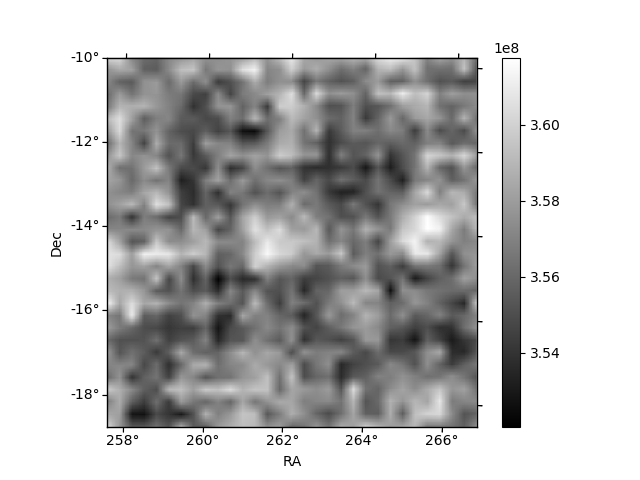
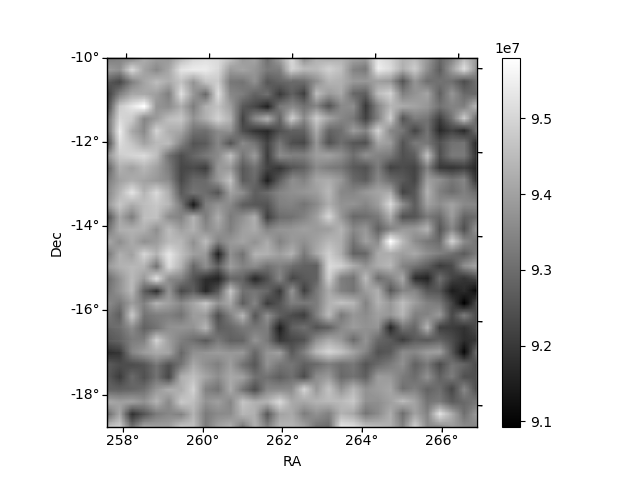
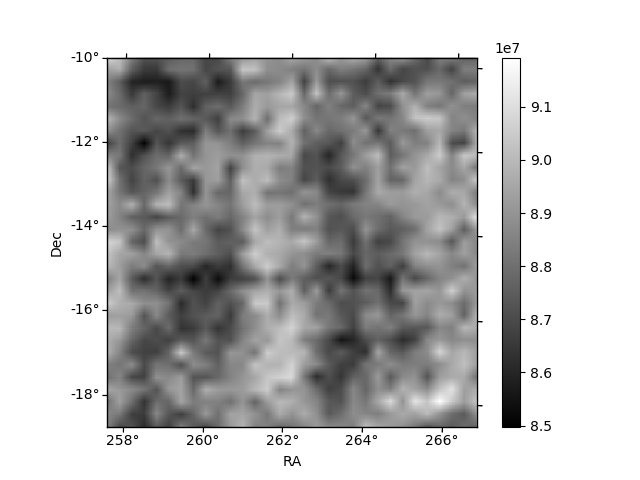
Histogram calculated using DETX and DETY for each event in the final _common_clean file
| Quadrant A | 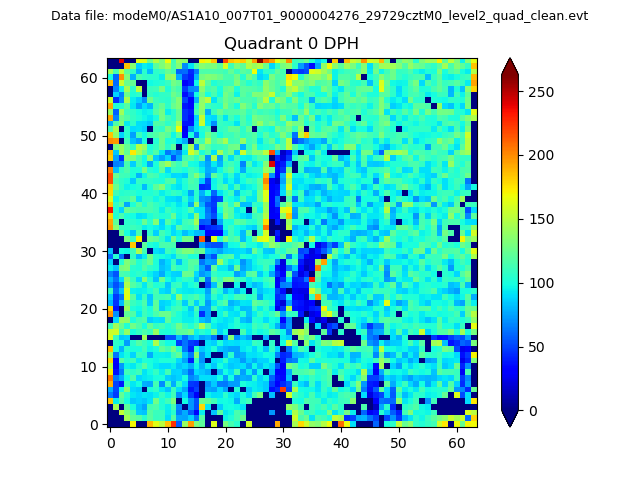 |
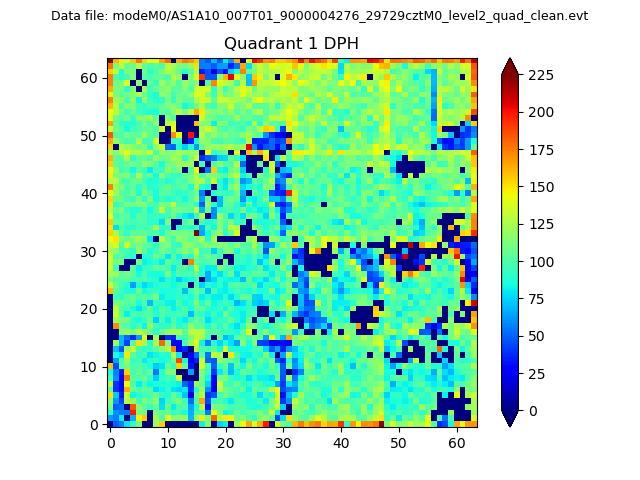 |
Quadrant B |
|---|---|---|---|
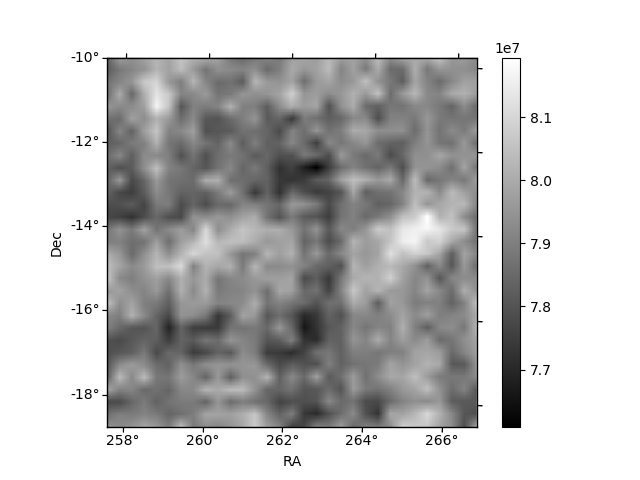
| Quadrant D | 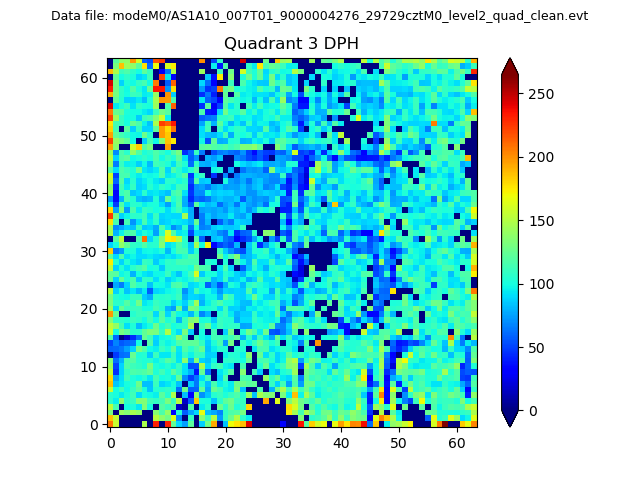 |
 |
Quadrant C |
| Plot type | Count rate plots | Images |
|---|---|---|
| Comparison with Poisson distribution Blue bars denote a histogram of data divided into 1 sec bins. Red curve is a Poisson curve with rate = median count rate of data. |
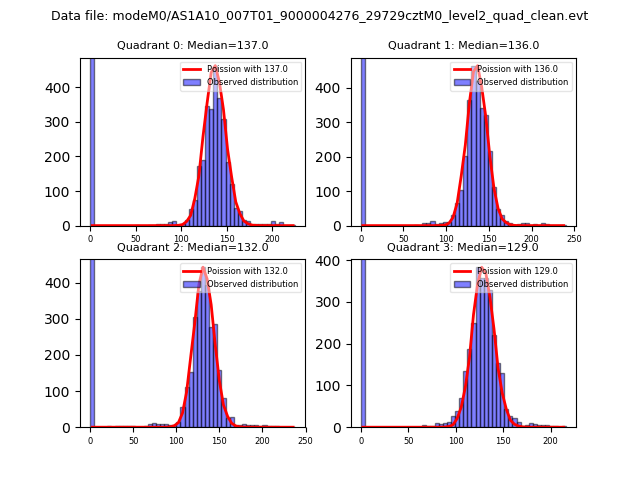 |
 |
| Quadrant-wise count rates Data is divided into 100 sec bins |
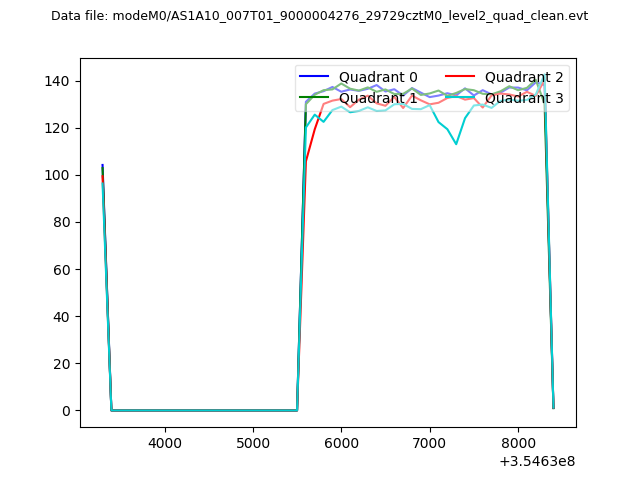 |
|
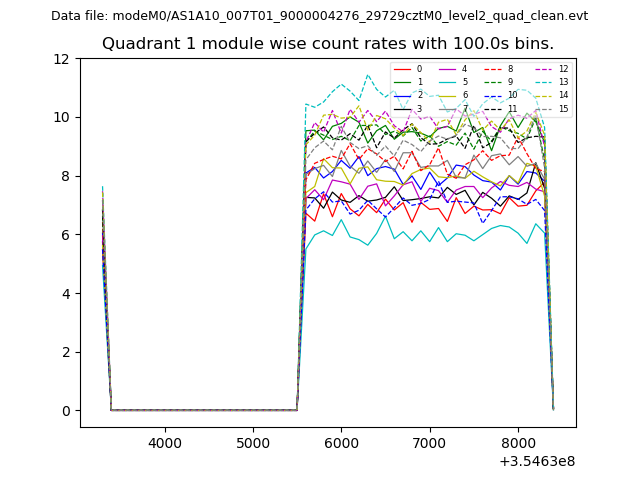
| Module-wise count rates for Quadrant A Data is divided into 100 sec bins |
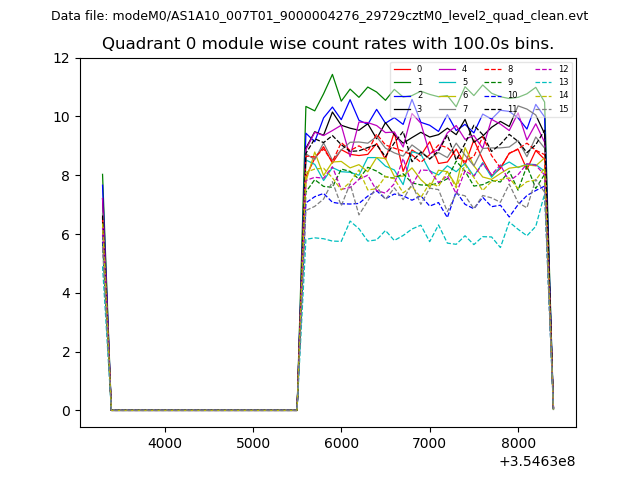 |
 |
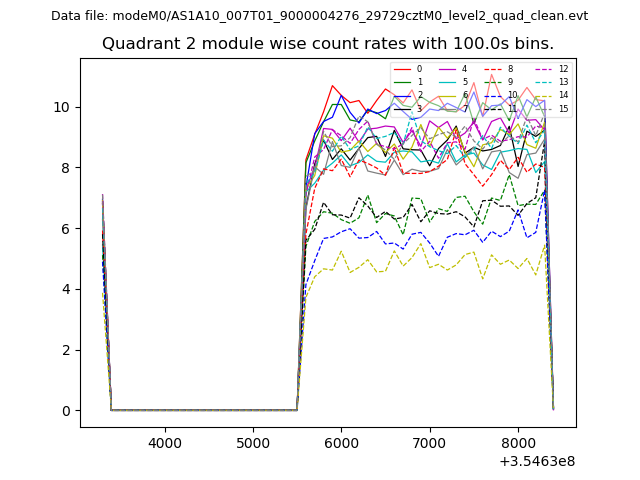
| Module-wise count rates for Quadrant B Data is divided into 100 sec bins |
 |
 |
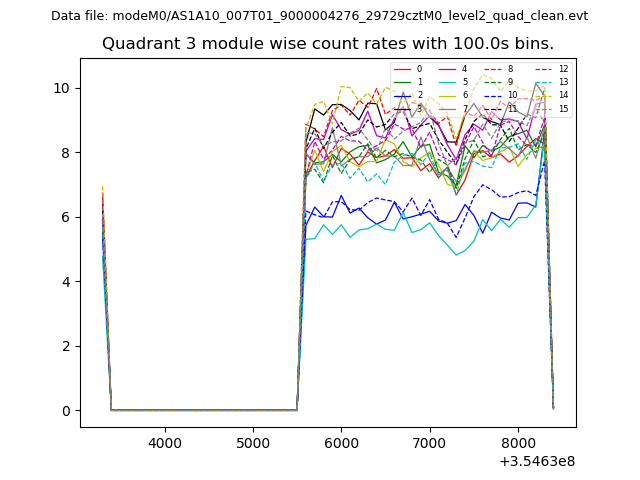
| Module-wise count rates for Quadrant C Data is divided into 100 sec bins |
 |
 |
| Module-wise count rates for Quadrant D Data is divided into 100 sec bins |
 |
 |
| Parameter | Plot |
|---|---|
| CZT HV Monitor | 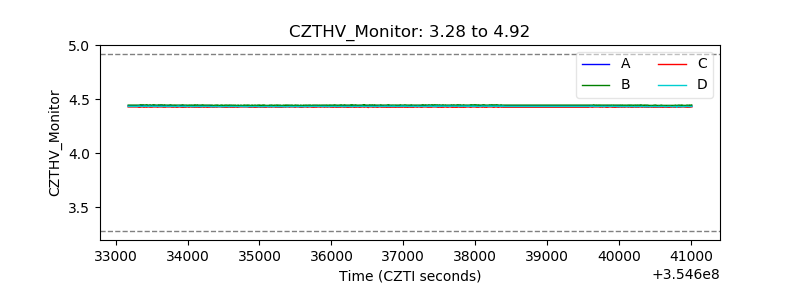 |
| D_VDD |  |
| Temperature 1 |  |
| Veto HV Monitor | 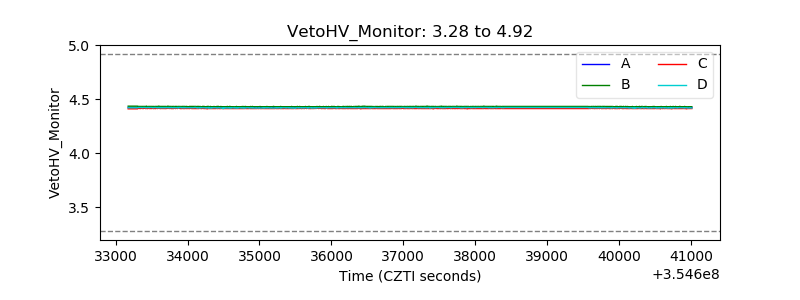 |
| Veto LLD |  |
| Alpha Counter | 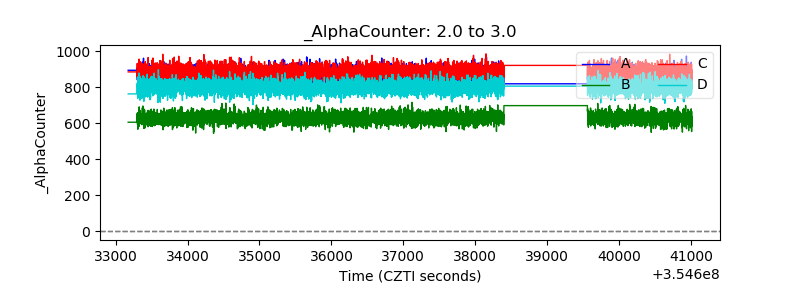 |
| _CPM_Rate | 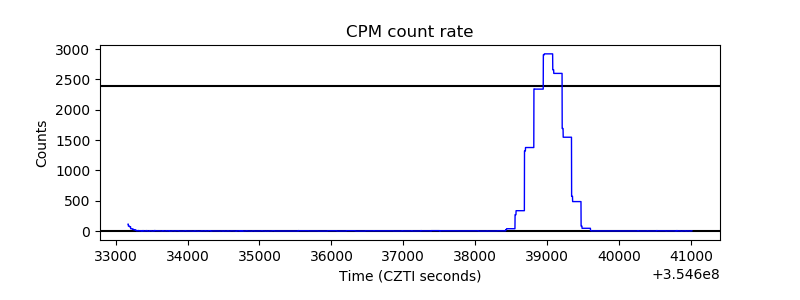 |
| CZT Counter | 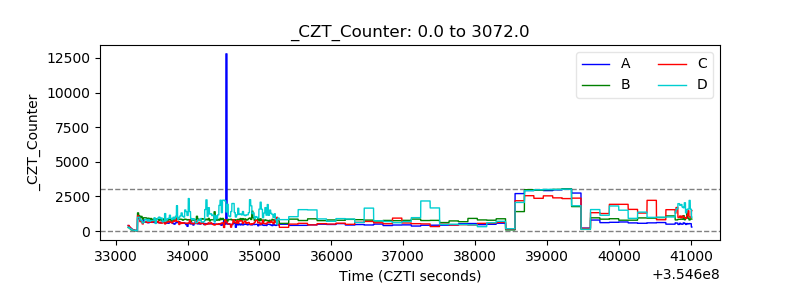 |
| +2.5 Volts monitor |  |
| +5 Volts monitor |  |
| _ROLL_ROT | 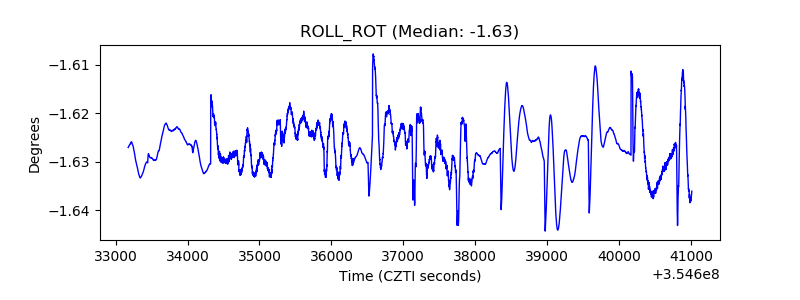 |
| _Roll_DEC | 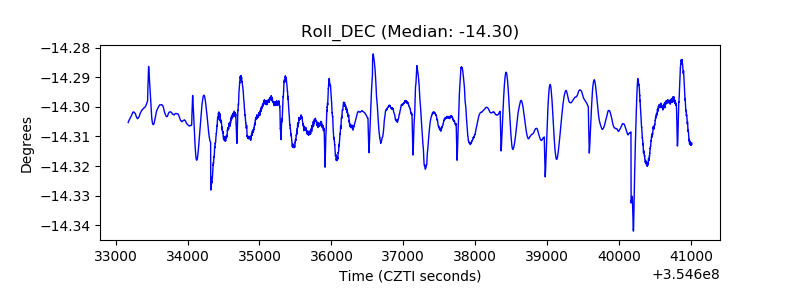 |
| _Roll_RA | 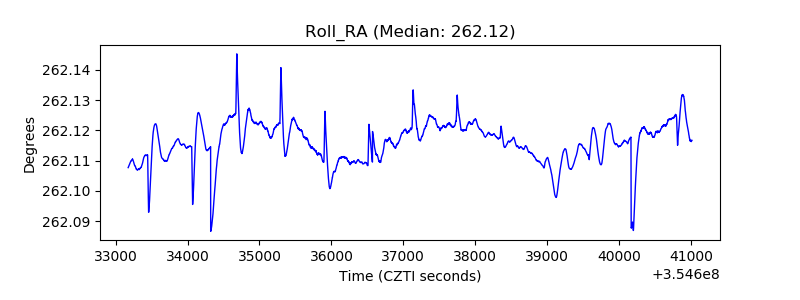 |
| Veto Counter | 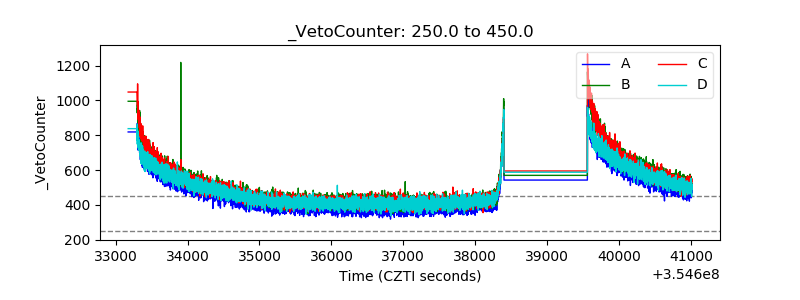 |