| Param | Original file | Final file |
|---|---|---|
| Filename | modeM0/AS1A10_007T01_9000004276_29730cztM0_level2.evt | modeM0/AS1A10_007T01_9000004276_29730cztM0_level2_quad_clean.evt |
| Size (bytes) | 1,204,136,640 | 128,197,440 |
| Size | 1.1 GB | 122.3 MB |
| Events in quadrant A | 5,492,076 | 821,380 |
| Events in quadrant B | 8,959,737 | 821,954 |
| Events in quadrant C | 9,109,360 | 787,852 |
| Events in quadrant D | 12,200,098 | 722,592 |
| Mode SS | |||
|---|---|---|---|
| Quadrant | BADHDUFLAG | Total packets | Discarded packets |
| A | 0 | 214 | 0 |
| B | 0 | 214 | 0 |
| C | 0 | 214 | 0 |
| D | 0 | 214 | 0 |
| Mode M0 | |||
|---|---|---|---|
| Quadrant | BADHDUFLAG | Total packets | Discarded packets |
| A | 0 | 23070 | 2 |
| B | 0 | 33681 | 2 |
| C | 0 | 34351 | 2 |
| D | 0 | 43579 | 2 |
| Mode M9 | |||
|---|---|---|---|
| Quadrant | BADHDUFLAG | Total packets | Discarded packets |
| A | 0 | 24 | 0 |
| B | 0 | 24 | 0 |
| C | 0 | 24 | 0 |
| D | 0 | 24 | 0 |
| Quadrant | Total seconds | Saturated seconds | Saturation percentage |
|---|---|---|---|
| A | 10517 | 101 | 0.960350% |
| B | 10518 | 241 | 2.291310% |
| C | 10518 | 1061 | 10.087469% |
| D | 10518 | 1430 | 13.595741% |
Noise dominated data is calculated using 1-second bins in cleaned event files. If a bin has >2000 counts, and if more than 50% of those come from <1% of pixels, then it is considered to be noise-dominated and hence unusable.
| Quadrant | # 1 sec bins | Bins with >0 counts | Bins with >2000 counts | High rate bins dominated by noise | Noise dominated (total time) | Noise dominated (detector-on time) | Marked lightcurve |
|---|---|---|---|---|---|---|---|
| A | 12957 | 10517 | 0 | 0 | 0.00% | 0.00% | 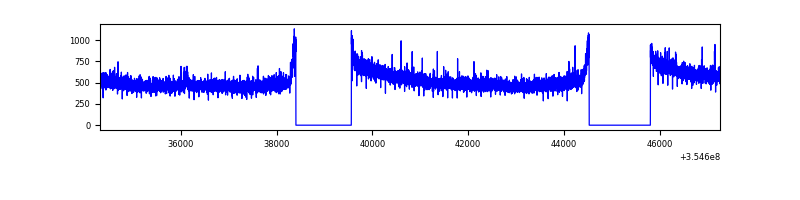 |
| B | 12958 | 10518 | 15 | 15 | 0.12% | 0.14% | 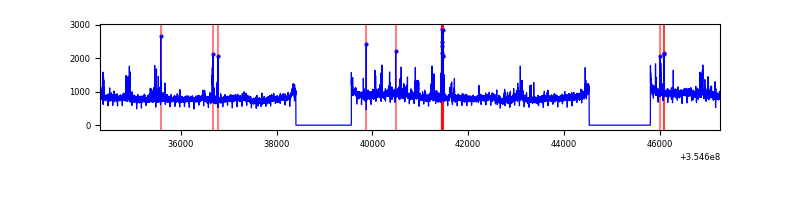 |
| C | 12958 | 10518 | 331 | 331 | 2.55% | 3.15% | 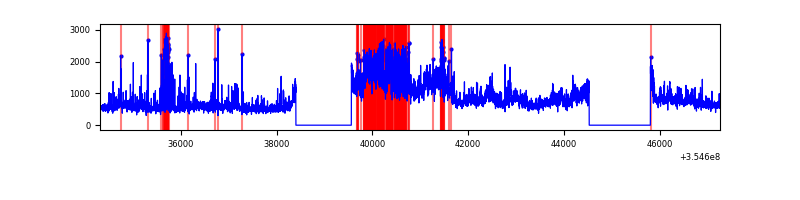 |
| D | 12958 | 10518 | 1149 | 1149 | 8.87% | 10.92% | 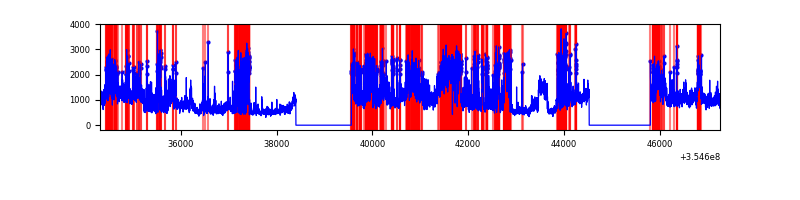 |
Top three noisy pixels from each quadrant. If the there are fewer than three noisy pixels in the level2.evt file, extra rows are filled as -1
| Pixel properties | Quadrant properties | ||||||
|---|---|---|---|---|---|---|---|
| Quadrant | DetID | PixID | Counts | Sigma | Mean | Median | Sigma |
| A | 12 | 16 | 27525 | 94.0 | 1415 | 1393 | 278.0 |
| A | 13 | 254 | 19864 | 66.44 | 1415 | 1393 | 278.0 |
| A | 12 | 194 | 14393 | 46.76 | 1415 | 1393 | 278.0 |
| B | 6 | 159 | 3126038 | 11884.02 | 1402 | 1370 | 262.9 |
| B | 0 | 229 | 216430 | 817.93 | 1402 | 1370 | 262.9 |
| B | 0 | 190 | 57669 | 214.12 | 1402 | 1370 | 262.9 |
| C | 3 | 233 | 3398551 | 11216.0 | 1322 | 1338 | 302.9 |
| C | 14 | 238 | 231020 | 758.3 | 1322 | 1338 | 302.9 |
| C | 10 | 22 | 191950 | 629.31 | 1322 | 1338 | 302.9 |
| D | 8 | 195 | 3743112 | 12330.33 | 1298 | 1269 | 303.5 |
| D | 7 | 238 | 1894225 | 6237.78 | 1298 | 1269 | 303.5 |
| D | 7 | 80 | 833062 | 2740.97 | 1298 | 1269 | 303.5 |
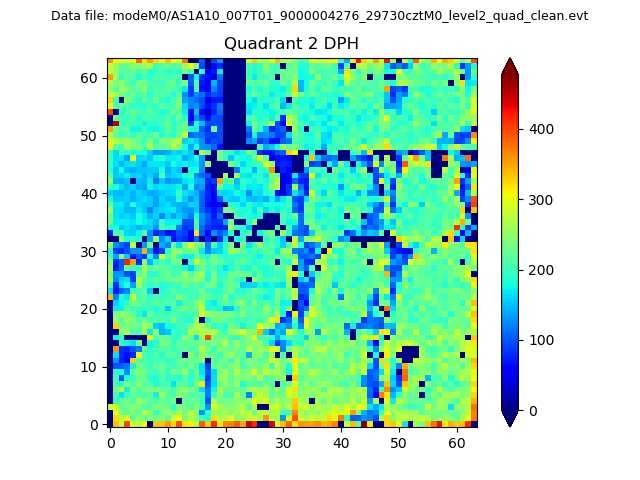
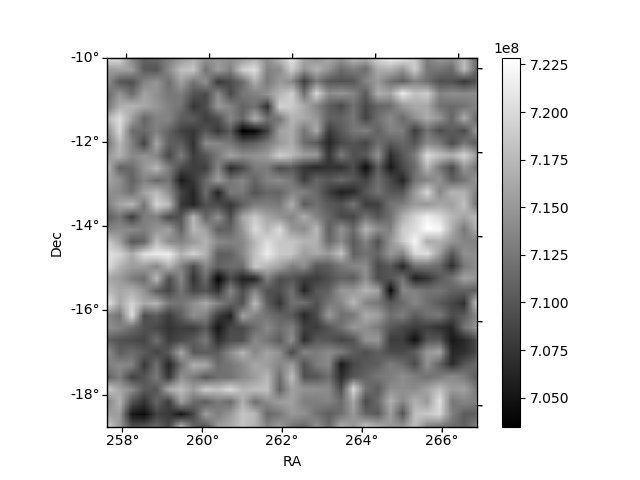
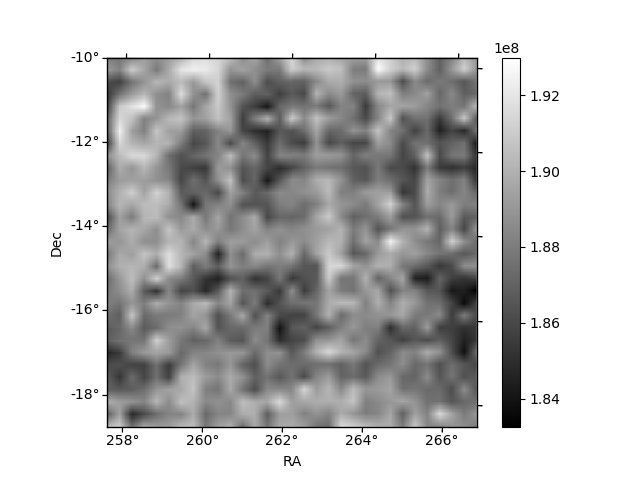
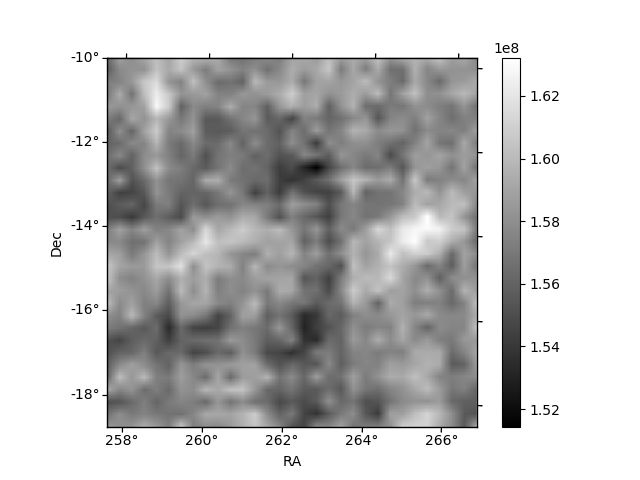
Histogram calculated using DETX and DETY for each event in the final _common_clean file
| Quadrant A | 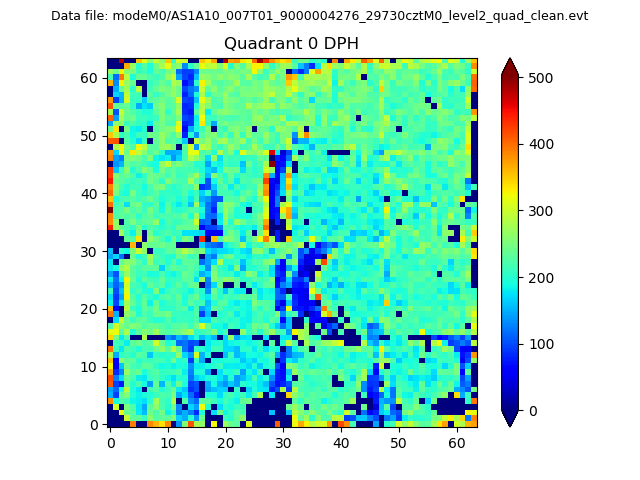 |
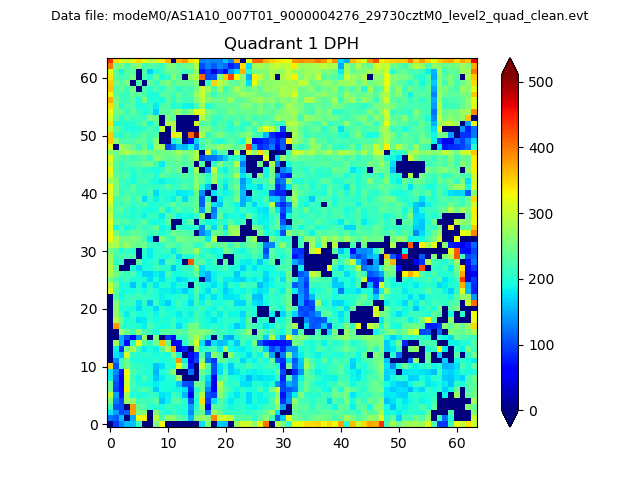 |
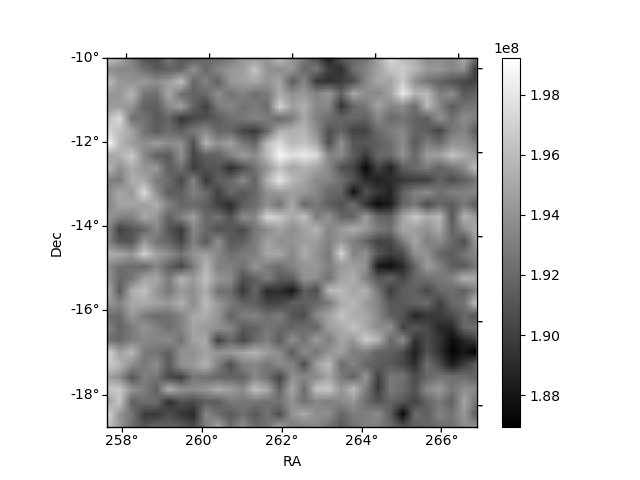
Quadrant B |
|---|---|---|---|
| Quadrant D | 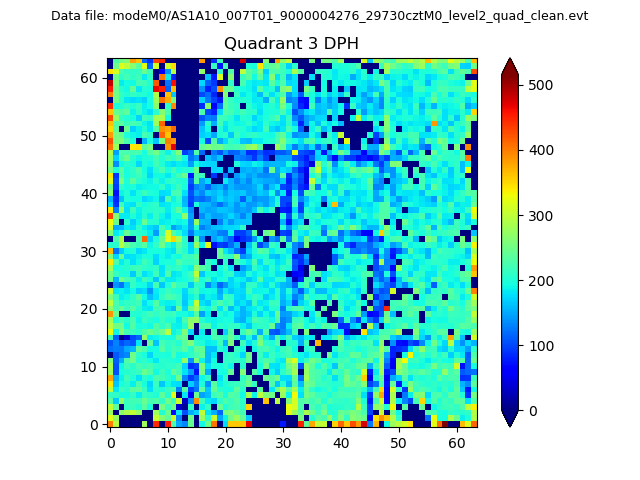 |
 |
Quadrant C |
| Plot type | Count rate plots | Images |
|---|---|---|
| Comparison with Poisson distribution Blue bars denote a histogram of data divided into 1 sec bins. Red curve is a Poisson curve with rate = median count rate of data. |
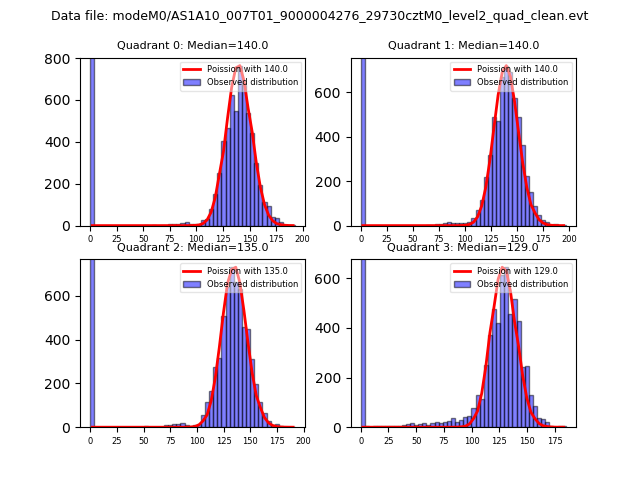 |
 |
| Quadrant-wise count rates Data is divided into 100 sec bins |
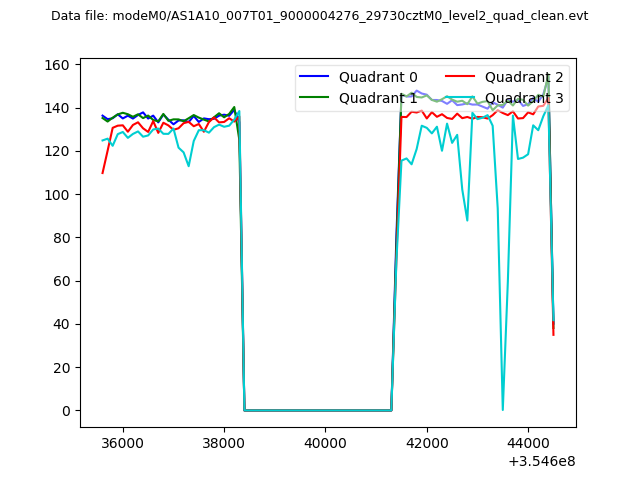 |
|
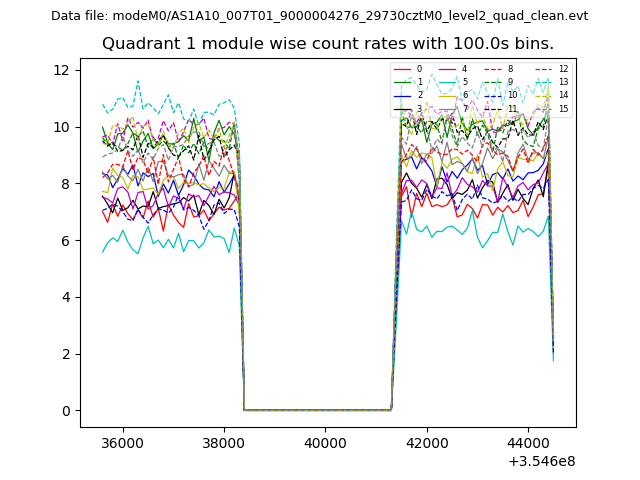
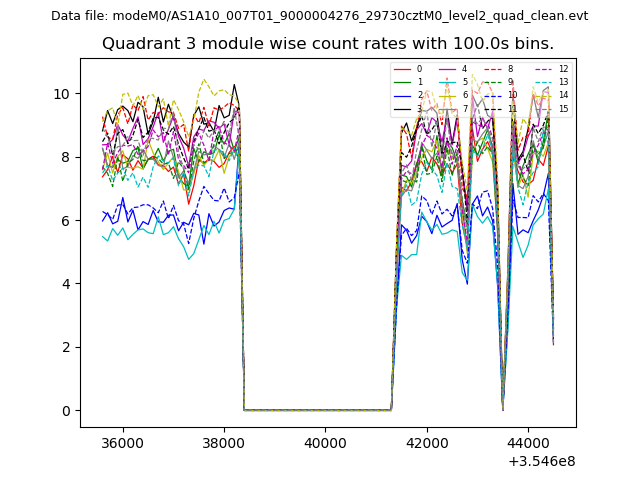
| Module-wise count rates for Quadrant A Data is divided into 100 sec bins |
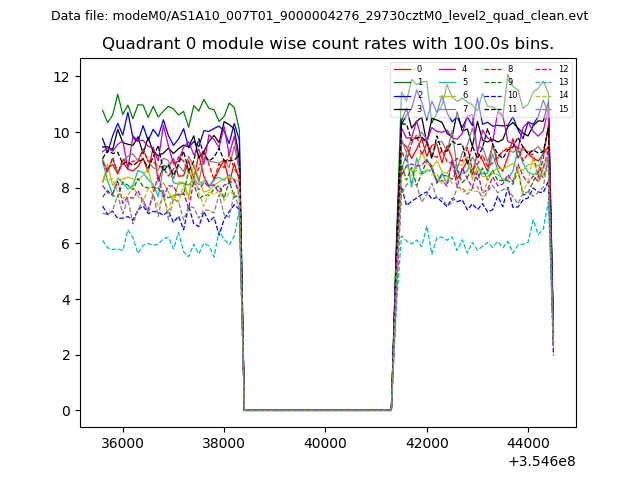 |
 |
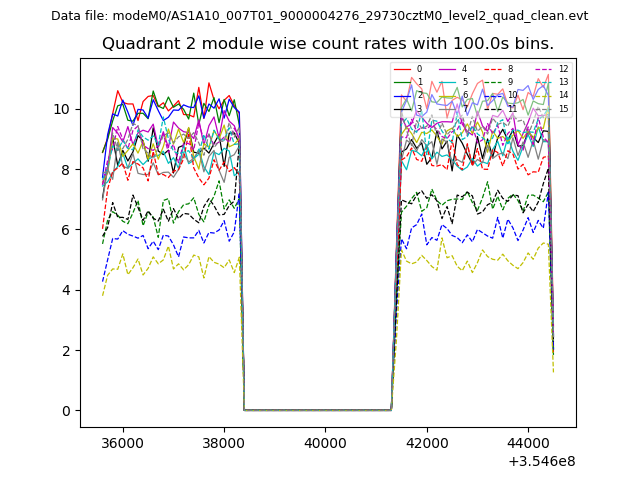
| Module-wise count rates for Quadrant B Data is divided into 100 sec bins |
 |
 |
| Module-wise count rates for Quadrant C Data is divided into 100 sec bins |
 |
 |
| Module-wise count rates for Quadrant D Data is divided into 100 sec bins |
 |
 |
| Parameter | Plot |
|---|---|
| CZT HV Monitor | 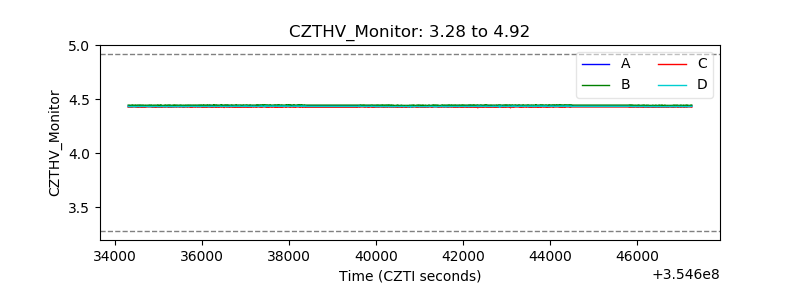 |
| D_VDD | 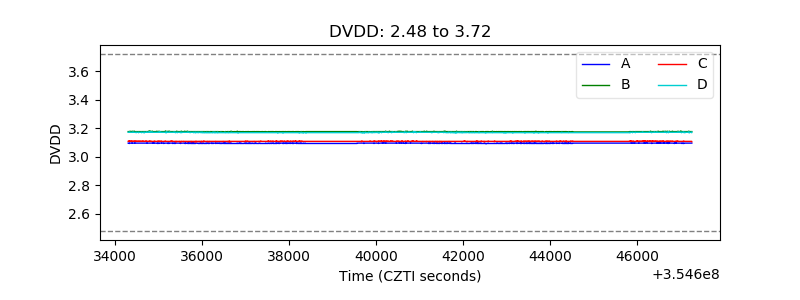 |
| Temperature 1 |  |
| Veto HV Monitor | 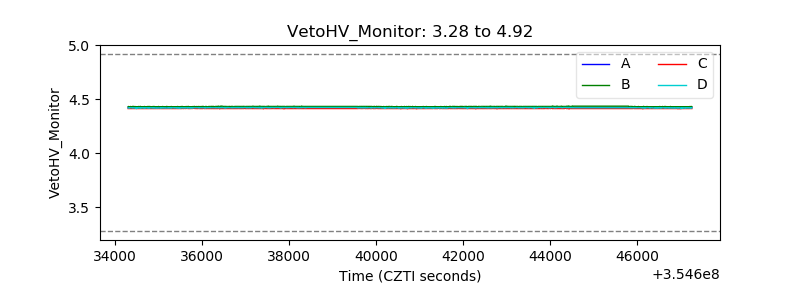 |
| Veto LLD | 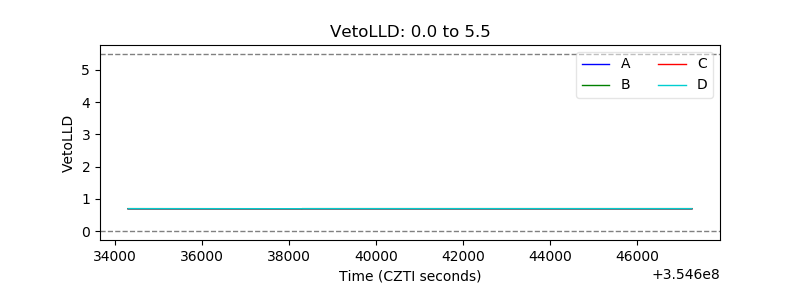 |
| Alpha Counter | 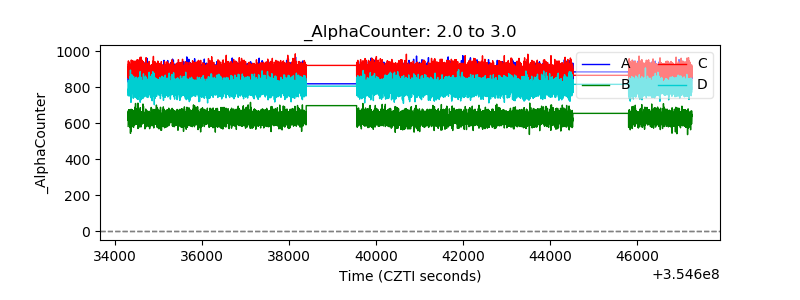 |
| _CPM_Rate | 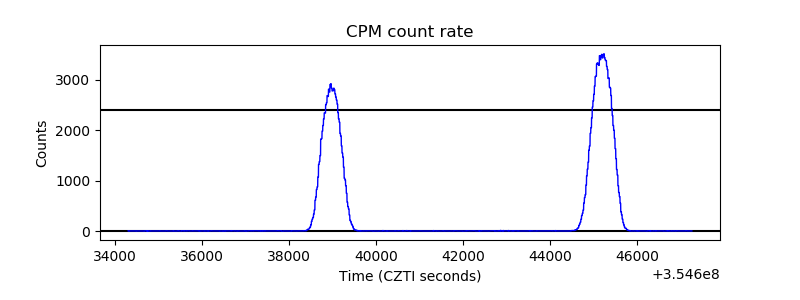 |
| CZT Counter | 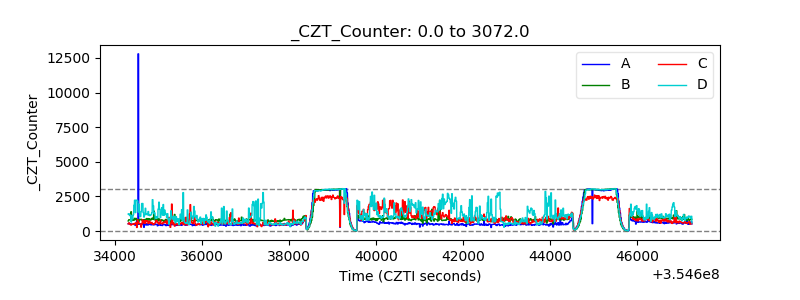 |
| +2.5 Volts monitor |  |
| +5 Volts monitor |  |
| _ROLL_ROT | 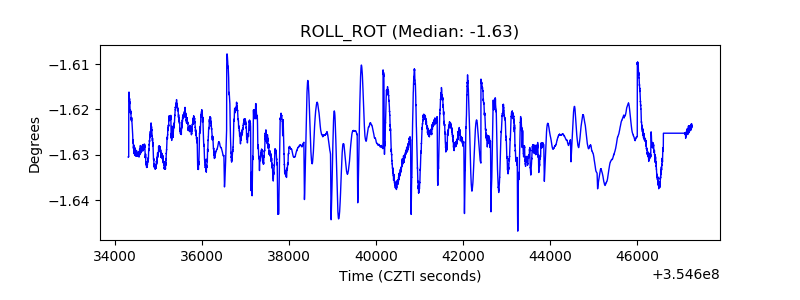 |
| _Roll_DEC | 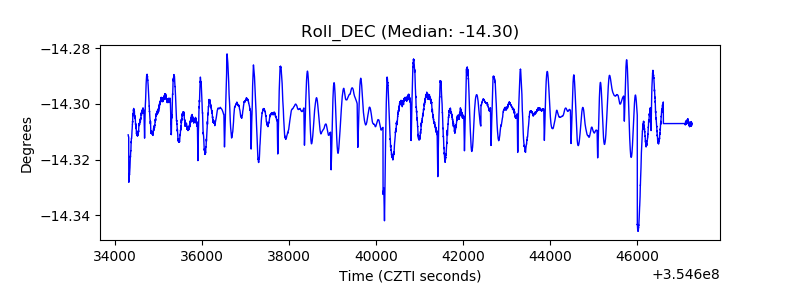 |
| _Roll_RA | 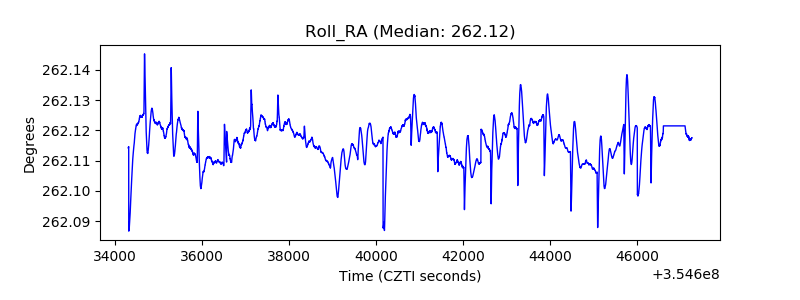 |
| Veto Counter | 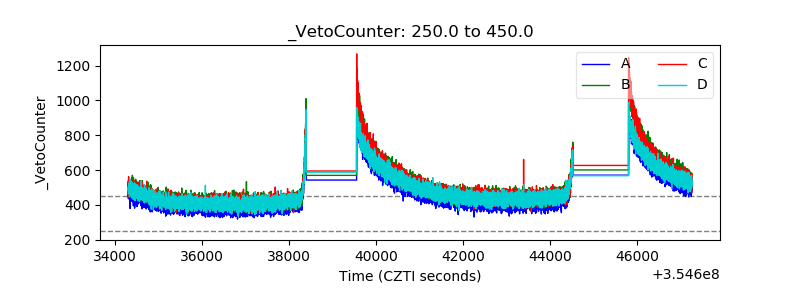 |