| Param | Original file | Final file |
|---|---|---|
| Filename | modeM0/AS1A10_007T01_9000004276_29731cztM0_level2.evt | modeM0/AS1A10_007T01_9000004276_29731cztM0_level2_quad_clean.evt |
| Size (bytes) | 671,086,080 | 83,393,280 |
| Size | 640.0 MB | 79.5 MB |
| Events in quadrant A | 3,253,321 | 548,027 |
| Events in quadrant B | 5,222,903 | 552,005 |
| Events in quadrant C | 4,876,669 | 519,362 |
| Events in quadrant D | 6,573,489 | 493,495 |
| Mode SS | |||
|---|---|---|---|
| Quadrant | BADHDUFLAG | Total packets | Discarded packets |
| A | 0 | 120 | 0 |
| B | 0 | 120 | 0 |
| C | 0 | 120 | 0 |
| D | 0 | 120 | 0 |
| Mode M0 | |||
|---|---|---|---|
| Quadrant | BADHDUFLAG | Total packets | Discarded packets |
| A | 0 | 13466 | 1 |
| B | 0 | 19359 | 1 |
| C | 0 | 18875 | 1 |
| D | 0 | 23678 | 1 |
| Mode M9 | |||
|---|---|---|---|
| Quadrant | BADHDUFLAG | Total packets | Discarded packets |
| A | 0 | 13 | 0 |
| B | 0 | 13 | 0 |
| C | 0 | 13 | 0 |
| D | 0 | 13 | 0 |
| Quadrant | Total seconds | Saturated seconds | Saturation percentage |
|---|---|---|---|
| A | 5898 | 65 | 1.102068% |
| B | 5899 | 153 | 2.593660% |
| C | 5899 | 552 | 9.357518% |
| D | 5899 | 547 | 9.272758% |
Noise dominated data is calculated using 1-second bins in cleaned event files. If a bin has >2000 counts, and if more than 50% of those come from <1% of pixels, then it is considered to be noise-dominated and hence unusable.
| Quadrant | # 1 sec bins | Bins with >0 counts | Bins with >2000 counts | High rate bins dominated by noise | Noise dominated (total time) | Noise dominated (detector-on time) | Marked lightcurve |
|---|---|---|---|---|---|---|---|
| A | 7233 | 5898 | 0 | 0 | 0.00% | 0.00% | 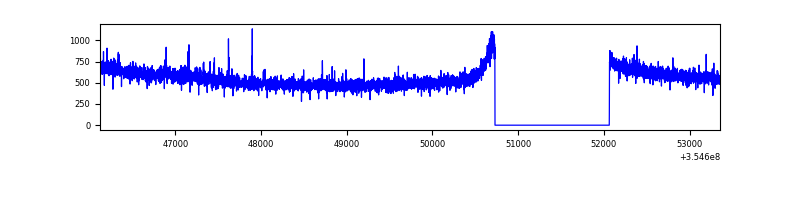 |
| B | 7234 | 5899 | 4 | 4 | 0.06% | 0.07% | 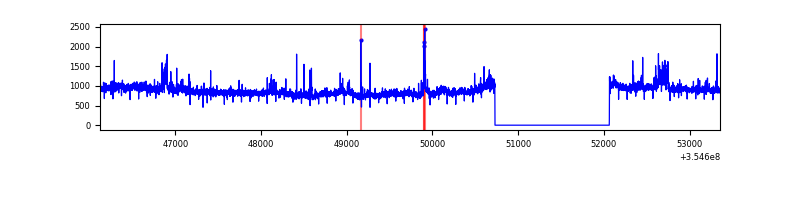 |
| C | 7234 | 5899 | 4 | 4 | 0.06% | 0.07% | 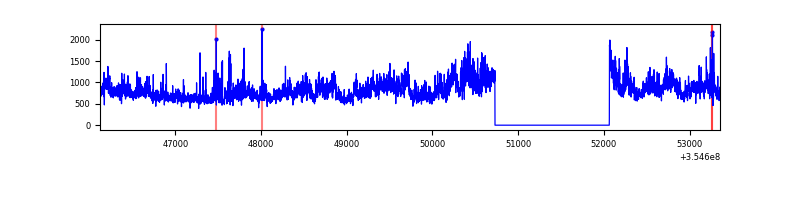 |
| D | 7234 | 5899 | 495 | 495 | 6.84% | 8.39% | 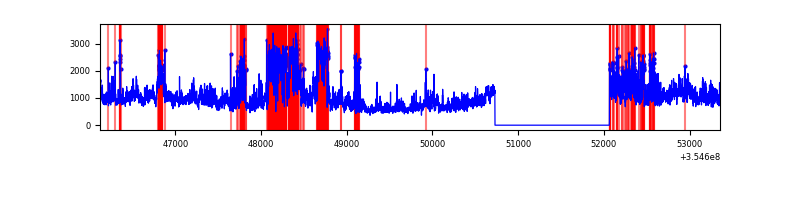 |
Top three noisy pixels from each quadrant. If the there are fewer than three noisy pixels in the level2.evt file, extra rows are filled as -1
| Pixel properties | Quadrant properties | ||||||
|---|---|---|---|---|---|---|---|
| Quadrant | DetID | PixID | Counts | Sigma | Mean | Median | Sigma |
| A | 12 | 16 | 35728 | 210.35 | 832 | 819 | 166.0 |
| A | 12 | 194 | 12141 | 68.22 | 832 | 819 | 166.0 |
| A | 13 | 254 | 11721 | 65.69 | 832 | 819 | 166.0 |
| B | 6 | 159 | 1790426 | 11605.02 | 828 | 813 | 154.2 |
| B | 15 | 32 | 53471 | 341.47 | 828 | 813 | 154.2 |
| B | 0 | 229 | 49915 | 318.41 | 828 | 813 | 154.2 |
| C | 3 | 233 | 1423433 | 8002.62 | 777 | 787 | 177.8 |
| C | 14 | 238 | 222246 | 1245.74 | 777 | 787 | 177.8 |
| C | 14 | 254 | 133262 | 745.19 | 777 | 787 | 177.8 |
| D | 8 | 195 | 2258489 | 12209.49 | 783 | 766 | 184.9 |
| D | 7 | 80 | 1010633 | 5461.24 | 783 | 766 | 184.9 |
| D | 13 | 104 | 185748 | 1000.36 | 783 | 766 | 184.9 |
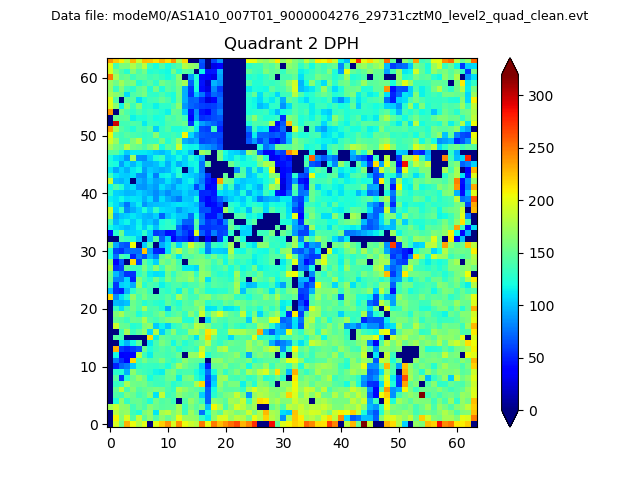
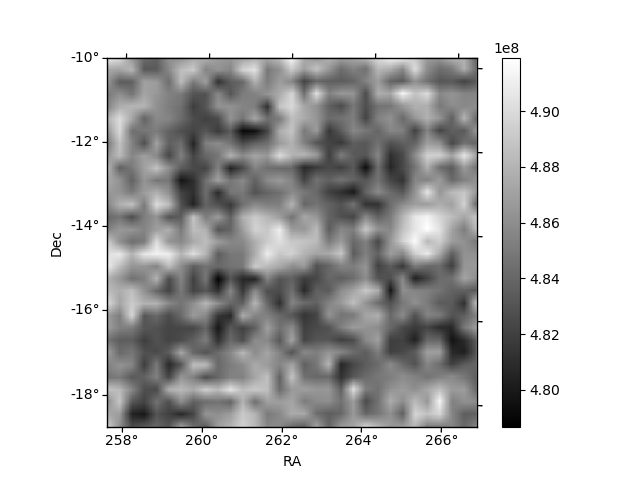
Histogram calculated using DETX and DETY for each event in the final _common_clean file
| Quadrant A | 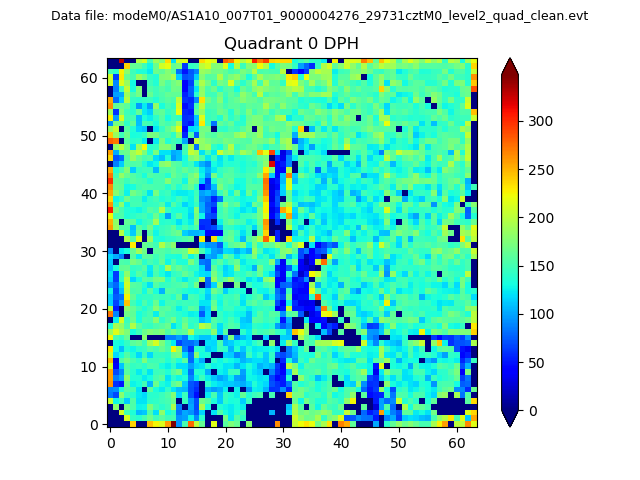 |
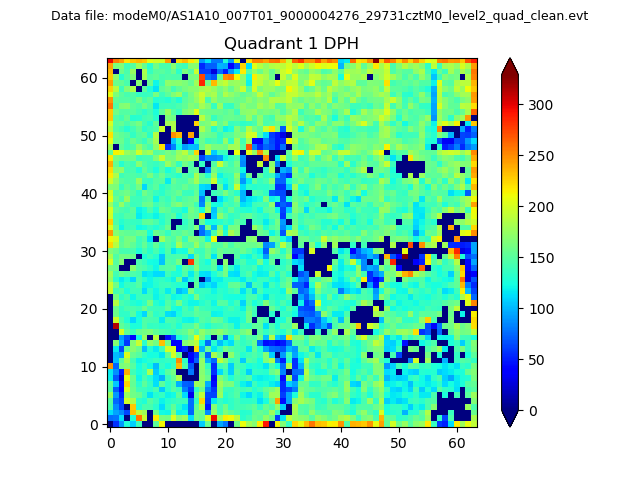 |
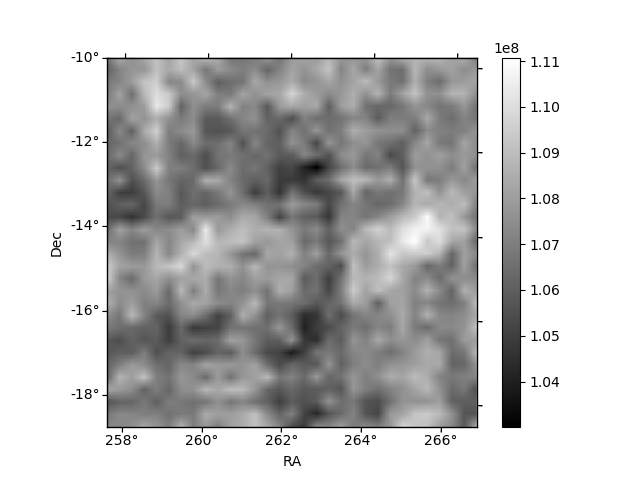
Quadrant B |
|---|---|---|---|
| Quadrant D | 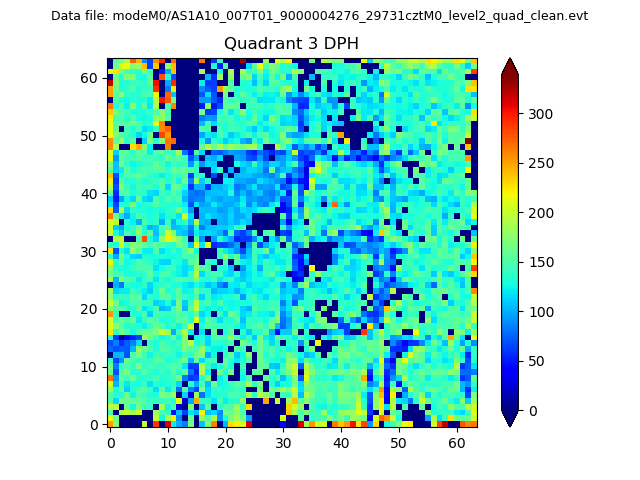 |
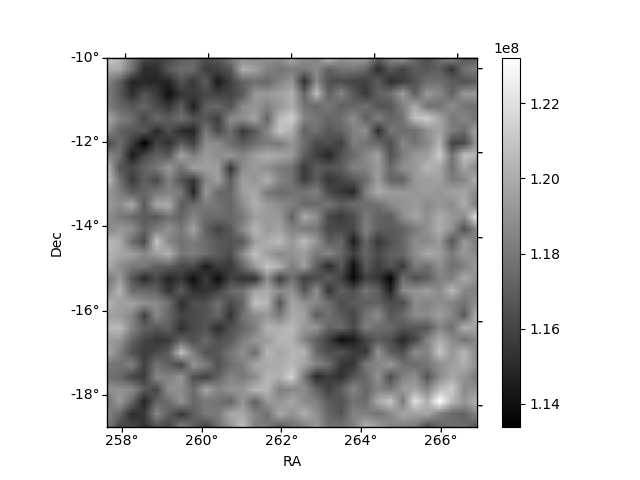
 |
Quadrant C |
| Plot type | Count rate plots | Images |
|---|---|---|
| Comparison with Poisson distribution Blue bars denote a histogram of data divided into 1 sec bins. Red curve is a Poisson curve with rate = median count rate of data. |
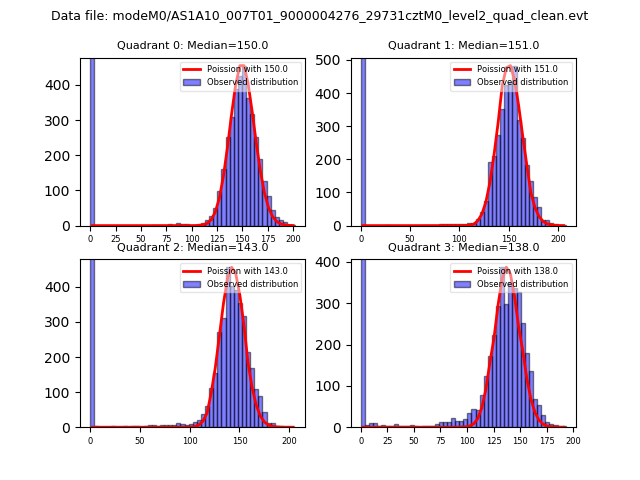 |
 |
| Quadrant-wise count rates Data is divided into 100 sec bins |
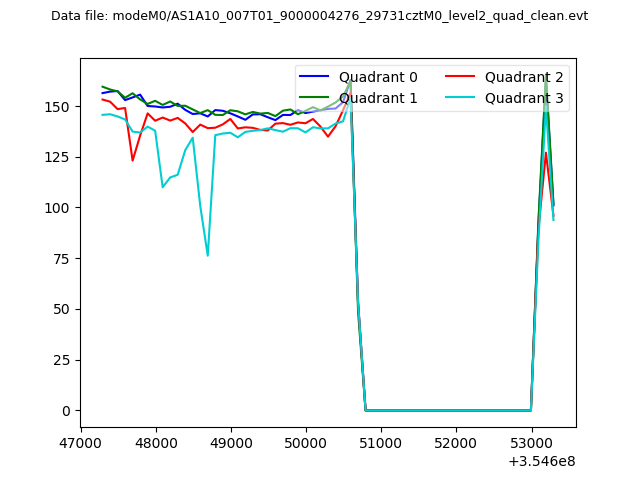 |
|
| Module-wise count rates for Quadrant A Data is divided into 100 sec bins |
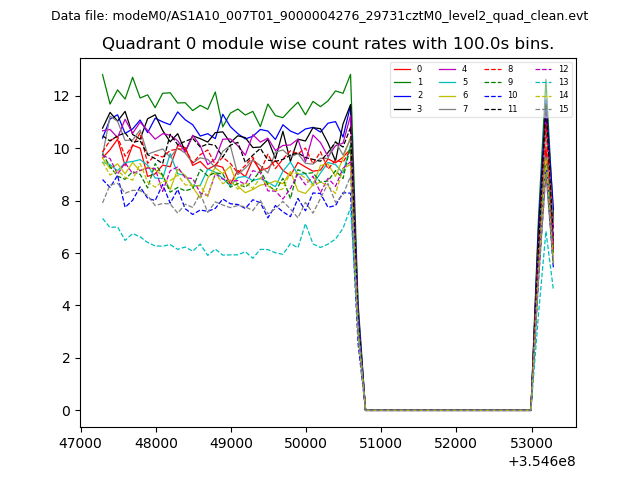 |
 |
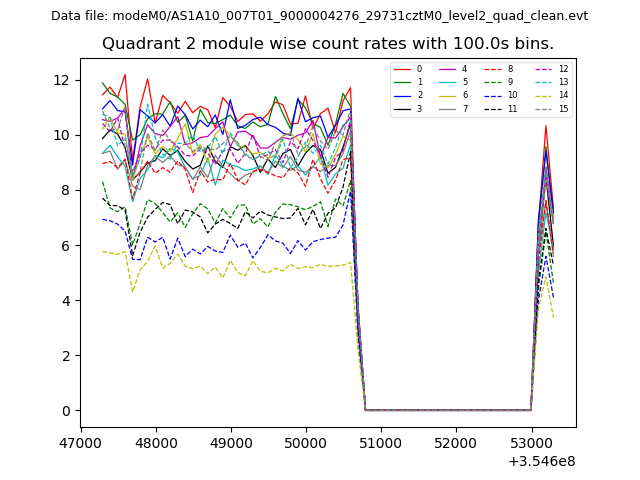
| Module-wise count rates for Quadrant B Data is divided into 100 sec bins |
 |
 |
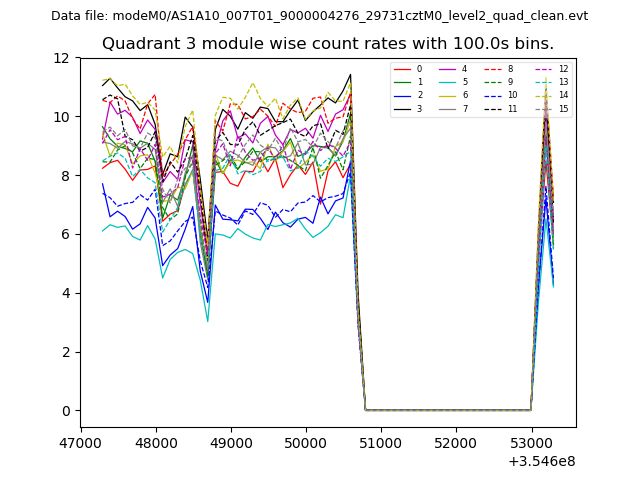
| Module-wise count rates for Quadrant C Data is divided into 100 sec bins |
 |
 |
| Module-wise count rates for Quadrant D Data is divided into 100 sec bins |
 |
 |
| Parameter | Plot |
|---|---|
| CZT HV Monitor | 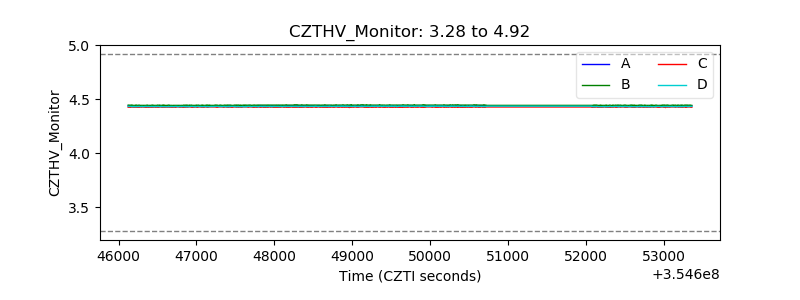 |
| D_VDD | 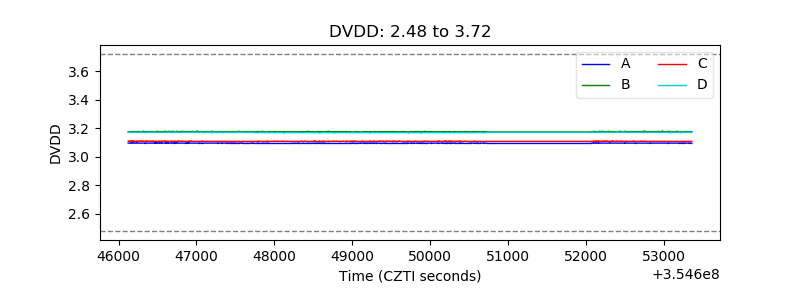 |
| Temperature 1 | 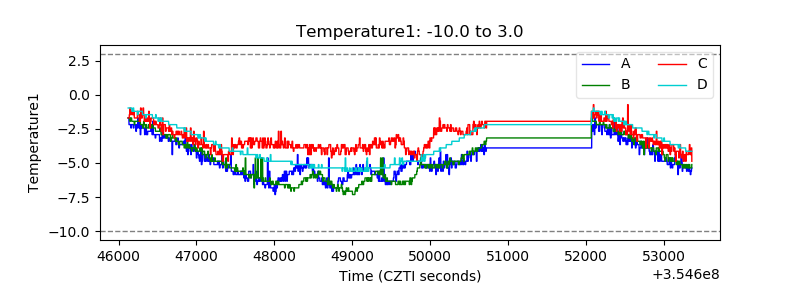 |
| Veto HV Monitor | 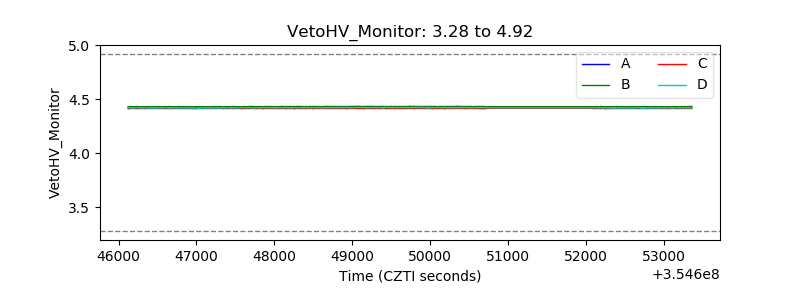 |
| Veto LLD | 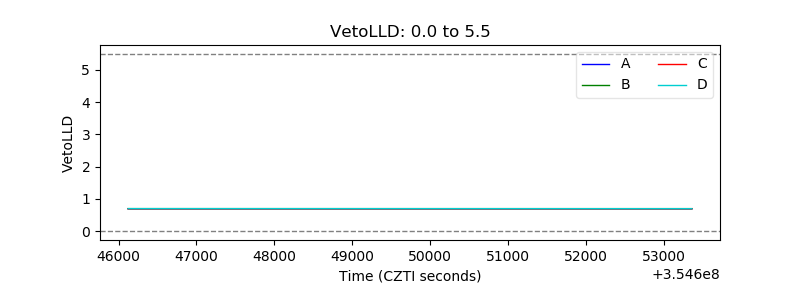 |
| Alpha Counter | 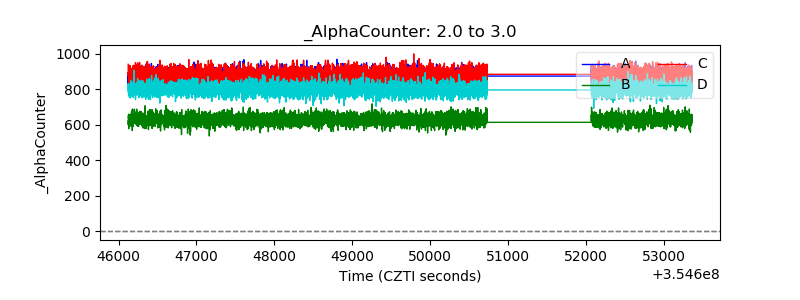 |
| _CPM_Rate | 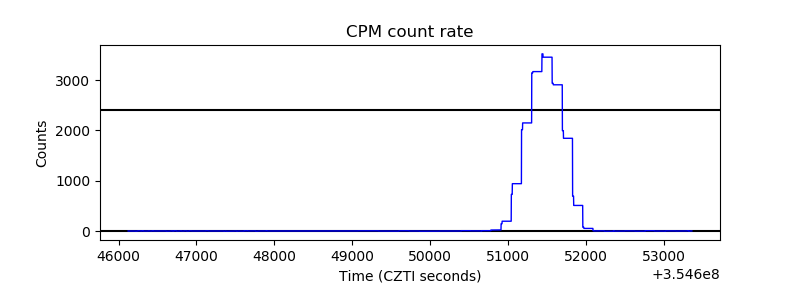 |
| CZT Counter | 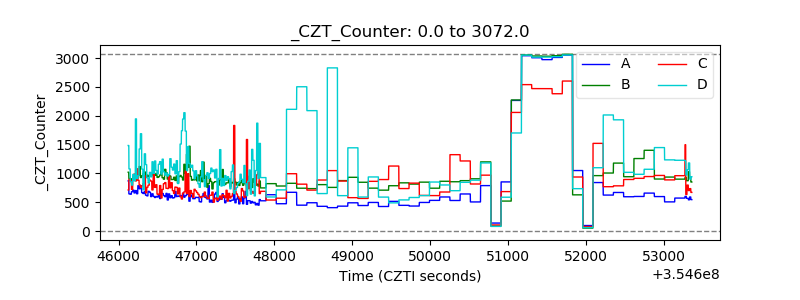 |
| +2.5 Volts monitor |  |
| +5 Volts monitor |  |
| _ROLL_ROT | 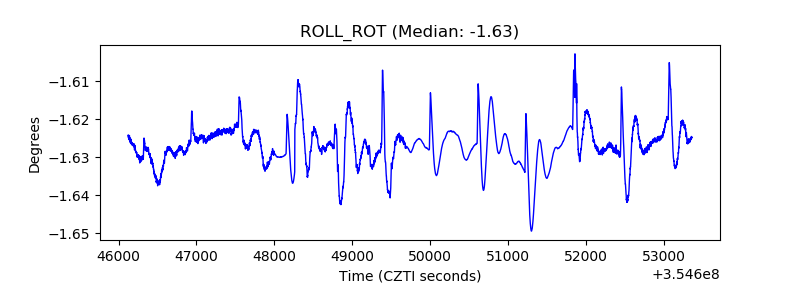 |
| _Roll_DEC | 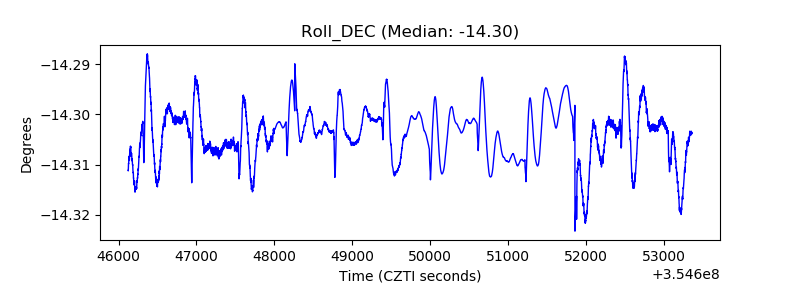 |
| _Roll_RA | 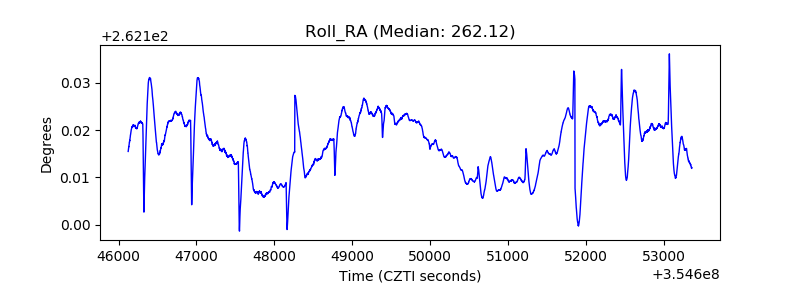 |
| Veto Counter |  |