| Param | Original file | Final file |
|---|---|---|
| Filename | modeM0/AS1A10_007T01_9000004276_29732cztM0_level2.evt | modeM0/AS1A10_007T01_9000004276_29732cztM0_level2_quad_clean.evt |
| Size (bytes) | 652,248,000 | 94,916,160 |
| Size | 622.0 MB | 90.5 MB |
| Events in quadrant A | 3,097,274 | 637,097 |
| Events in quadrant B | 5,030,003 | 648,233 |
| Events in quadrant C | 5,190,398 | 597,019 |
| Events in quadrant D | 6,040,371 | 582,263 |
| Mode SS | |||
|---|---|---|---|
| Quadrant | BADHDUFLAG | Total packets | Discarded packets |
| A | 0 | 118 | 0 |
| B | 0 | 118 | 0 |
| C | 0 | 118 | 0 |
| D | 0 | 118 | 0 |
| Mode M0 | |||
|---|---|---|---|
| Quadrant | BADHDUFLAG | Total packets | Discarded packets |
| A | 0 | 12722 | 1 |
| B | 0 | 18619 | 1 |
| C | 0 | 19729 | 1 |
| D | 0 | 22215 | 1 |
| Mode M9 | |||
|---|---|---|---|
| Quadrant | BADHDUFLAG | Total packets | Discarded packets |
| A | 0 | 14 | 0 |
| B | 0 | 14 | 0 |
| C | 0 | 14 | 0 |
| D | 0 | 14 | 0 |
| Quadrant | Total seconds | Saturated seconds | Saturation percentage |
|---|---|---|---|
| A | 5867 | 59 | 1.005625% |
| B | 5868 | 141 | 2.402863% |
| C | 5867 | 717 | 12.220897% |
| D | 5867 | 314 | 5.351969% |
Noise dominated data is calculated using 1-second bins in cleaned event files. If a bin has >2000 counts, and if more than 50% of those come from <1% of pixels, then it is considered to be noise-dominated and hence unusable.
| Quadrant | # 1 sec bins | Bins with >0 counts | Bins with >2000 counts | High rate bins dominated by noise | Noise dominated (total time) | Noise dominated (detector-on time) | Marked lightcurve |
|---|---|---|---|---|---|---|---|
| A | 7182 | 5867 | 0 | 0 | 0.00% | 0.00% | 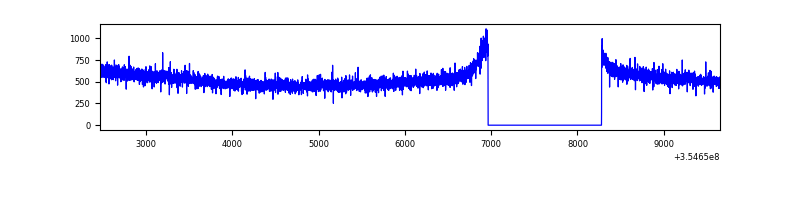 |
| B | 7183 | 5868 | 0 | 0 | 0.00% | 0.00% | 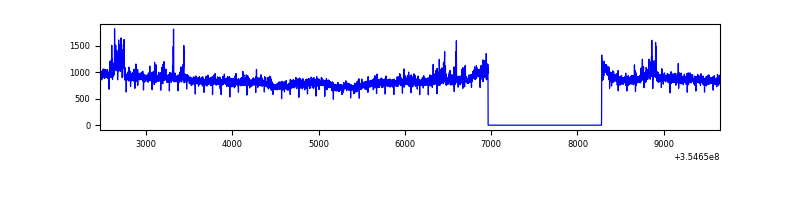 |
| C | 7182 | 5867 | 39 | 39 | 0.54% | 0.66% | 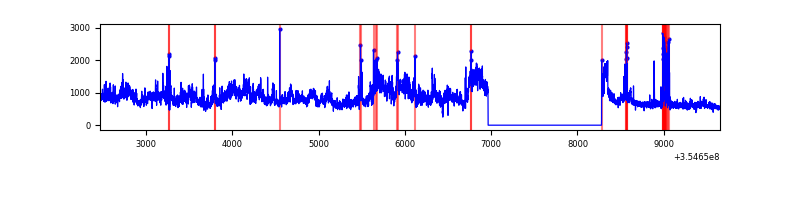 |
| D | 7182 | 5867 | 279 | 279 | 3.88% | 4.76% | 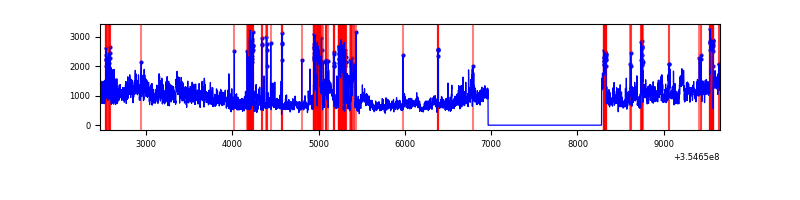 |
Top three noisy pixels from each quadrant. If the there are fewer than three noisy pixels in the level2.evt file, extra rows are filled as -1
| Pixel properties | Quadrant properties | ||||||
|---|---|---|---|---|---|---|---|
| Quadrant | DetID | PixID | Counts | Sigma | Mean | Median | Sigma |
| A | 13 | 254 | 11202 | 65.53 | 802 | 788 | 158.9 |
| A | 3 | 137 | 7462 | 42.0 | 802 | 788 | 158.9 |
| A | 0 | 226 | 6761 | 37.59 | 802 | 788 | 158.9 |
| B | 6 | 159 | 1777211 | 11919.56 | 801 | 784 | 149.0 |
| B | 15 | 32 | 44209 | 291.38 | 801 | 784 | 149.0 |
| B | 0 | 229 | 22117 | 143.14 | 801 | 784 | 149.0 |
| C | 3 | 233 | 1830961 | 10700.18 | 743 | 751 | 171.0 |
| C | 14 | 238 | 212443 | 1237.64 | 743 | 751 | 171.0 |
| C | 14 | 254 | 129640 | 753.54 | 743 | 751 | 171.0 |
| D | 8 | 195 | 2128475 | 11676.24 | 763 | 746 | 182.2 |
| D | 7 | 80 | 744237 | 4080.02 | 763 | 746 | 182.2 |
| D | 13 | 104 | 186424 | 1018.94 | 763 | 746 | 182.2 |
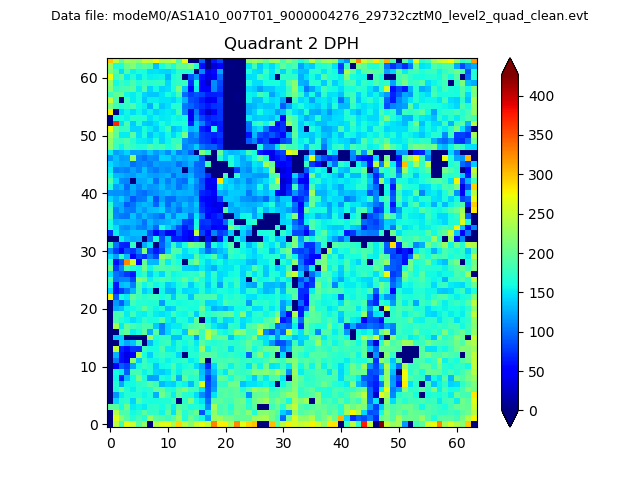
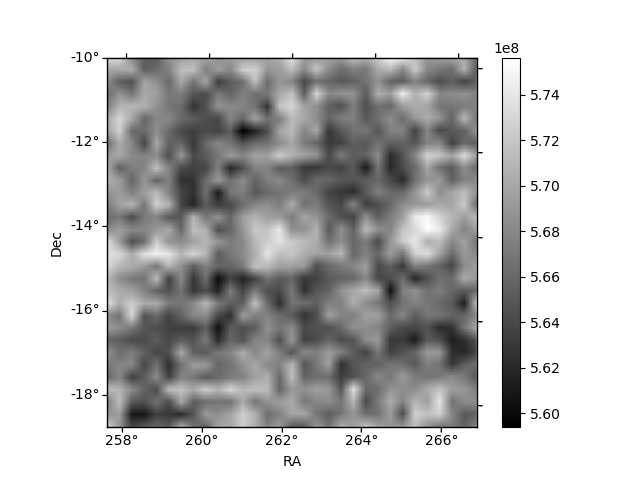
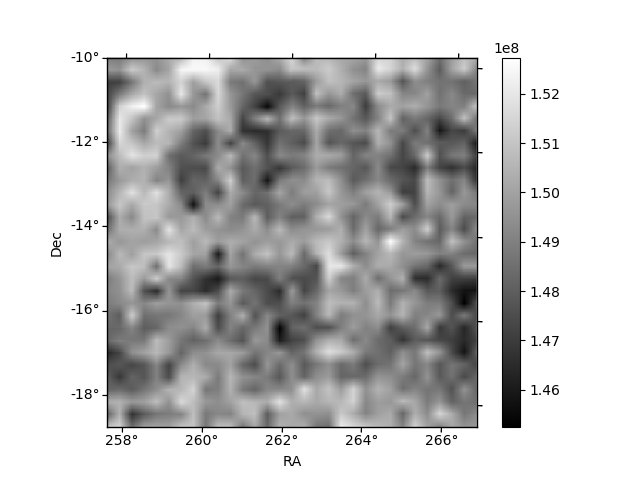
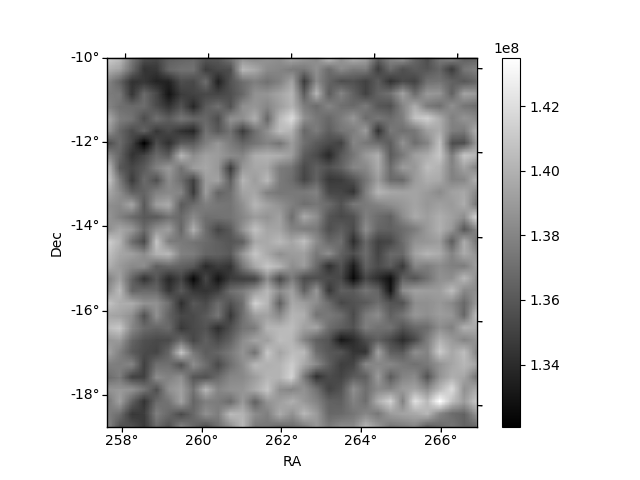
Histogram calculated using DETX and DETY for each event in the final _common_clean file
| Quadrant A | 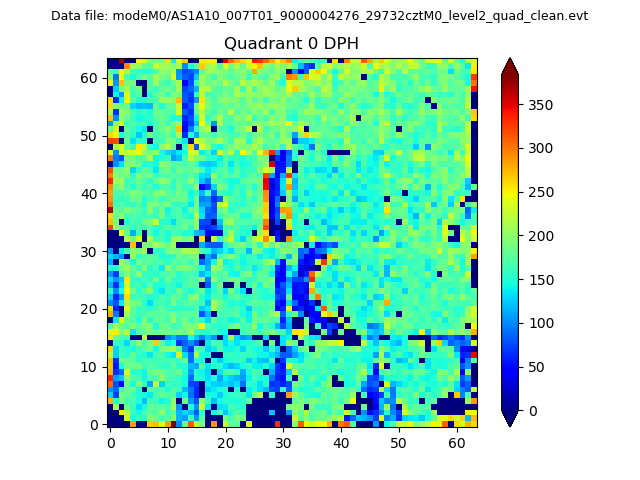 |
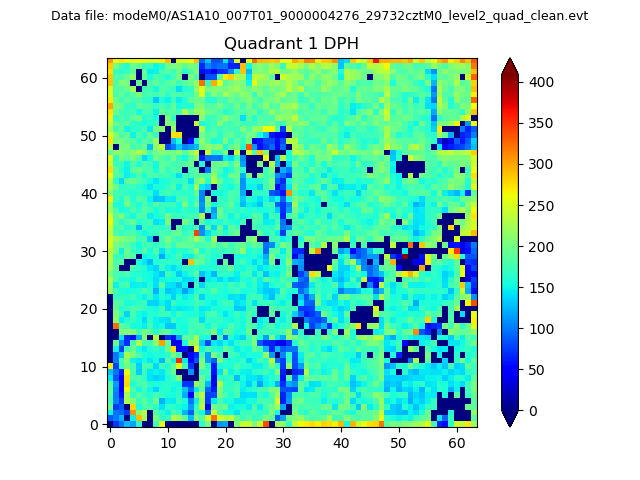 |
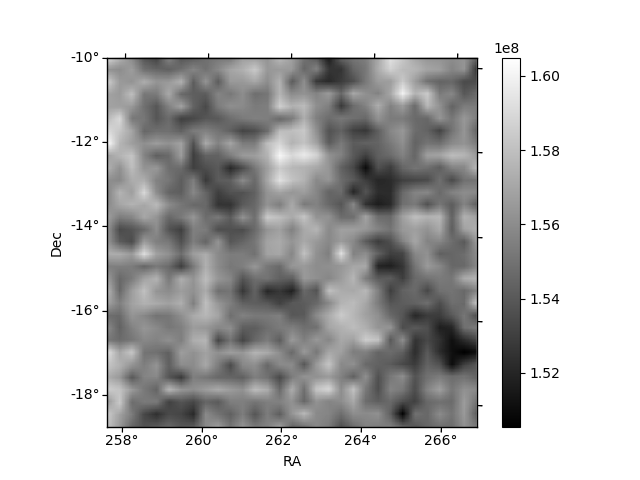
Quadrant B |
|---|---|---|---|
| Quadrant D | 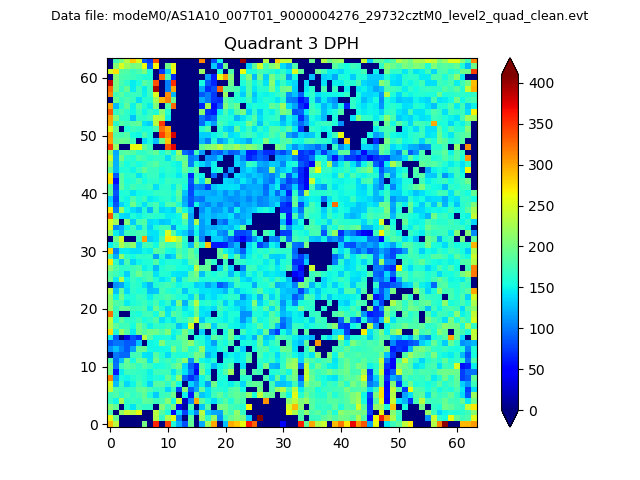 |
 |
Quadrant C |
| Plot type | Count rate plots | Images |
|---|---|---|
| Comparison with Poisson distribution Blue bars denote a histogram of data divided into 1 sec bins. Red curve is a Poisson curve with rate = median count rate of data. |
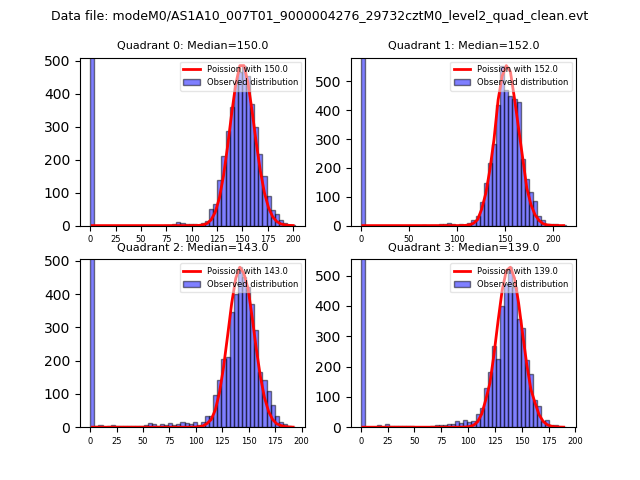 |
 |
| Quadrant-wise count rates Data is divided into 100 sec bins |
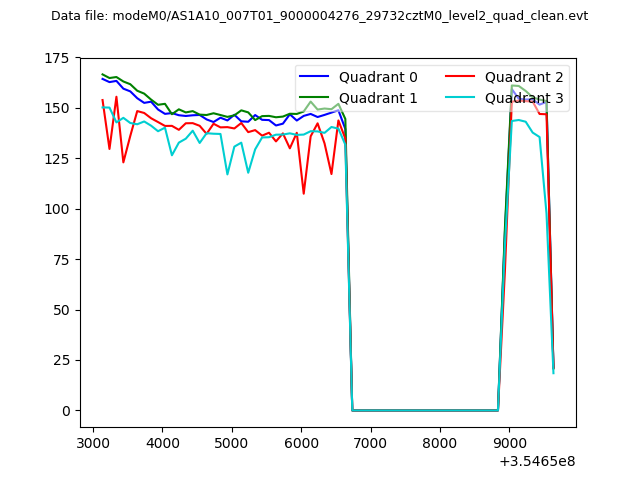 |
|
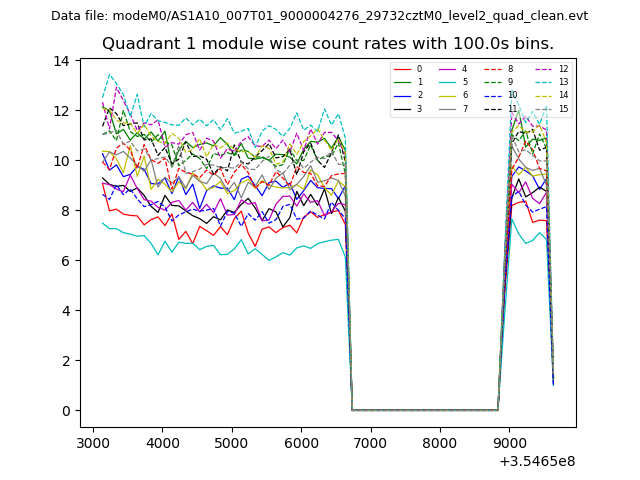
| Module-wise count rates for Quadrant A Data is divided into 100 sec bins |
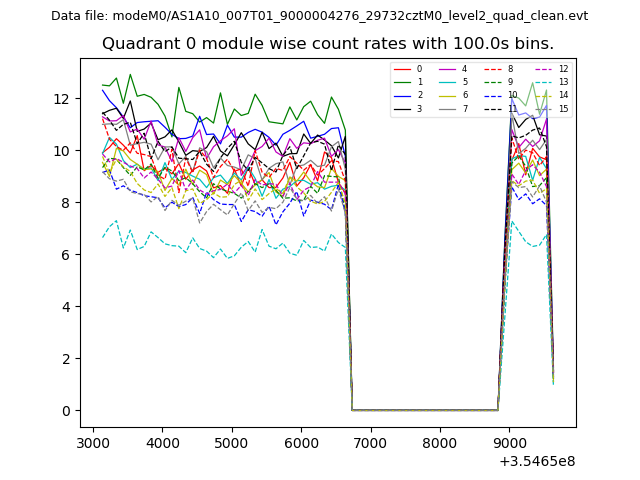 |
 |
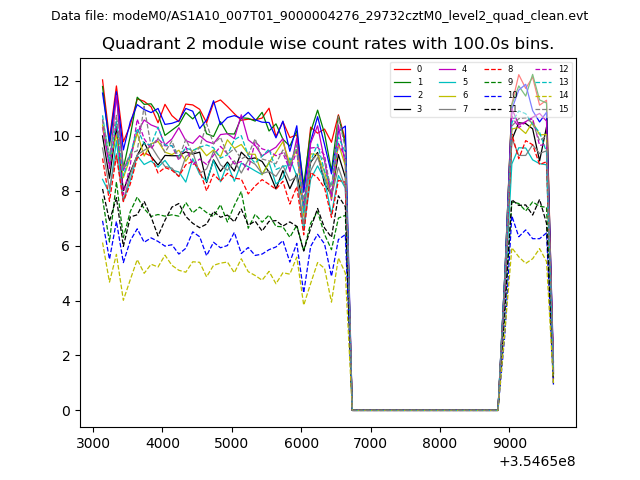
| Module-wise count rates for Quadrant B Data is divided into 100 sec bins |
 |
 |
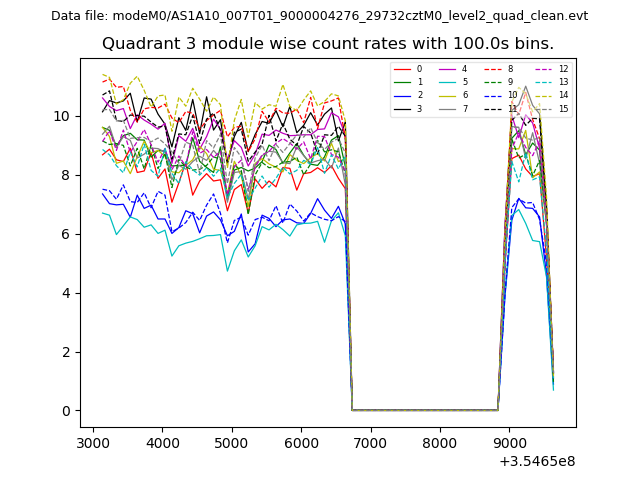
| Module-wise count rates for Quadrant C Data is divided into 100 sec bins |
 |
 |
| Module-wise count rates for Quadrant D Data is divided into 100 sec bins |
 |
 |
| Parameter | Plot |
|---|---|
| CZT HV Monitor | 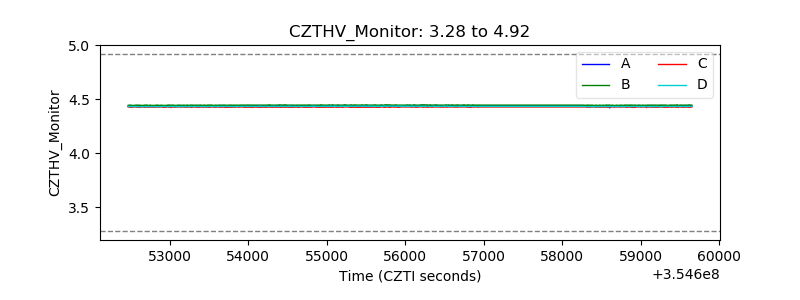 |
| D_VDD | 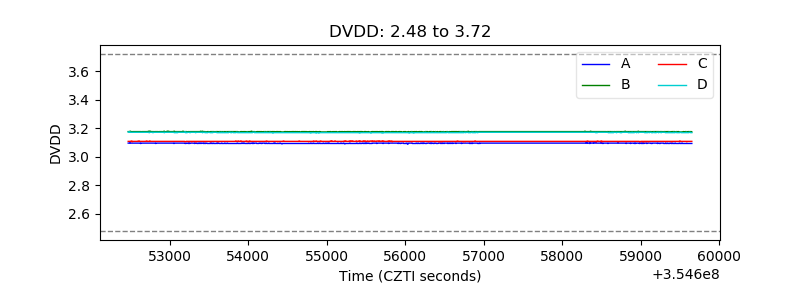 |
| Temperature 1 | 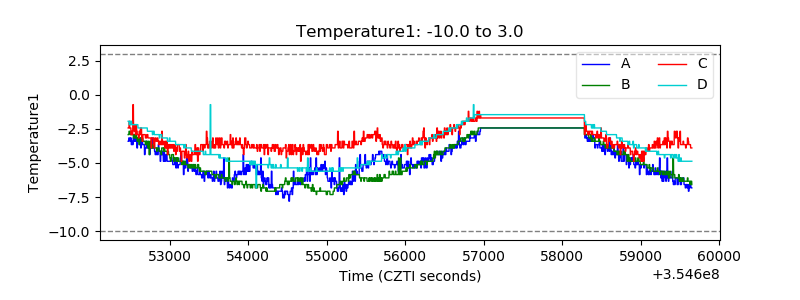 |
| Veto HV Monitor | 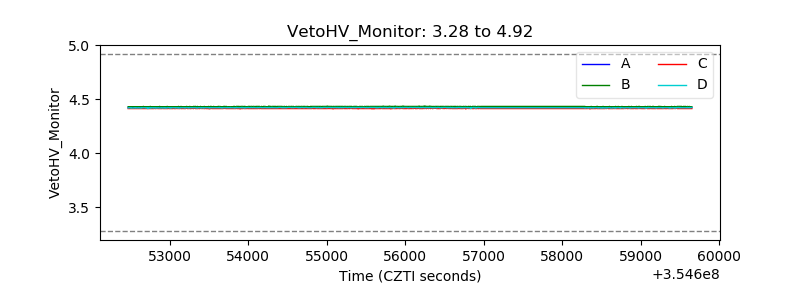 |
| Veto LLD | 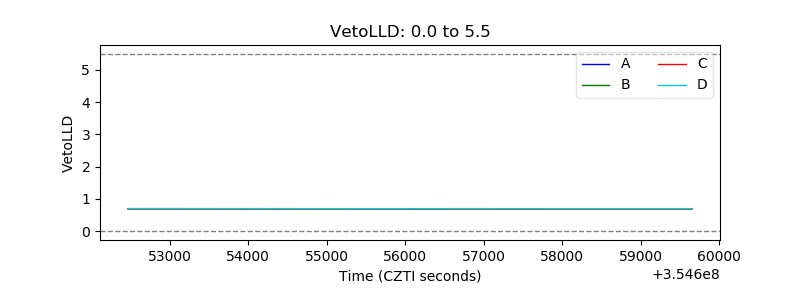 |
| Alpha Counter | 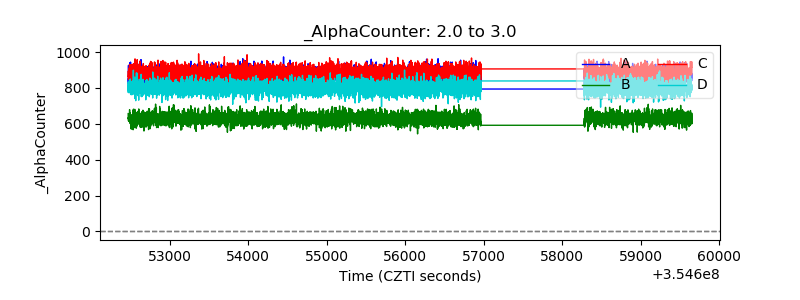 |
| _CPM_Rate | 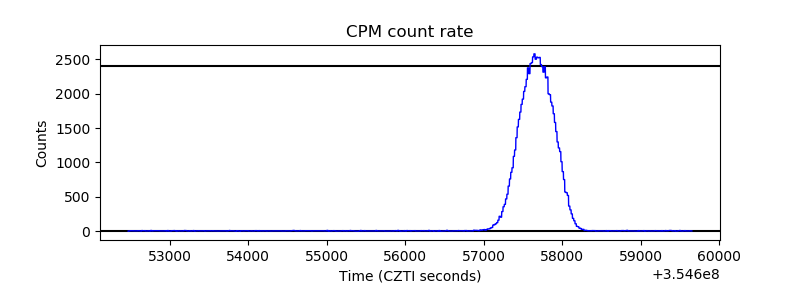 |
| CZT Counter | 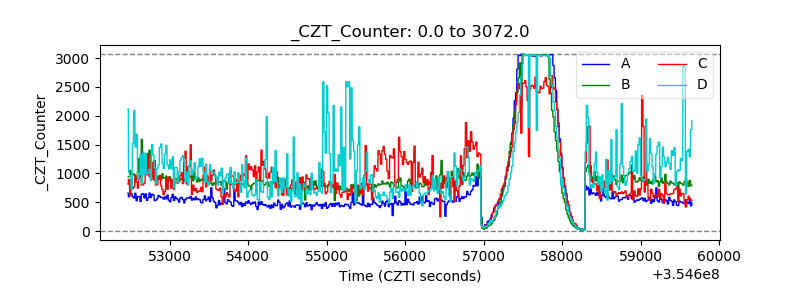 |
| +2.5 Volts monitor |  |
| +5 Volts monitor |  |
| _ROLL_ROT | 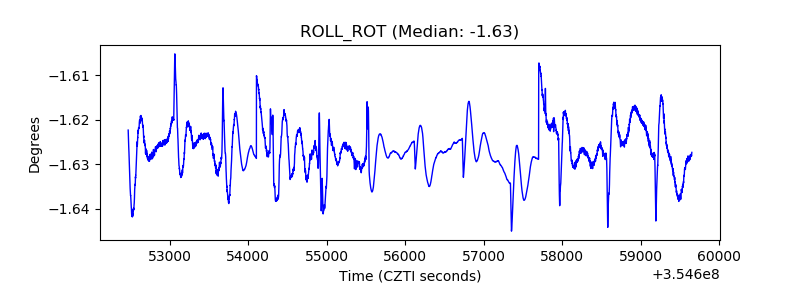 |
| _Roll_DEC | 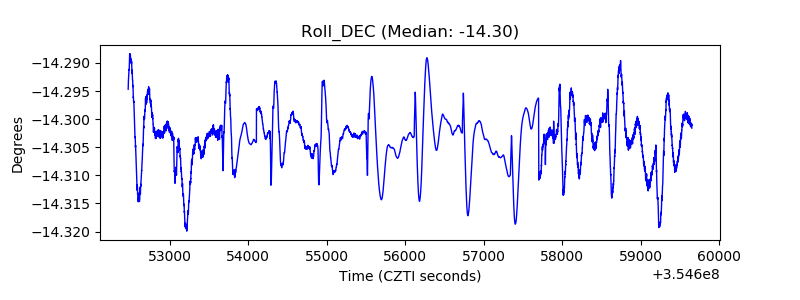 |
| _Roll_RA | 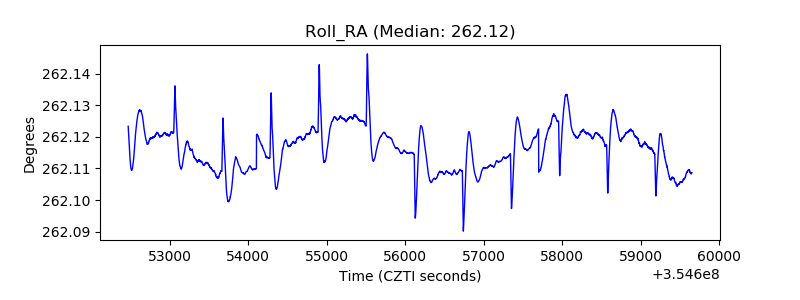 |
| Veto Counter | 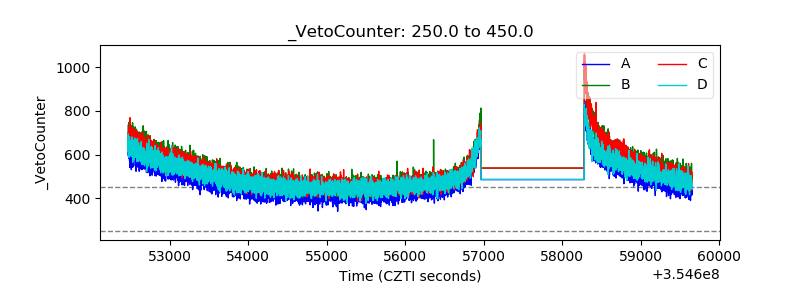 |