| Param | Original file | Final file |
|---|---|---|
| Filename | modeM0/AS1A10_007T01_9000004276_29733cztM0_level2.evt | modeM0/AS1A10_007T01_9000004276_29733cztM0_level2_quad_clean.evt |
| Size (bytes) | 666,864,000 | 101,033,280 |
| Size | 636.0 MB | 96.4 MB |
| Events in quadrant A | 3,320,487 | 670,321 |
| Events in quadrant B | 5,345,707 | 679,182 |
| Events in quadrant C | 4,818,142 | 648,212 |
| Events in quadrant D | 6,277,938 | 613,348 |
| Mode SS | |||
|---|---|---|---|
| Quadrant | BADHDUFLAG | Total packets | Discarded packets |
| A | 0 | 130 | 0 |
| B | 0 | 130 | 0 |
| C | 0 | 130 | 0 |
| D | 0 | 130 | 0 |
| Mode M0 | |||
|---|---|---|---|
| Quadrant | BADHDUFLAG | Total packets | Discarded packets |
| A | 0 | 13829 | 2 |
| B | 0 | 20090 | 2 |
| C | 0 | 18841 | 2 |
| D | 0 | 23340 | 4 |
| Mode M9 | |||
|---|---|---|---|
| Quadrant | BADHDUFLAG | Total packets | Discarded packets |
| A | 0 | 17 | 0 |
| B | 0 | 18 | 0 |
| C | 0 | 18 | 0 |
| D | 0 | 18 | 0 |
| Quadrant | Total seconds | Saturated seconds | Saturation percentage |
|---|---|---|---|
| A | 6433 | 66 | 1.025960% |
| B | 6433 | 183 | 2.844707% |
| C | 6433 | 448 | 6.964091% |
| D | 6432 | 353 | 5.488184% |
Noise dominated data is calculated using 1-second bins in cleaned event files. If a bin has >2000 counts, and if more than 50% of those come from <1% of pixels, then it is considered to be noise-dominated and hence unusable.
| Quadrant | # 1 sec bins | Bins with >0 counts | Bins with >2000 counts | High rate bins dominated by noise | Noise dominated (total time) | Noise dominated (detector-on time) | Marked lightcurve |
|---|---|---|---|---|---|---|---|
| A | 7628 | 6433 | 0 | 0 | 0.00% | 0.00% | 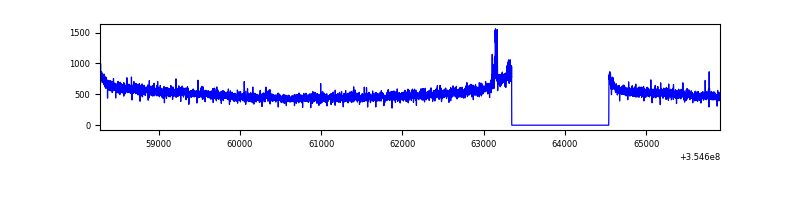 |
| B | 7628 | 6433 | 11 | 11 | 0.14% | 0.17% | 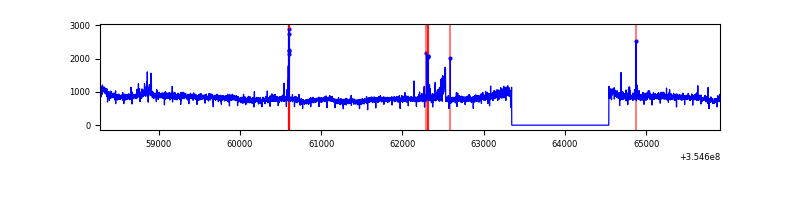 |
| C | 7628 | 6433 | 50 | 50 | 0.66% | 0.78% | 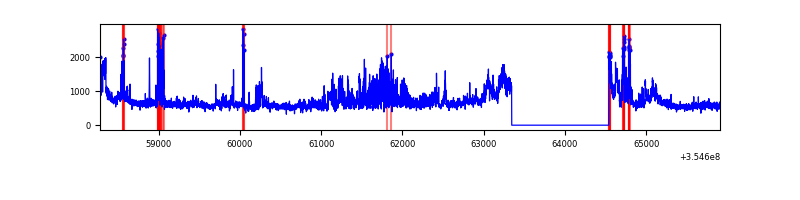 |
| D | 7627 | 6433 | 235 | 235 | 3.08% | 3.65% | 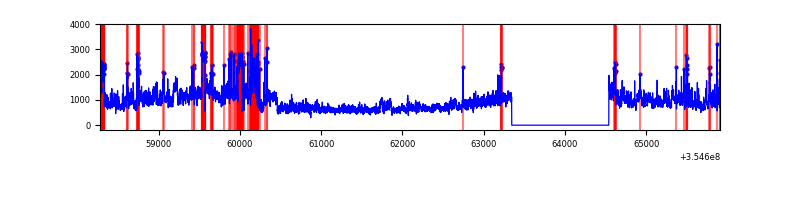 |
Top three noisy pixels from each quadrant. If the there are fewer than three noisy pixels in the level2.evt file, extra rows are filled as -1
| Pixel properties | Quadrant properties | ||||||
|---|---|---|---|---|---|---|---|
| Quadrant | DetID | PixID | Counts | Sigma | Mean | Median | Sigma |
| A | 12 | 16 | 29403 | 167.65 | 852 | 836 | 170.4 |
| A | 13 | 254 | 12180 | 66.57 | 852 | 836 | 170.4 |
| A | 12 | 194 | 10685 | 57.8 | 852 | 836 | 170.4 |
| B | 6 | 159 | 1898738 | 11683.73 | 850 | 829 | 162.4 |
| B | 0 | 190 | 43344 | 261.73 | 850 | 829 | 162.4 |
| B | 0 | 229 | 25069 | 149.22 | 850 | 829 | 162.4 |
| C | 3 | 233 | 1355866 | 7188.33 | 810 | 819 | 188.5 |
| C | 14 | 238 | 149541 | 788.95 | 810 | 819 | 188.5 |
| C | 10 | 22 | 83431 | 438.24 | 810 | 819 | 188.5 |
| D | 8 | 195 | 1831324 | 9559.41 | 809 | 791 | 191.5 |
| D | 13 | 104 | 557591 | 2907.72 | 809 | 791 | 191.5 |
| D | 7 | 80 | 405904 | 2115.58 | 809 | 791 | 191.5 |
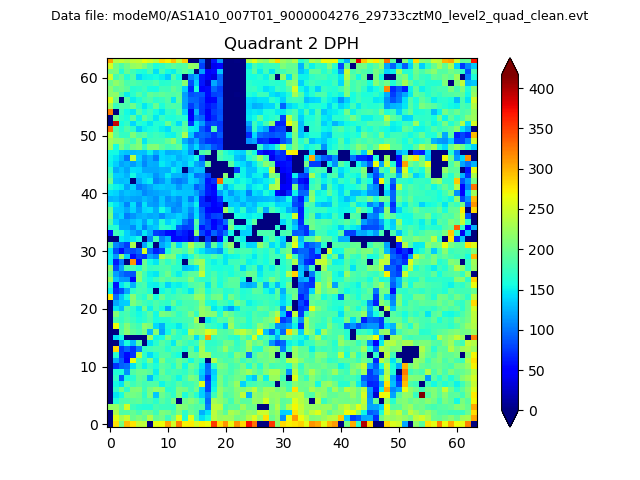
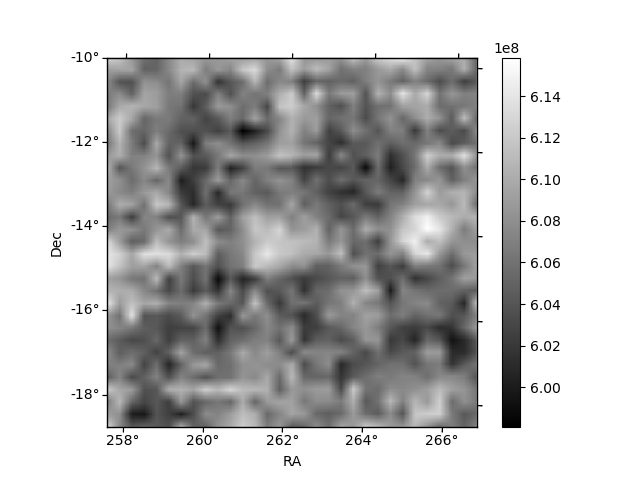
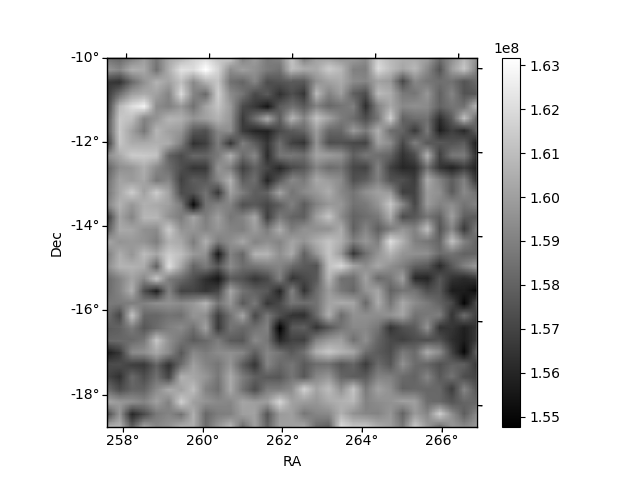
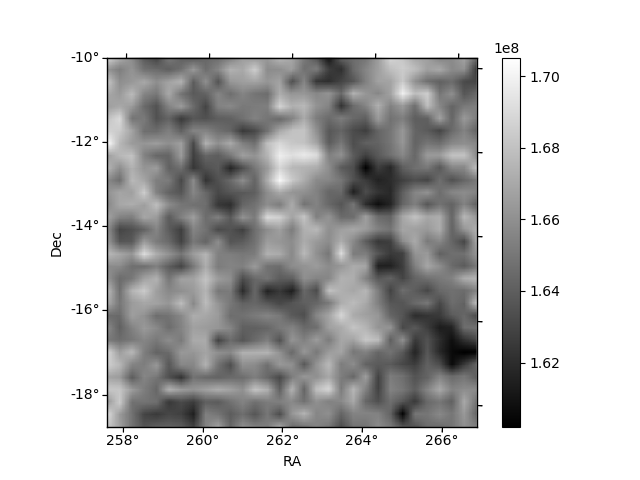
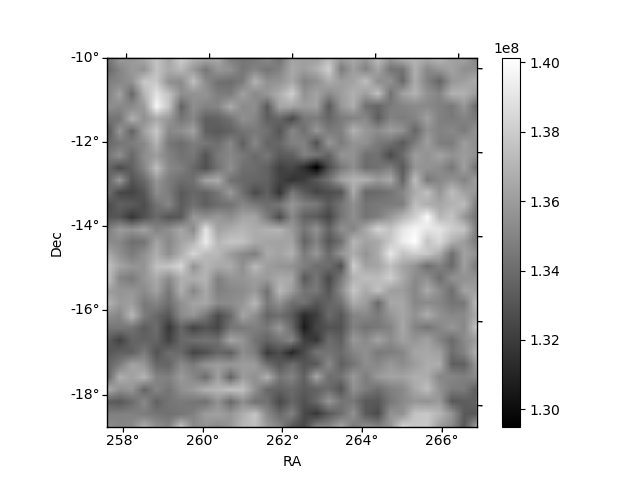
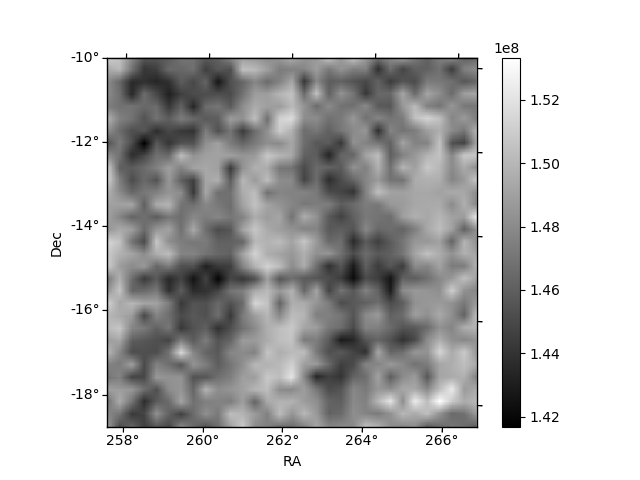
Histogram calculated using DETX and DETY for each event in the final _common_clean file
| Quadrant A | 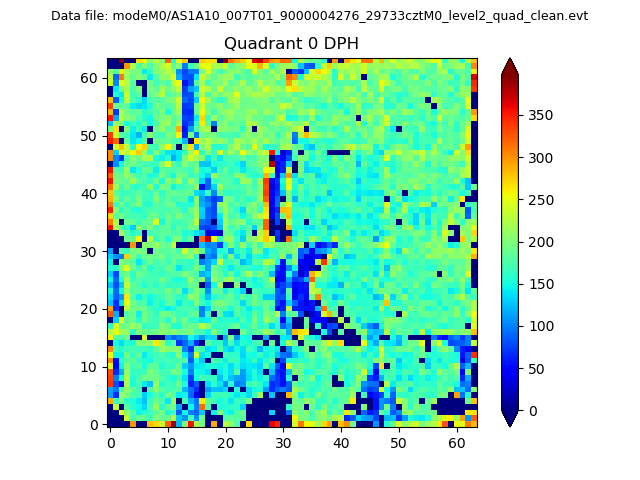 |
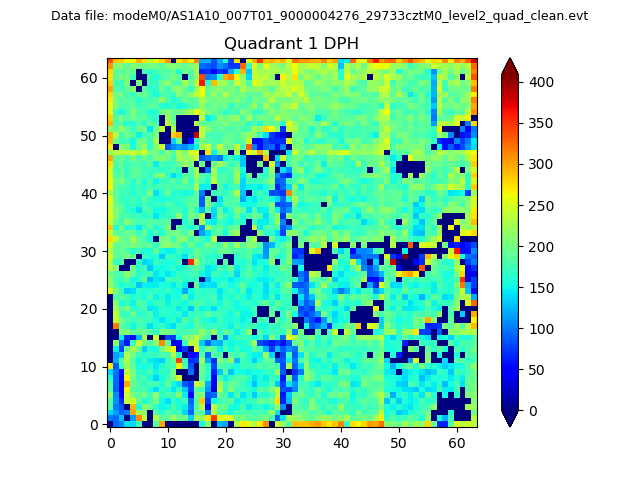 |
Quadrant B |
|---|---|---|---|
| Quadrant D | 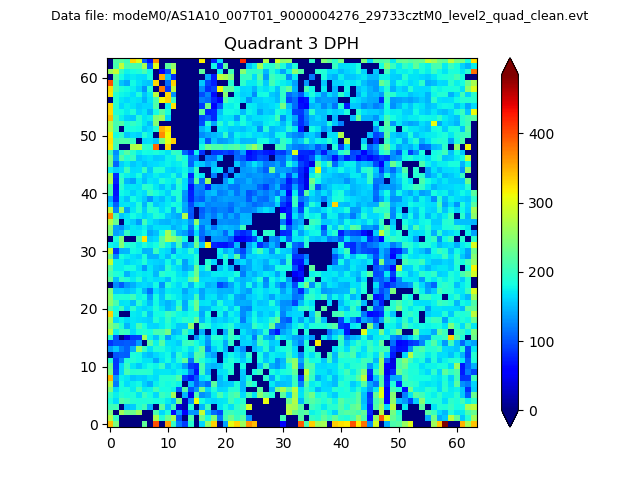 |
 |
Quadrant C |
| Plot type | Count rate plots | Images |
|---|---|---|
| Comparison with Poisson distribution Blue bars denote a histogram of data divided into 1 sec bins. Red curve is a Poisson curve with rate = median count rate of data. |
 |
 |
| Quadrant-wise count rates Data is divided into 100 sec bins |
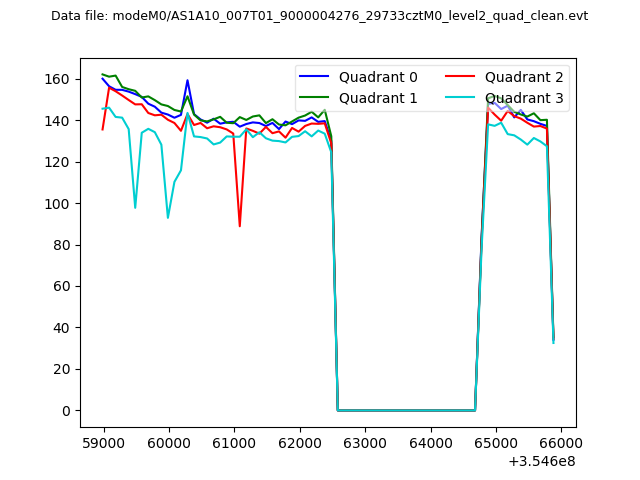 |
|
| Module-wise count rates for Quadrant A Data is divided into 100 sec bins |
 |
 |
| Module-wise count rates for Quadrant B Data is divided into 100 sec bins |
 |
 |
| Module-wise count rates for Quadrant C Data is divided into 100 sec bins |
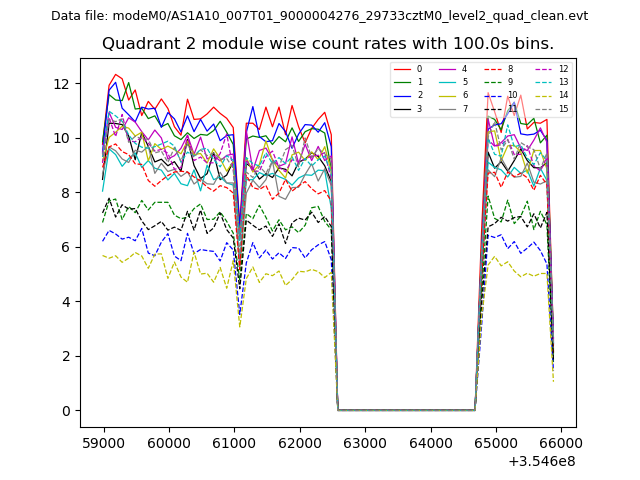 |
 |
| Module-wise count rates for Quadrant D Data is divided into 100 sec bins |
 |
 |
| Parameter | Plot |
|---|---|
| CZT HV Monitor | 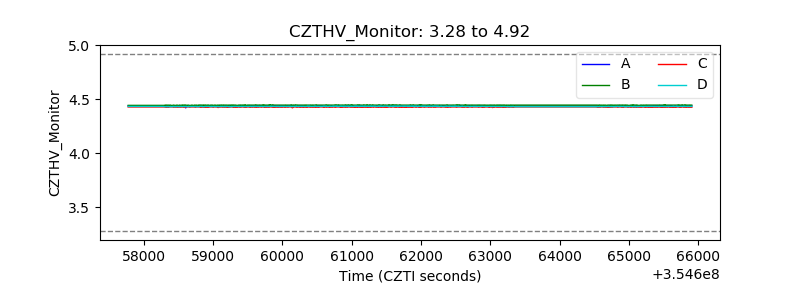 |
| D_VDD | 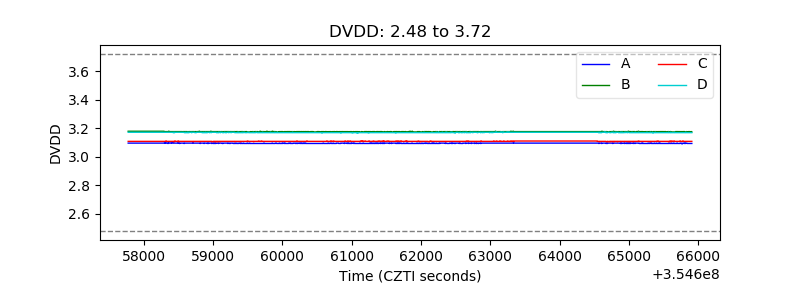 |
| Temperature 1 | 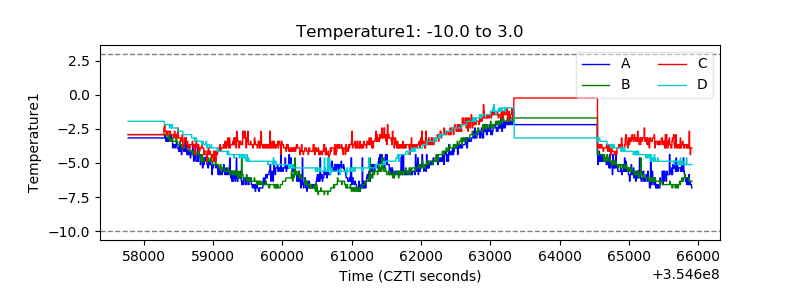 |
| Veto HV Monitor | 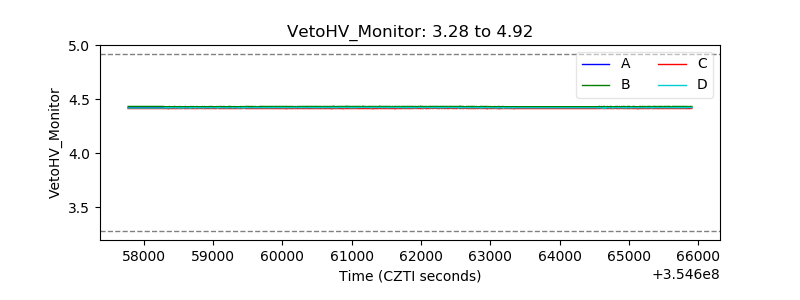 |
| Veto LLD | 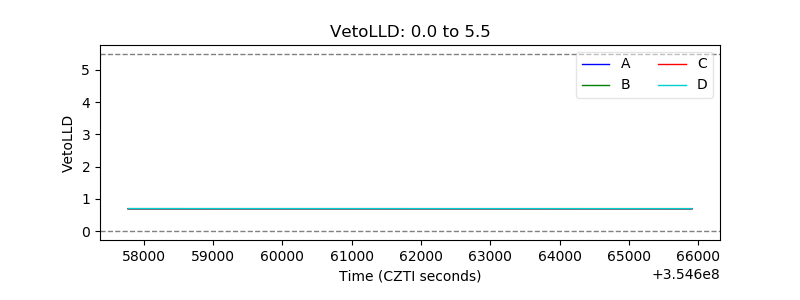 |
| Alpha Counter | 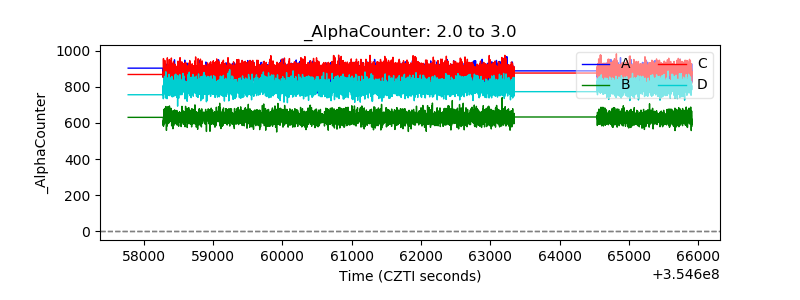 |
| _CPM_Rate | 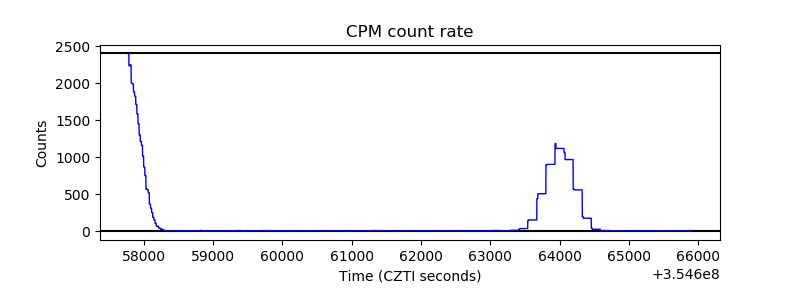 |
| CZT Counter | 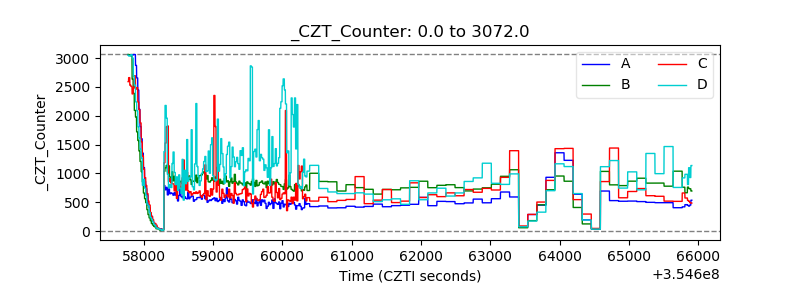 |
| +2.5 Volts monitor |  |
| +5 Volts monitor |  |
| _ROLL_ROT |  |
| _Roll_DEC |  |
| _Roll_RA | 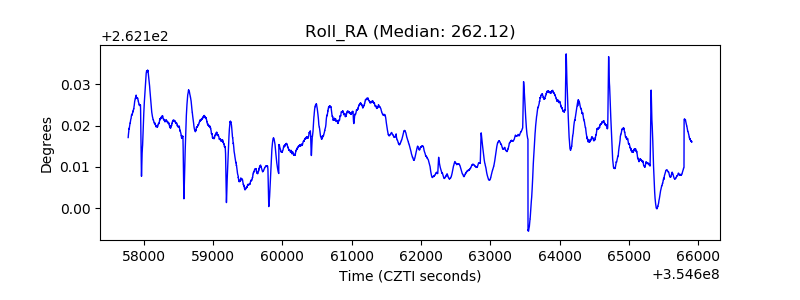 |
| Veto Counter | 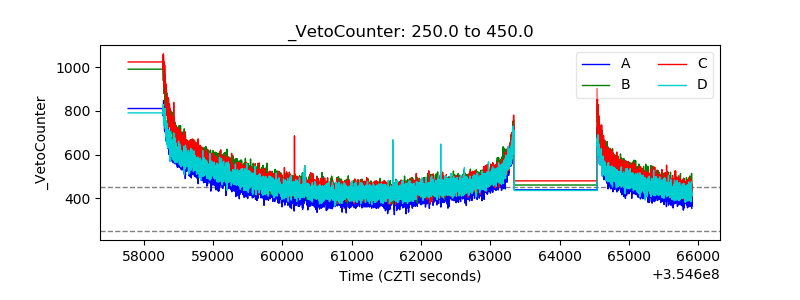 |