| Param | Original file | Final file |
|---|---|---|
| Filename | modeM0/AS1A10_007T01_9000004276_29734cztM0_level2.evt | modeM0/AS1A10_007T01_9000004276_29734cztM0_level2_quad_clean.evt |
| Size (bytes) | 688,680,000 | 102,000,960 |
| Size | 656.8 MB | 97.3 MB |
| Events in quadrant A | 3,256,447 | 672,276 |
| Events in quadrant B | 5,549,207 | 680,383 |
| Events in quadrant C | 5,140,447 | 644,192 |
| Events in quadrant D | 6,460,112 | 626,367 |
| Mode SS | |||
|---|---|---|---|
| Quadrant | BADHDUFLAG | Total packets | Discarded packets |
| A | 0 | 136 | 0 |
| B | 0 | 136 | 0 |
| C | 0 | 136 | 0 |
| D | 0 | 136 | 0 |
| Mode M0 | |||
|---|---|---|---|
| Quadrant | BADHDUFLAG | Total packets | Discarded packets |
| A | 0 | 13886 | 2 |
| B | 0 | 21107 | 3 |
| C | 0 | 19505 | 2 |
| D | 0 | 23938 | 2 |
| Mode M9 | |||
|---|---|---|---|
| Quadrant | BADHDUFLAG | Total packets | Discarded packets |
| A | 0 | 10 | 0 |
| B | 0 | 11 | 0 |
| C | 0 | 11 | 0 |
| D | 0 | 11 | 0 |
| Quadrant | Total seconds | Saturated seconds | Saturation percentage |
|---|---|---|---|
| A | 6679 | 21 | 0.314418% |
| B | 6678 | 256 | 3.833483% |
| C | 6678 | 449 | 6.723570% |
| D | 6678 | 425 | 6.364181% |
Noise dominated data is calculated using 1-second bins in cleaned event files. If a bin has >2000 counts, and if more than 50% of those come from <1% of pixels, then it is considered to be noise-dominated and hence unusable.
| Quadrant | # 1 sec bins | Bins with >0 counts | Bins with >2000 counts | High rate bins dominated by noise | Noise dominated (total time) | Noise dominated (detector-on time) | Marked lightcurve |
|---|---|---|---|---|---|---|---|
| A | 7609 | 6680 | 0 | 0 | 0.00% | 0.00% | 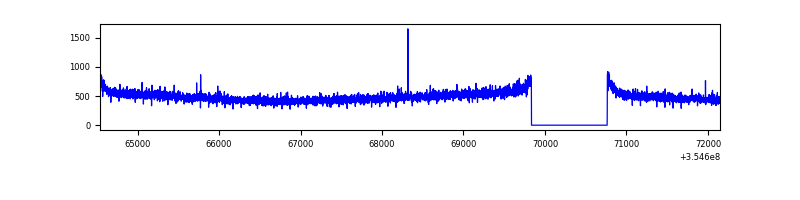 |
| B | 7608 | 6678 | 49 | 49 | 0.64% | 0.73% | 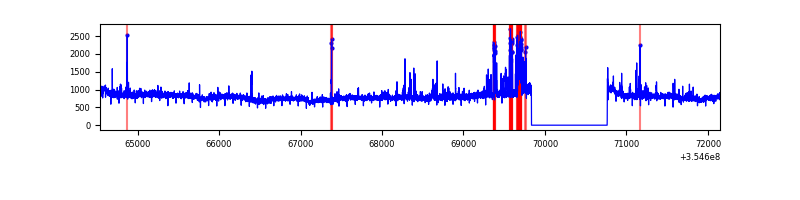 |
| C | 7608 | 6679 | 277 | 277 | 3.64% | 4.15% | 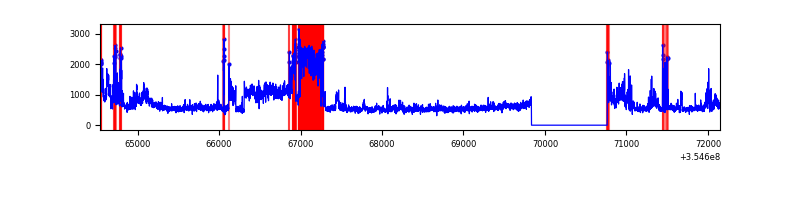 |
| D | 7608 | 6678 | 318 | 318 | 4.18% | 4.76% | 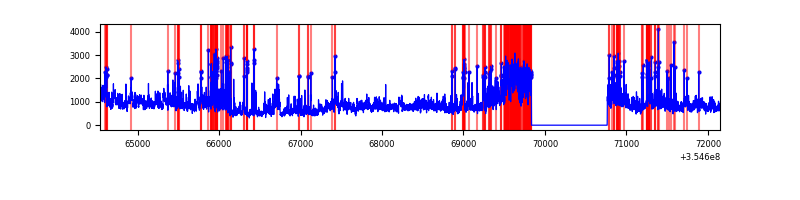 |
Top three noisy pixels from each quadrant. If the there are fewer than three noisy pixels in the level2.evt file, extra rows are filled as -1
| Pixel properties | Quadrant properties | ||||||
|---|---|---|---|---|---|---|---|
| Quadrant | DetID | PixID | Counts | Sigma | Mean | Median | Sigma |
| A | 12 | 16 | 17386 | 97.75 | 838 | 820 | 169.5 |
| A | 13 | 254 | 12956 | 71.61 | 838 | 820 | 169.5 |
| A | 12 | 194 | 8661 | 46.27 | 838 | 820 | 169.5 |
| B | 6 | 159 | 1950065 | 12187.19 | 833 | 811 | 159.9 |
| B | 0 | 229 | 295398 | 1841.83 | 833 | 811 | 159.9 |
| B | 12 | 111 | 19668 | 117.9 | 833 | 811 | 159.9 |
| C | 3 | 233 | 1803743 | 9585.77 | 802 | 808 | 188.1 |
| C | 14 | 238 | 131930 | 697.14 | 802 | 808 | 188.1 |
| C | 10 | 22 | 34429 | 178.75 | 802 | 808 | 188.1 |
| D | 8 | 195 | 2012734 | 10532.56 | 797 | 778 | 191.0 |
| D | 7 | 80 | 967181 | 5059.1 | 797 | 778 | 191.0 |
| D | 7 | 223 | 347870 | 1817.02 | 797 | 778 | 191.0 |
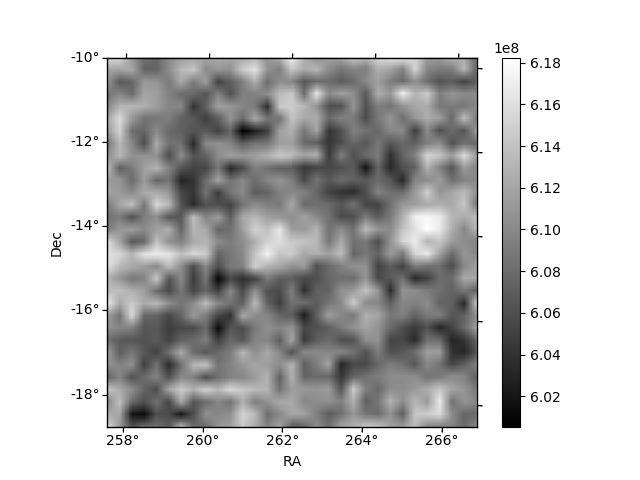
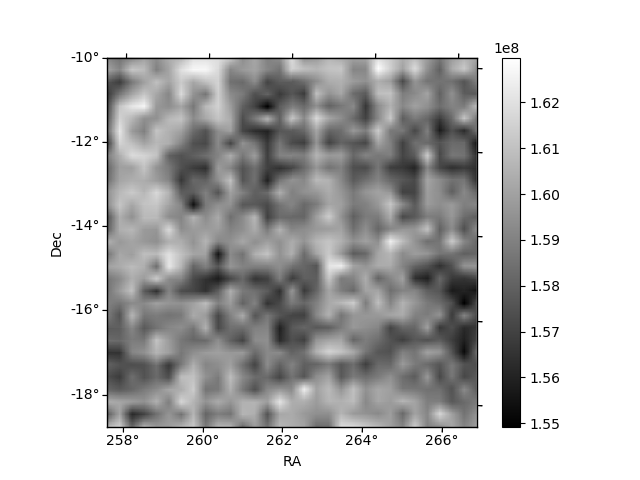
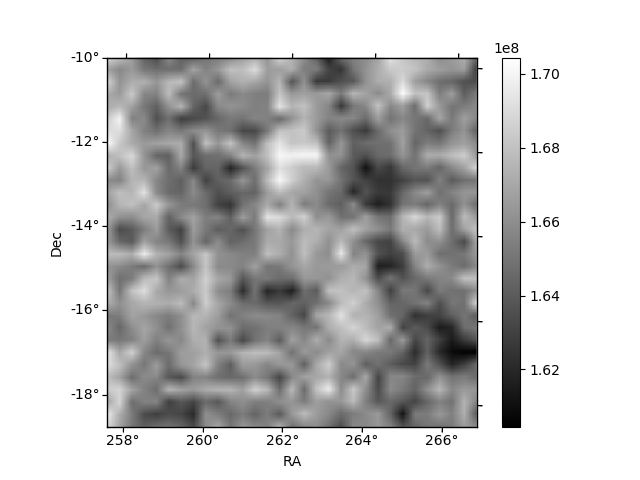
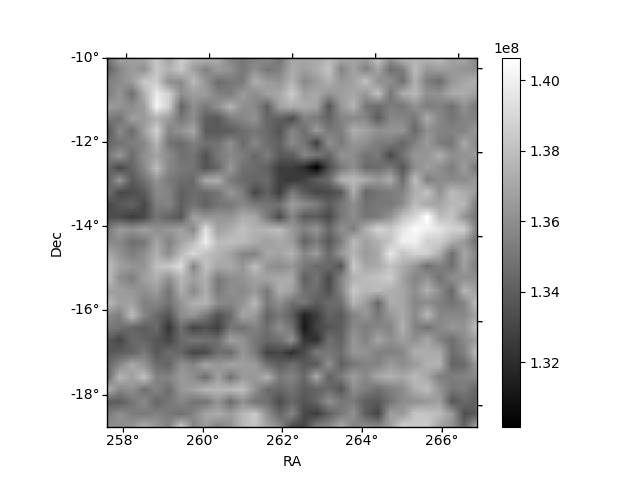
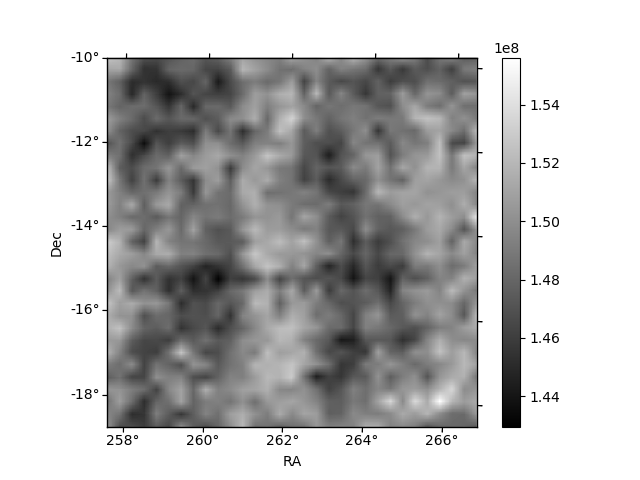
Histogram calculated using DETX and DETY for each event in the final _common_clean file
| Quadrant A | 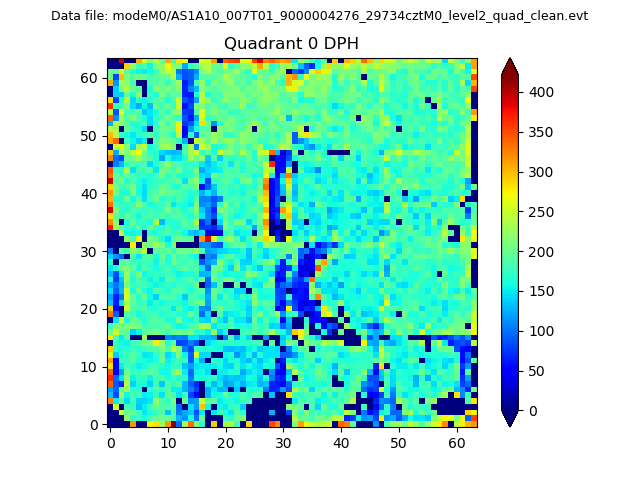 |
 |
Quadrant B |
|---|---|---|---|
| Quadrant D | 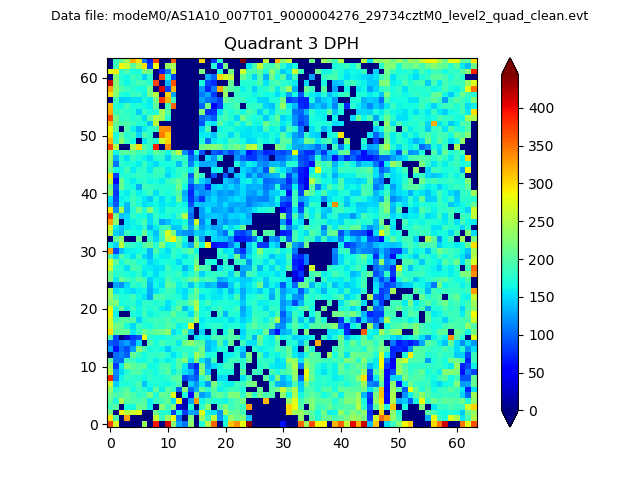 |
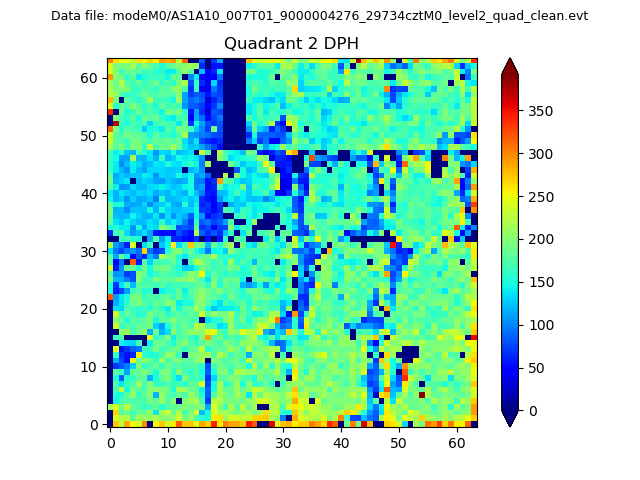 |
Quadrant C |
| Plot type | Count rate plots | Images |
|---|---|---|
| Comparison with Poisson distribution Blue bars denote a histogram of data divided into 1 sec bins. Red curve is a Poisson curve with rate = median count rate of data. |
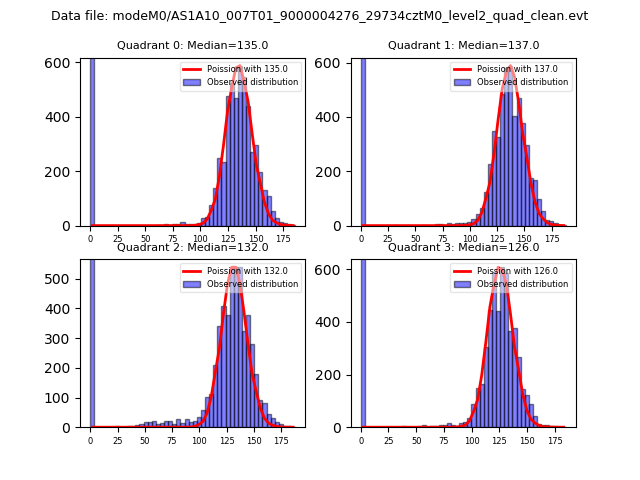 |
 |
| Quadrant-wise count rates Data is divided into 100 sec bins |
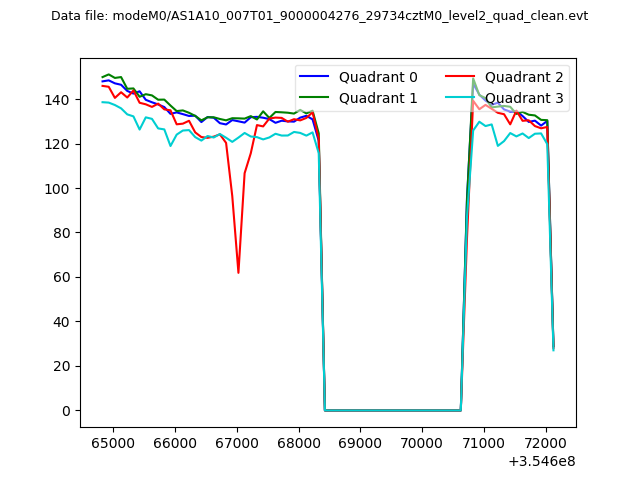 |
|
| Module-wise count rates for Quadrant A Data is divided into 100 sec bins |
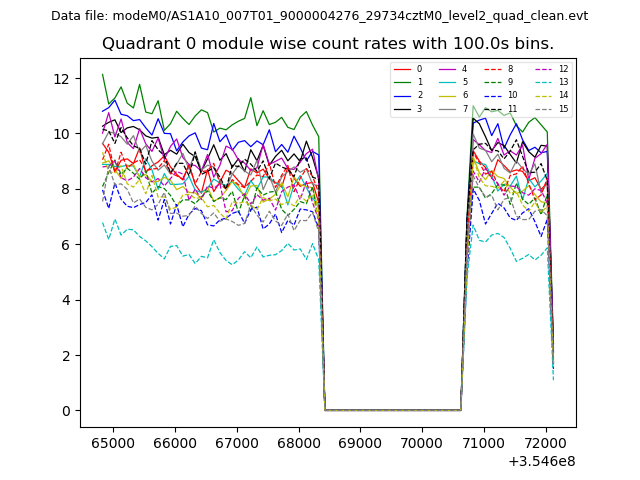 |
 |
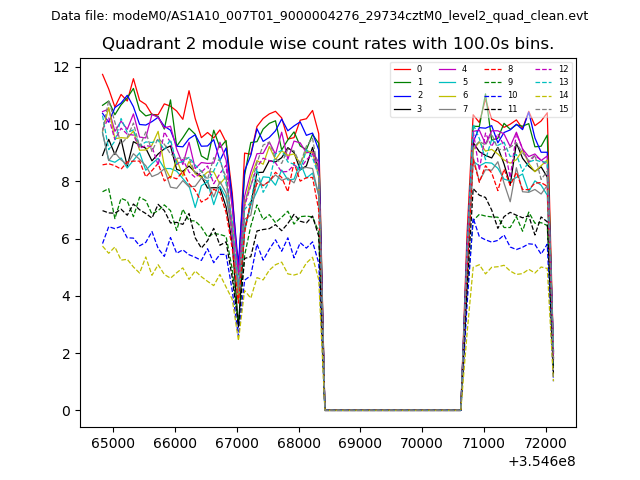
| Module-wise count rates for Quadrant B Data is divided into 100 sec bins |
 |
 |
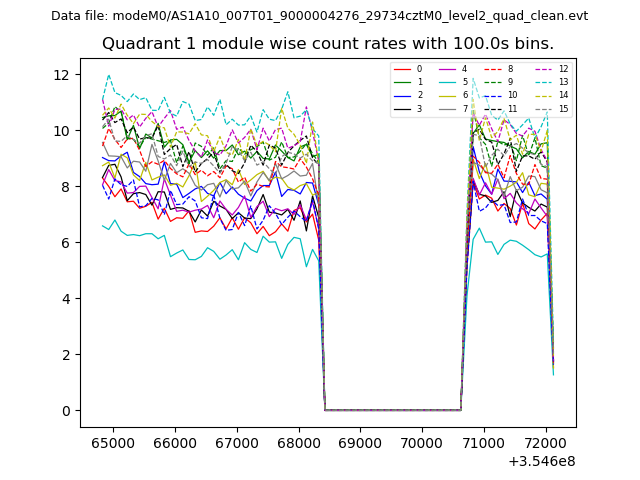
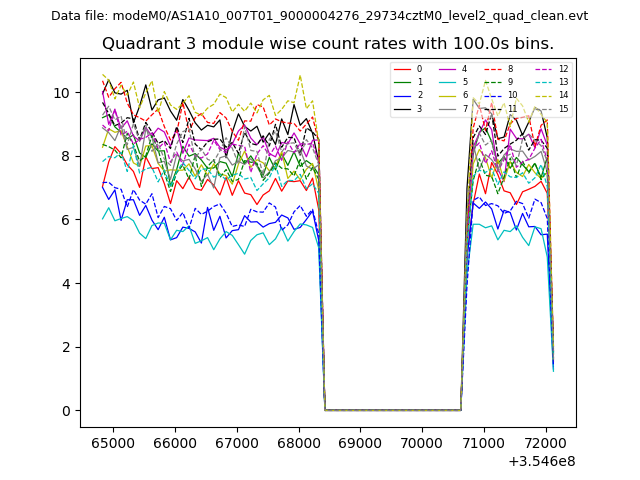
| Module-wise count rates for Quadrant C Data is divided into 100 sec bins |
 |
 |
| Module-wise count rates for Quadrant D Data is divided into 100 sec bins |
 |
 |
| Parameter | Plot |
|---|---|
| CZT HV Monitor | 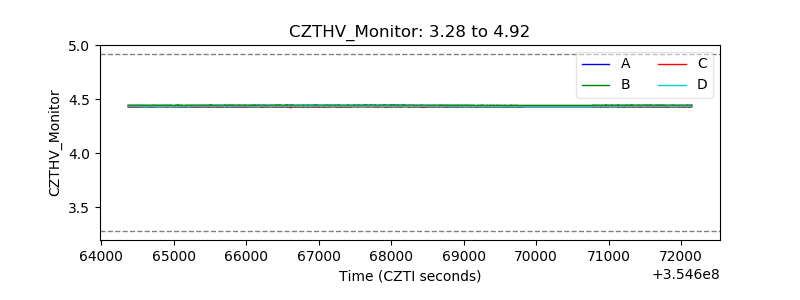 |
| D_VDD | 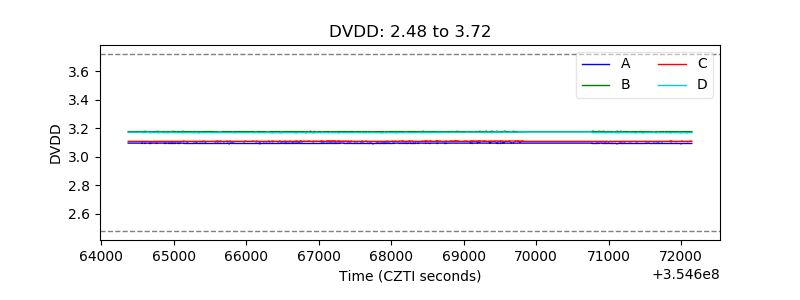 |
| Temperature 1 | 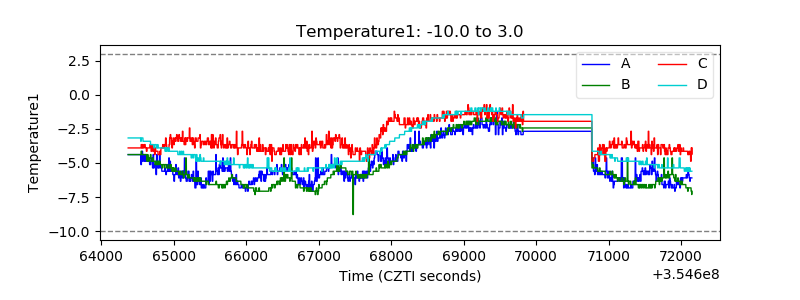 |
| Veto HV Monitor | 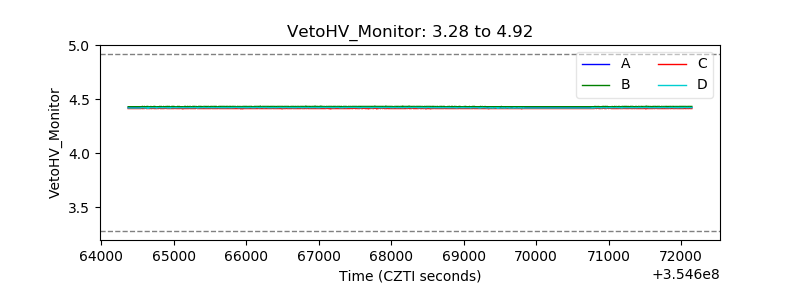 |
| Veto LLD | 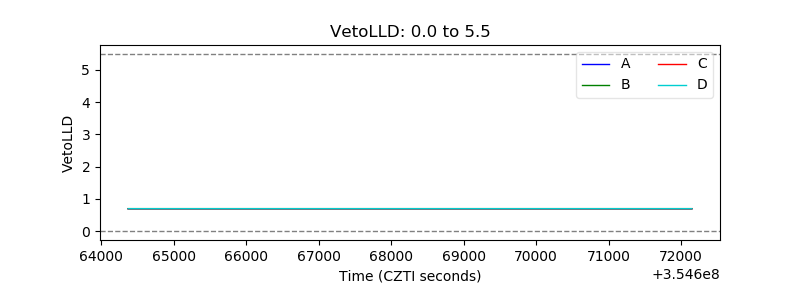 |
| Alpha Counter | 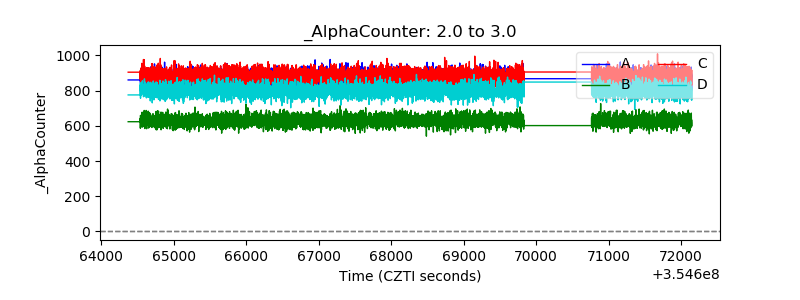 |
| _CPM_Rate | 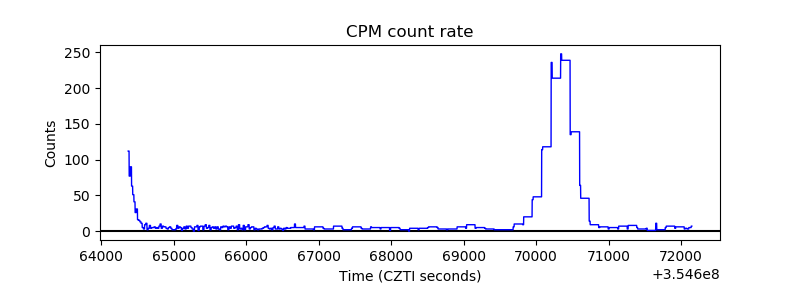 |
| CZT Counter | 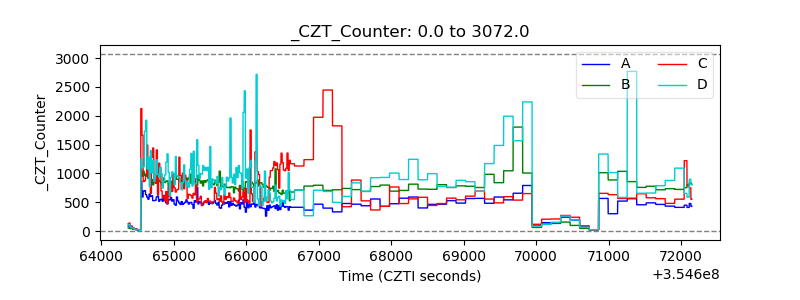 |
| +2.5 Volts monitor |  |
| +5 Volts monitor | 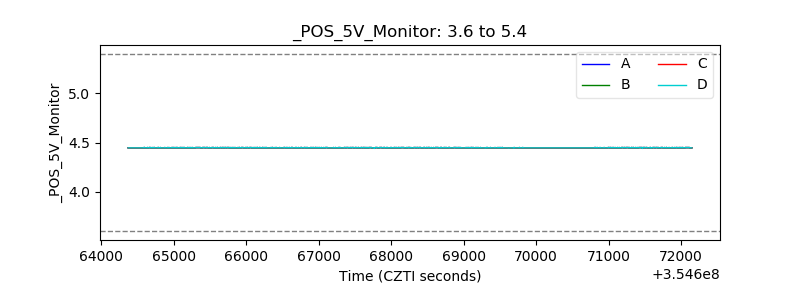 |
| _ROLL_ROT | 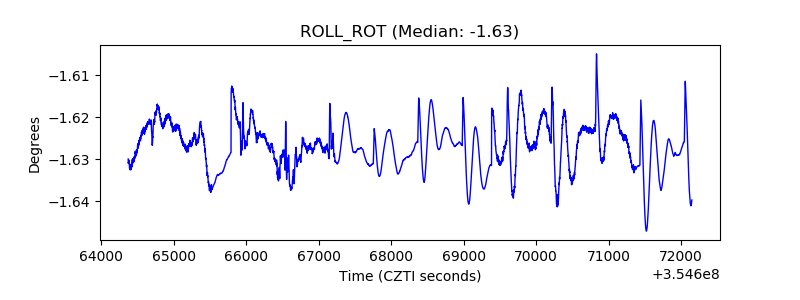 |
| _Roll_DEC | 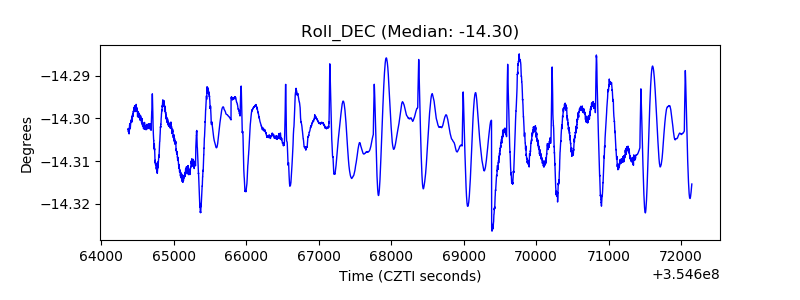 |
| _Roll_RA | 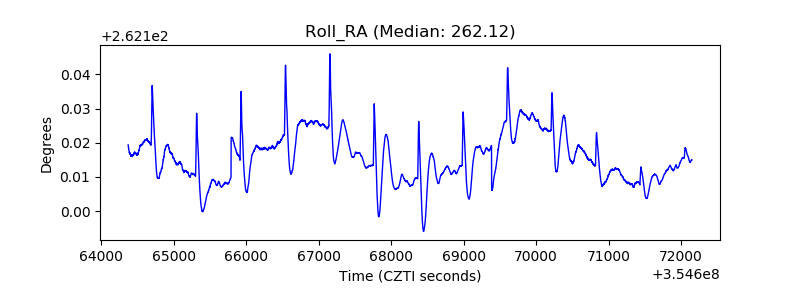 |
| Veto Counter |  |