| Param | Original file | Final file |
|---|---|---|
| Filename | modeM0/AS1A10_007T01_9000004276_29736cztM0_level2.evt | modeM0/AS1A10_007T01_9000004276_29736cztM0_level2_quad_clean.evt |
| Size (bytes) | 900,339,840 | 106,833,600 |
| Size | 858.6 MB | 101.9 MB |
| Events in quadrant A | 3,743,947 | 702,804 |
| Events in quadrant B | 6,029,971 | 705,337 |
| Events in quadrant C | 4,488,074 | 691,835 |
| Events in quadrant D | 12,485,440 | 598,220 |
| Mode SS | |||
|---|---|---|---|
| Quadrant | BADHDUFLAG | Total packets | Discarded packets |
| A | 0 | 156 | 0 |
| B | 0 | 156 | 0 |
| C | 0 | 156 | 0 |
| D | 0 | 156 | 0 |
| Mode M0 | |||
|---|---|---|---|
| Quadrant | BADHDUFLAG | Total packets | Discarded packets |
| A | 0 | 16172 | 2 |
| B | 0 | 23648 | 2 |
| C | 0 | 18092 | 2 |
| D | 0 | 42479 | 2 |
| Mode M9 | |||
|---|---|---|---|
| Quadrant | BADHDUFLAG | Total packets | Discarded packets |
| A | 0 | 1 | 0 |
| B | 0 | 1 | 0 |
| C | 0 | 1 | 0 |
| D | 0 | 1 | 0 |
| Quadrant | Total seconds | Saturated seconds | Saturation percentage |
|---|---|---|---|
| A | 7716 | 88 | 1.140487% |
| B | 7716 | 267 | 3.460342% |
| C | 7716 | 281 | 3.641783% |
| D | 7717 | 2334 | 30.244914% |
Noise dominated data is calculated using 1-second bins in cleaned event files. If a bin has >2000 counts, and if more than 50% of those come from <1% of pixels, then it is considered to be noise-dominated and hence unusable.
| Quadrant | # 1 sec bins | Bins with >0 counts | Bins with >2000 counts | High rate bins dominated by noise | Noise dominated (total time) | Noise dominated (detector-on time) | Marked lightcurve |
|---|---|---|---|---|---|---|---|
| A | 7821 | 7717 | 0 | 0 | 0.00% | 0.00% | 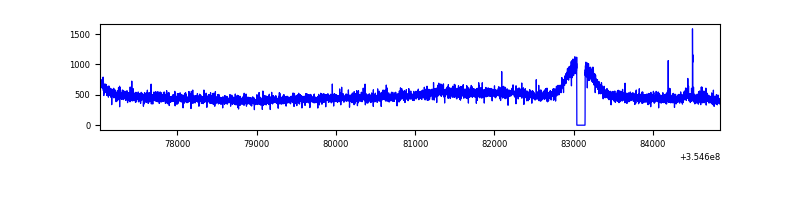 |
| B | 7821 | 7716 | 2 | 2 | 0.03% | 0.03% | 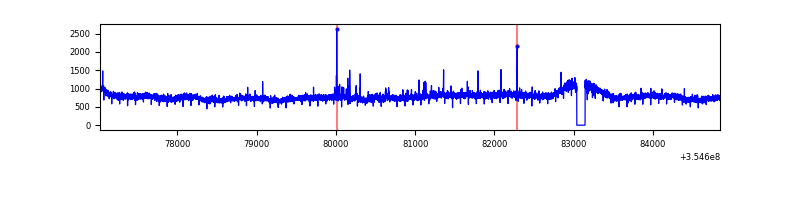 |
| C | 7821 | 7717 | 32 | 32 | 0.41% | 0.41% | 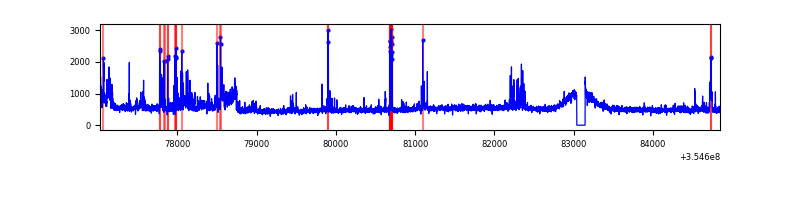 |
| D | 7822 | 7718 | 2194 | 2194 | 28.05% | 28.43% | 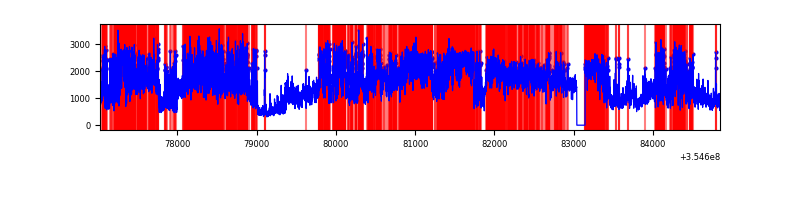 |
Top three noisy pixels from each quadrant. If the there are fewer than three noisy pixels in the level2.evt file, extra rows are filled as -1
| Pixel properties | Quadrant properties | ||||||
|---|---|---|---|---|---|---|---|
| Quadrant | DetID | PixID | Counts | Sigma | Mean | Median | Sigma |
| A | 9 | 143 | 20123 | 98.48 | 958 | 936 | 194.8 |
| A | 12 | 16 | 18949 | 92.46 | 958 | 936 | 194.8 |
| A | 13 | 254 | 14567 | 69.96 | 958 | 936 | 194.8 |
| B | 6 | 159 | 2205250 | 11829.31 | 950 | 923 | 186.3 |
| B | 12 | 111 | 23209 | 119.6 | 950 | 923 | 186.3 |
| B | 5 | 255 | 22245 | 114.42 | 950 | 923 | 186.3 |
| C | 3 | 233 | 546553 | 2485.61 | 929 | 936 | 219.5 |
| C | 14 | 238 | 154122 | 697.85 | 929 | 936 | 219.5 |
| C | 15 | 208 | 83328 | 375.35 | 929 | 936 | 219.5 |
| D | 8 | 195 | 6953961 | 34358.48 | 846 | 825 | 202.4 |
| D | 7 | 80 | 2105209 | 10398.68 | 846 | 825 | 202.4 |
| D | 2 | 250 | 141192 | 693.61 | 846 | 825 | 202.4 |
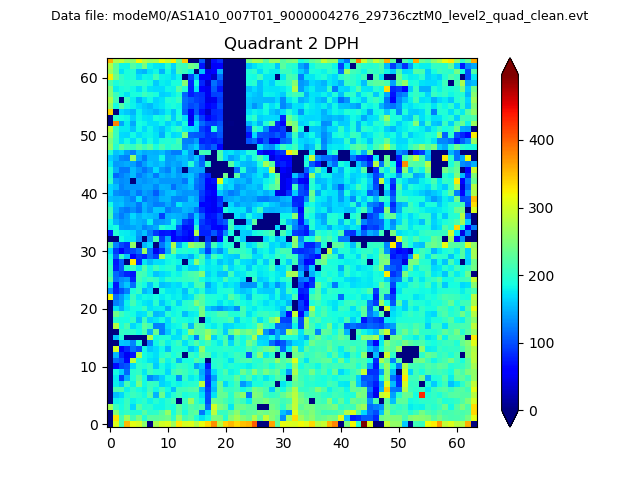
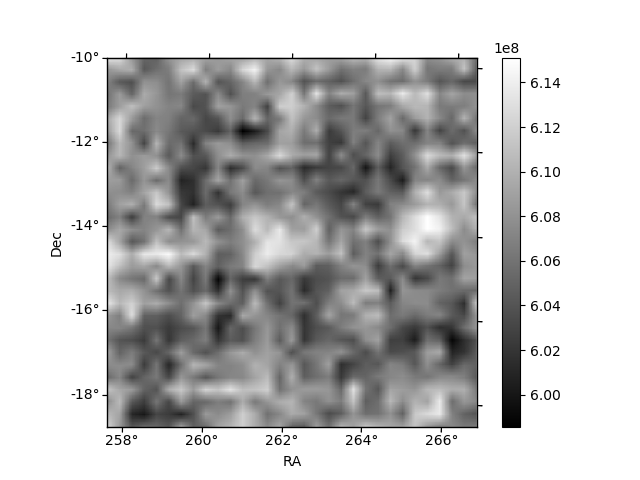
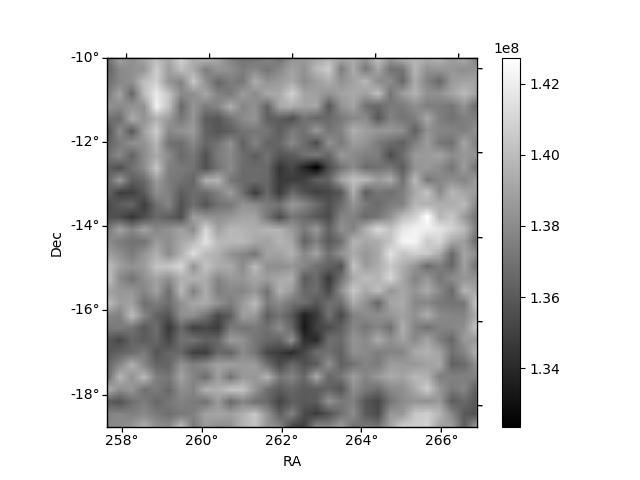
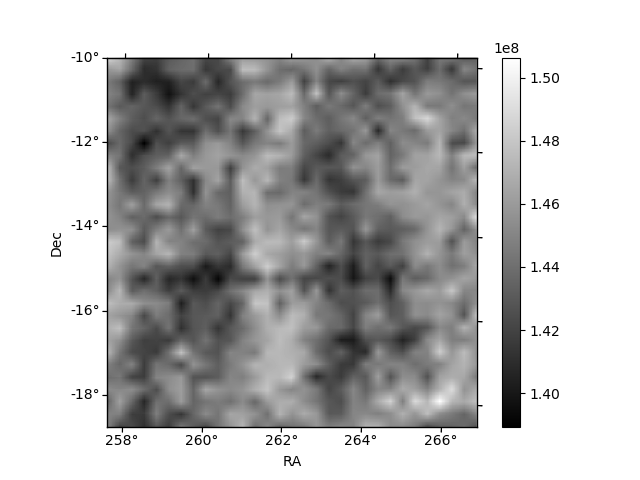
Histogram calculated using DETX and DETY for each event in the final _common_clean file
| Quadrant A | 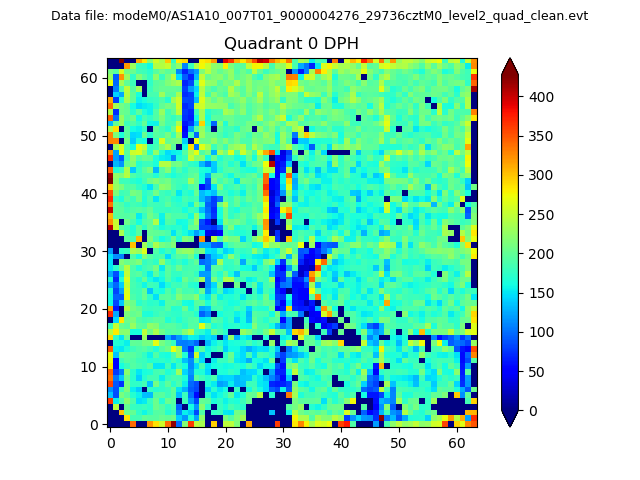 |
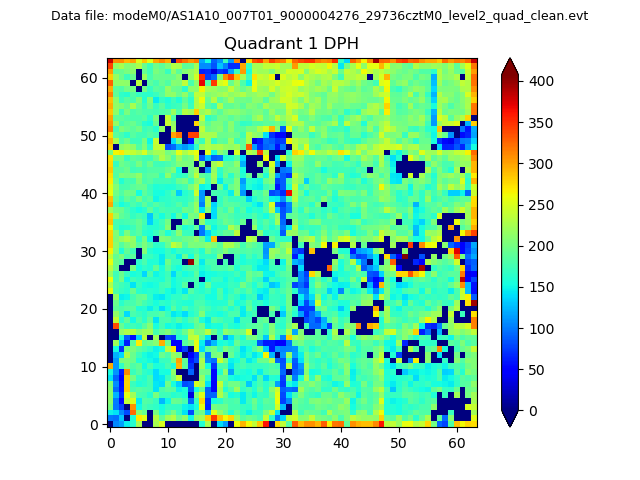 |
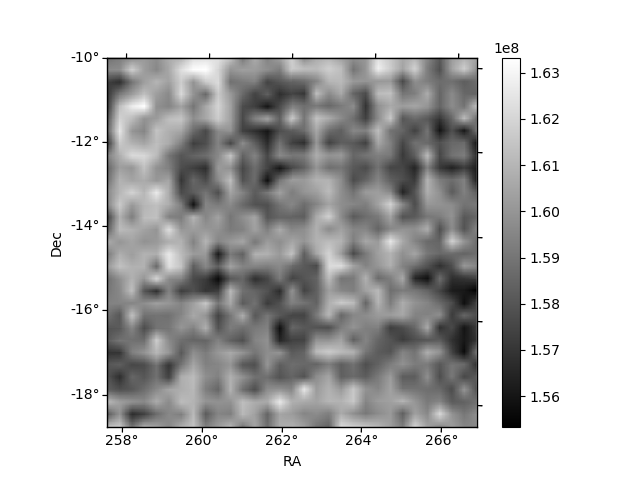
Quadrant B |
|---|---|---|---|
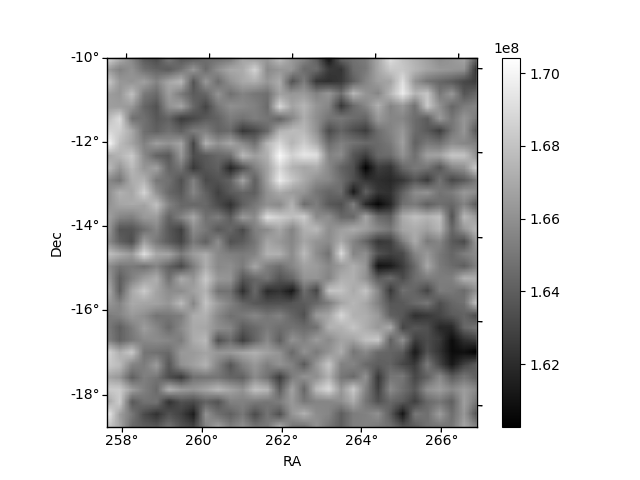
| Quadrant D | 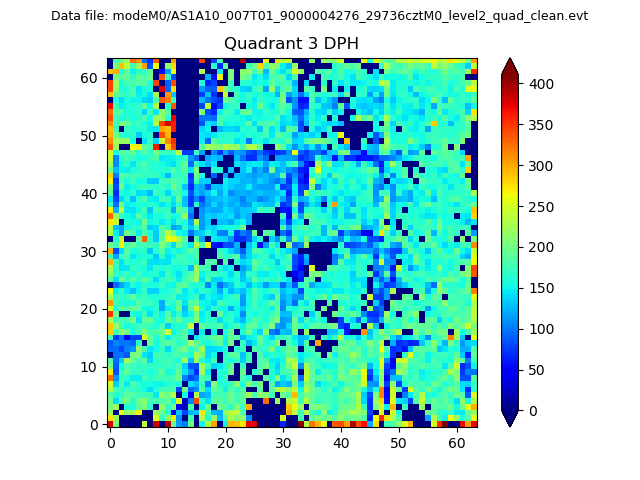 |
 |
Quadrant C |
| Plot type | Count rate plots | Images |
|---|---|---|
| Comparison with Poisson distribution Blue bars denote a histogram of data divided into 1 sec bins. Red curve is a Poisson curve with rate = median count rate of data. |
 |
 |
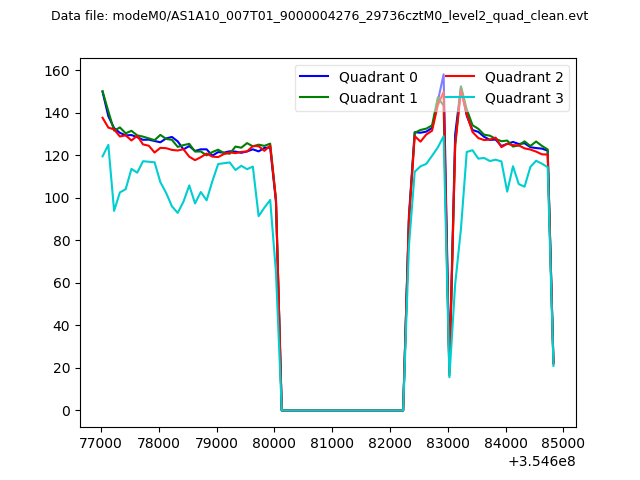
| Quadrant-wise count rates Data is divided into 100 sec bins |
 |
|
| Module-wise count rates for Quadrant A Data is divided into 100 sec bins |
 |
 |
| Module-wise count rates for Quadrant B Data is divided into 100 sec bins |
 |
 |
| Module-wise count rates for Quadrant C Data is divided into 100 sec bins |
 |
 |
| Module-wise count rates for Quadrant D Data is divided into 100 sec bins |
 |
 |
| Parameter | Plot |
|---|---|
| CZT HV Monitor | 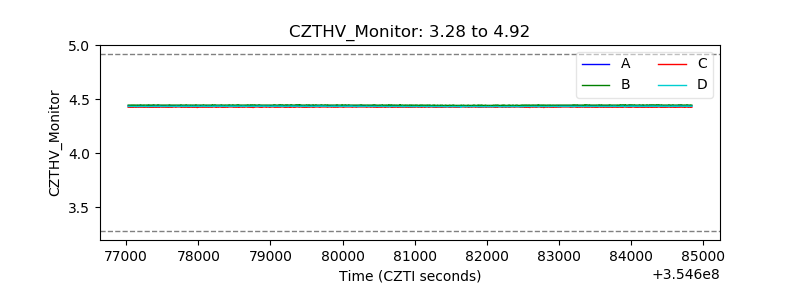 |
| D_VDD | 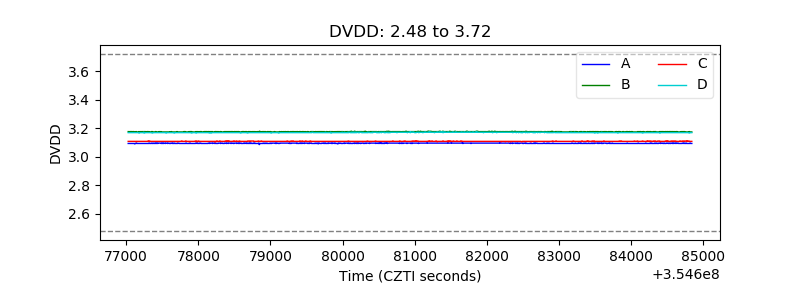 |
| Temperature 1 |  |
| Veto HV Monitor | 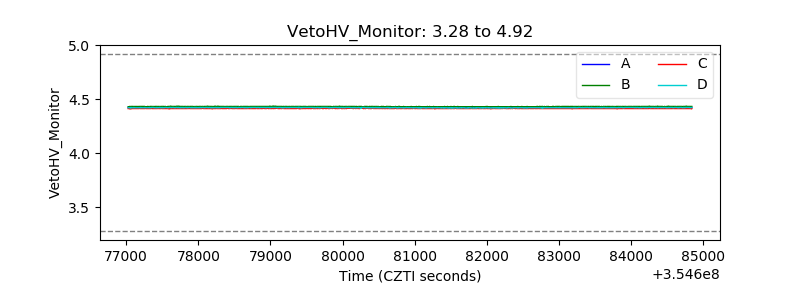 |
| Veto LLD | 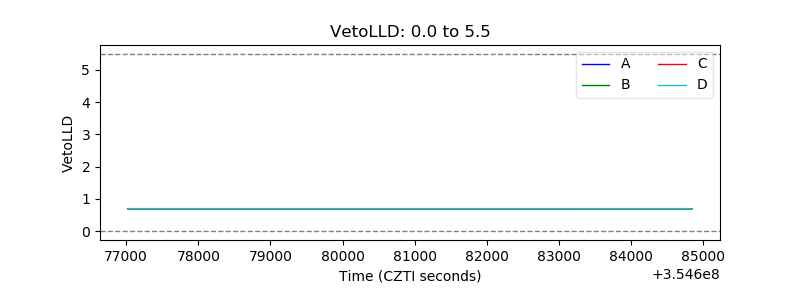 |
| Alpha Counter | 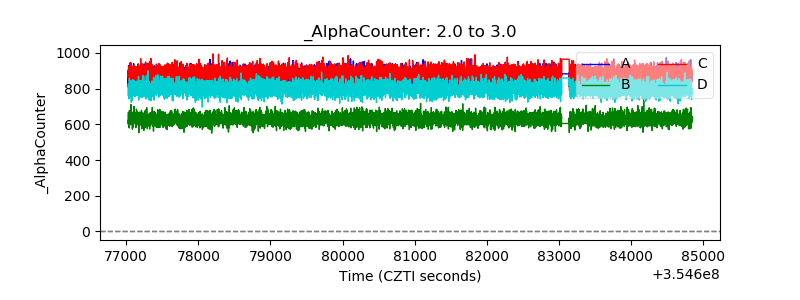 |
| _CPM_Rate | 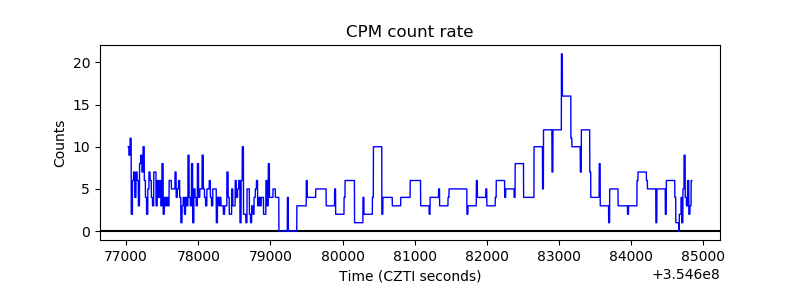 |
| CZT Counter | 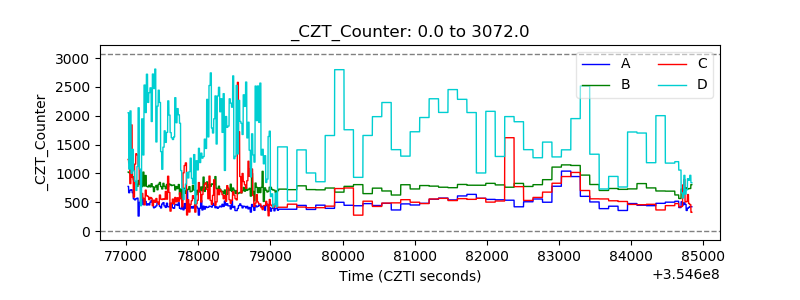 |
| +2.5 Volts monitor |  |
| +5 Volts monitor |  |
| _ROLL_ROT |  |
| _Roll_DEC |  |
| _Roll_RA | 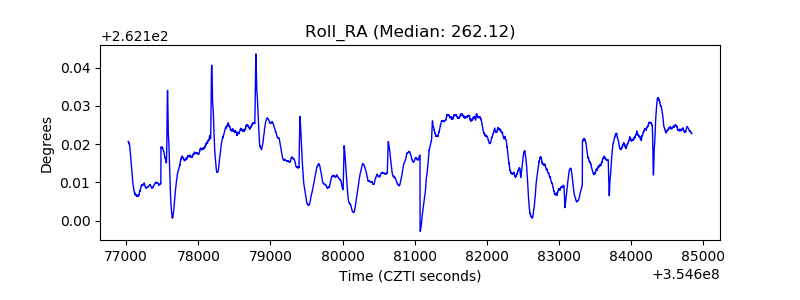 |
| Veto Counter | 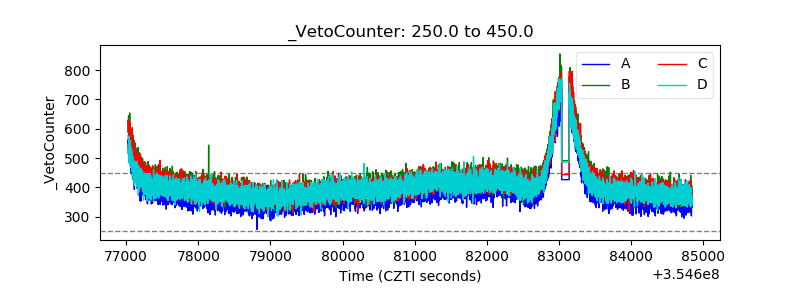 |