| Param | Original file | Final file |
|---|---|---|
| Filename | modeM0/AS1A10_007T01_9000004276_29741cztM0_level2.evt | modeM0/AS1A10_007T01_9000004276_29741cztM0_level2_quad_clean.evt |
| Size (bytes) | 2,419,306,560 | 309,847,680 |
| Size | 2.3 GB | 295.5 MB |
| Events in quadrant A | 13,039,312 | 1,929,758 |
| Events in quadrant B | 20,344,299 | 1,947,301 |
| Events in quadrant C | 16,395,923 | 1,890,087 |
| Events in quadrant D | 21,733,391 | 1,819,200 |
| Mode SS | |||
|---|---|---|---|
| Quadrant | BADHDUFLAG | Total packets | Discarded packets |
| A | 0 | 532 | 0 |
| B | 0 | 532 | 0 |
| C | 0 | 532 | 0 |
| D | 0 | 532 | 0 |
| Mode M0 | |||
|---|---|---|---|
| Quadrant | BADHDUFLAG | Total packets | Discarded packets |
| A | 0 | 55229 | 4 |
| B | 0 | 79408 | 4 |
| C | 0 | 65221 | 5 |
| D | 0 | 82621 | 4 |
| Mode M9 | |||
|---|---|---|---|
| Quadrant | BADHDUFLAG | Total packets | Discarded packets |
| A | 0 | 33 | 0 |
| B | 0 | 33 | 0 |
| C | 0 | 33 | 0 |
| D | 0 | 33 | 0 |
| Quadrant | Total seconds | Saturated seconds | Saturation percentage |
|---|---|---|---|
| A | 26146 | 349 | 1.334812% |
| B | 26146 | 593 | 2.268033% |
| C | 26145 | 1143 | 4.371773% |
| D | 26146 | 1092 | 4.176547% |
Noise dominated data is calculated using 1-second bins in cleaned event files. If a bin has >2000 counts, and if more than 50% of those come from <1% of pixels, then it is considered to be noise-dominated and hence unusable.
| Quadrant | # 1 sec bins | Bins with >0 counts | Bins with >2000 counts | High rate bins dominated by noise | Noise dominated (total time) | Noise dominated (detector-on time) | Marked lightcurve |
|---|---|---|---|---|---|---|---|
| A | 32190 | 26149 | 8 | 8 | 0.02% | 0.03% | 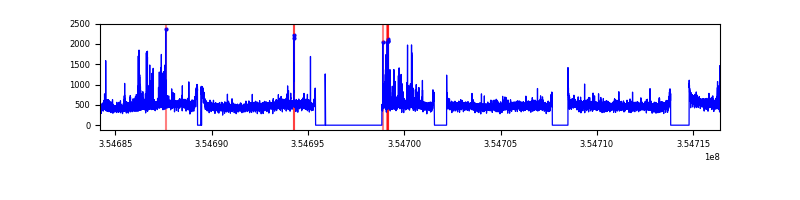 |
| B | 32190 | 26148 | 31 | 31 | 0.10% | 0.12% | 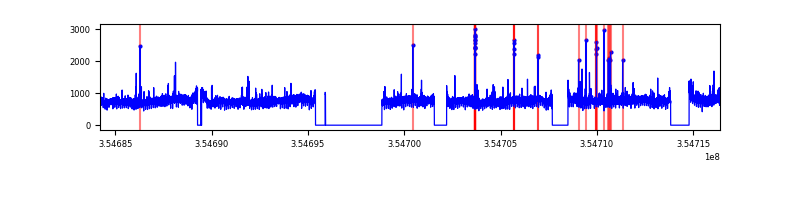 |
| C | 32189 | 26147 | 405 | 405 | 1.26% | 1.55% | 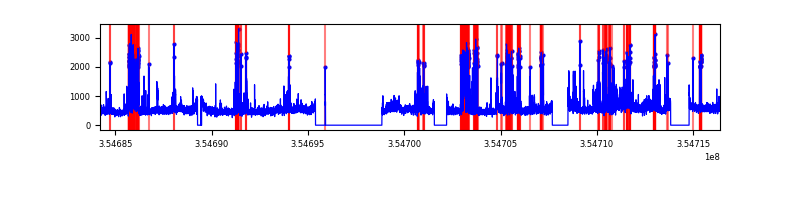 |
| D | 32190 | 26147 | 767 | 767 | 2.38% | 2.93% | 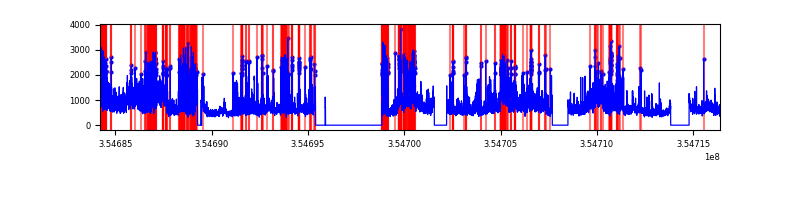 |
Top three noisy pixels from each quadrant. If the there are fewer than three noisy pixels in the level2.evt file, extra rows are filled as -1
| Pixel properties | Quadrant properties | ||||||
|---|---|---|---|---|---|---|---|
| Quadrant | DetID | PixID | Counts | Sigma | Mean | Median | Sigma |
| A | 12 | 16 | 470370 | 722.48 | 3230 | 3155 | 646.7 |
| A | 12 | 194 | 93827 | 140.21 | 3230 | 3155 | 646.7 |
| A | 13 | 254 | 51202 | 74.3 | 3230 | 3155 | 646.7 |
| B | 6 | 159 | 7413876 | 12096.94 | 3188 | 3104 | 612.6 |
| B | 0 | 229 | 222619 | 358.32 | 3188 | 3104 | 612.6 |
| B | 12 | 111 | 77541 | 121.51 | 3188 | 3104 | 612.6 |
| C | 3 | 233 | 2228454 | 3063.8 | 3098 | 3118 | 726.3 |
| C | 10 | 22 | 1423505 | 1955.56 | 3098 | 3118 | 726.3 |
| C | 14 | 238 | 494254 | 676.19 | 3098 | 3118 | 726.3 |
| D | 8 | 195 | 6839778 | 9260.36 | 3112 | 3032 | 738.3 |
| D | 7 | 80 | 2320811 | 3139.43 | 3112 | 3032 | 738.3 |
| D | 12 | 227 | 260754 | 349.08 | 3112 | 3032 | 738.3 |
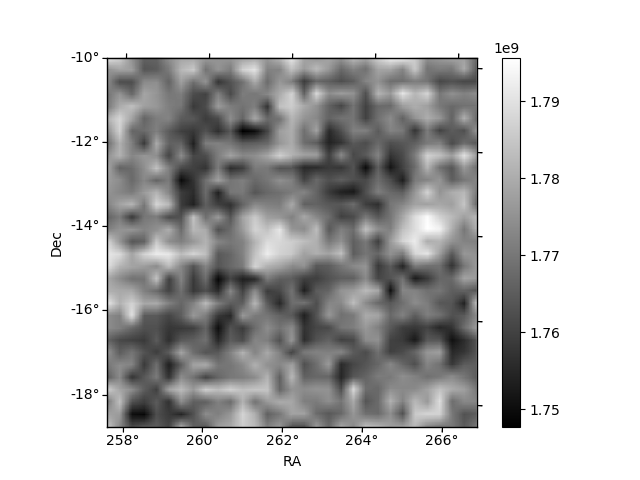
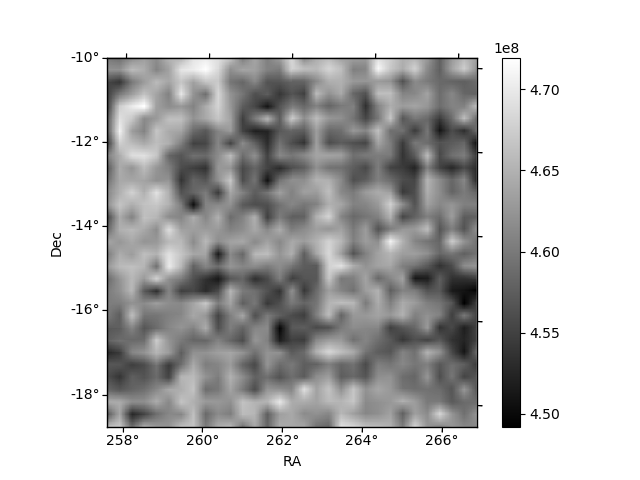
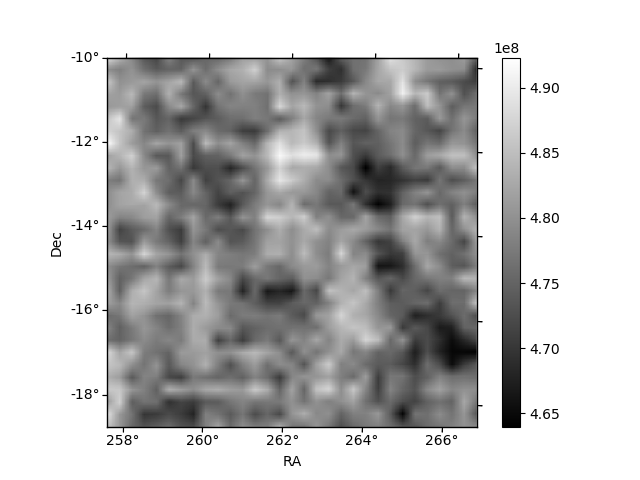
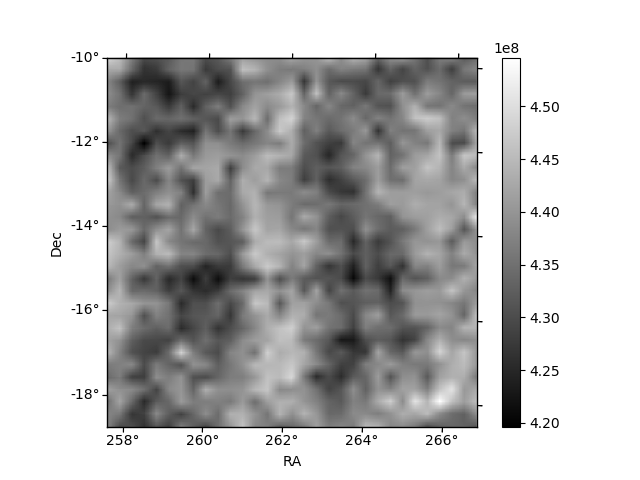
Histogram calculated using DETX and DETY for each event in the final _common_clean file
| Quadrant A | 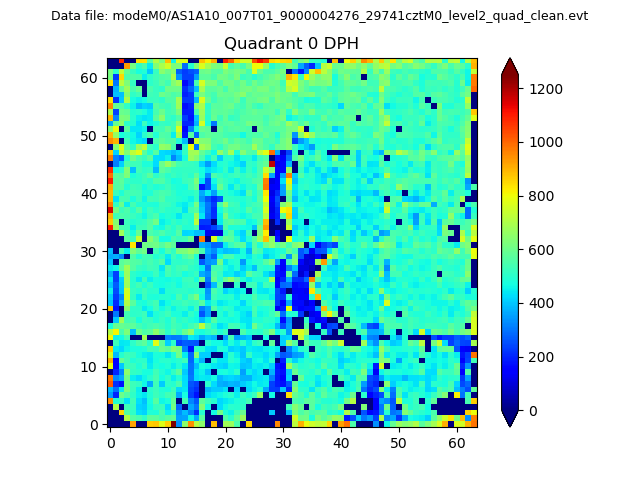 |
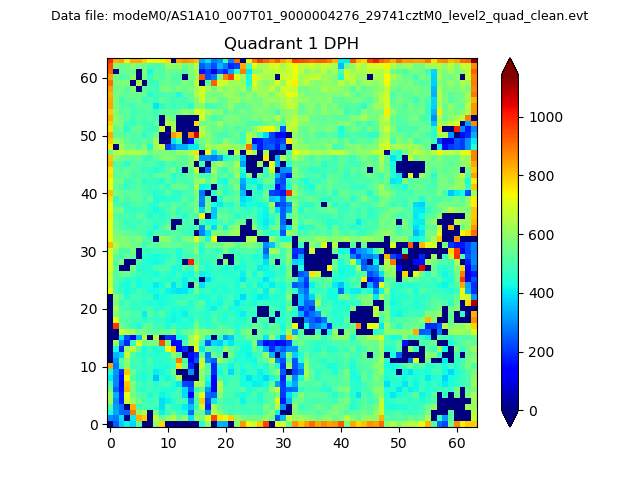 |
Quadrant B |
|---|---|---|---|
| Quadrant D | 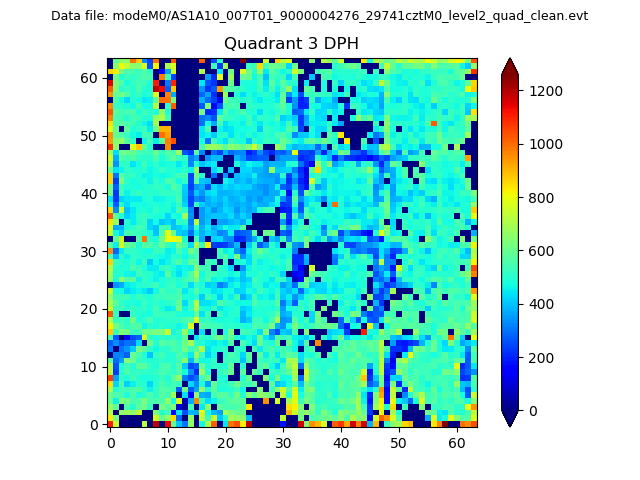 |
 |
Quadrant C |
| Plot type | Count rate plots | Images |
|---|---|---|
| Comparison with Poisson distribution Blue bars denote a histogram of data divided into 1 sec bins. Red curve is a Poisson curve with rate = median count rate of data. |
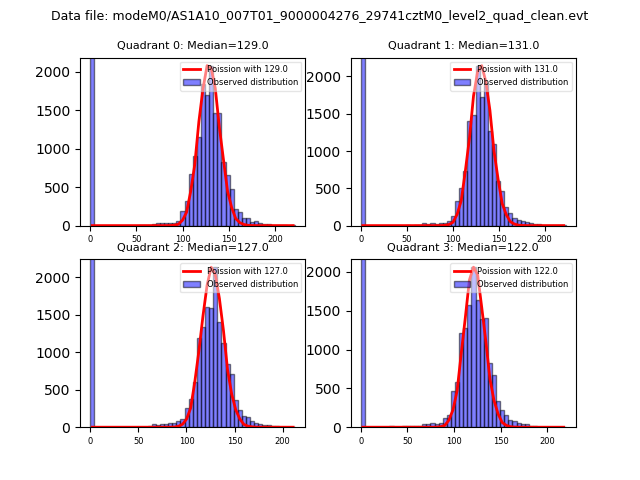 |
 |
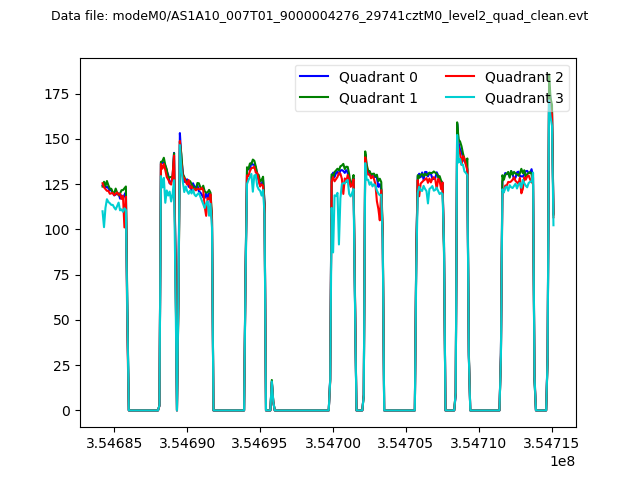
| Quadrant-wise count rates Data is divided into 100 sec bins |
 |
|
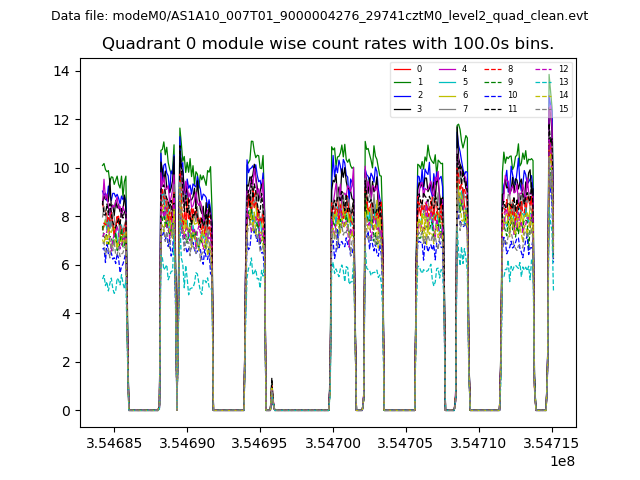
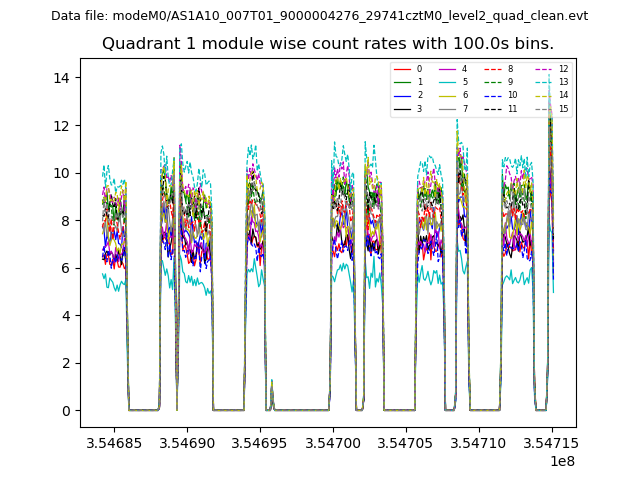
| Module-wise count rates for Quadrant A Data is divided into 100 sec bins |
 |
 |
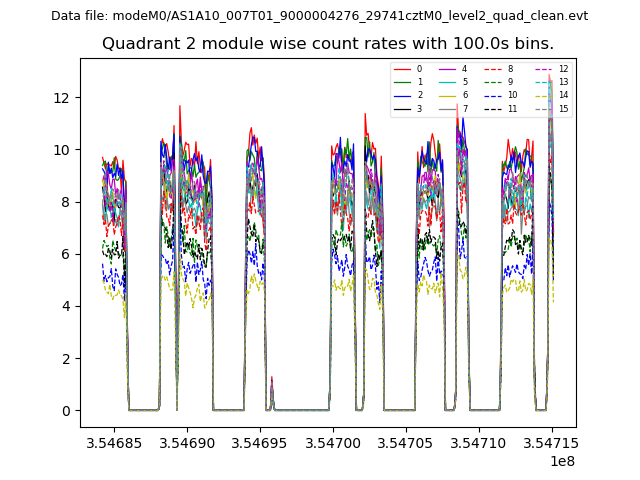
| Module-wise count rates for Quadrant B Data is divided into 100 sec bins |
 |
 |
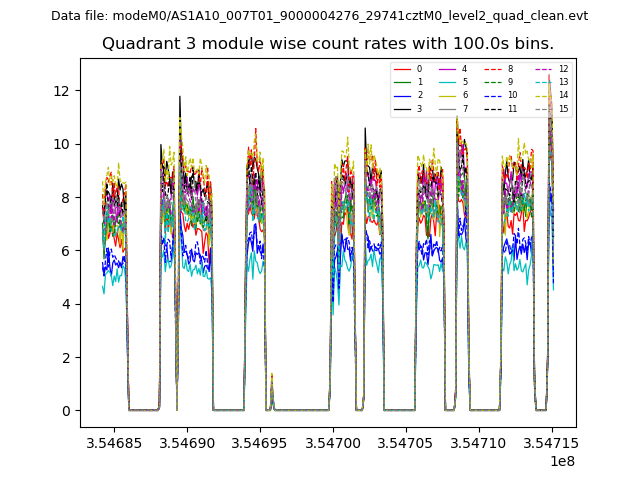
| Module-wise count rates for Quadrant C Data is divided into 100 sec bins |
 |
 |
| Module-wise count rates for Quadrant D Data is divided into 100 sec bins |
 |
 |
| Parameter | Plot |
|---|---|
| CZT HV Monitor | 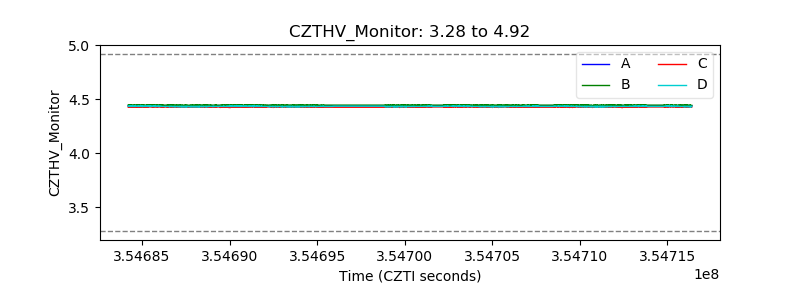 |
| D_VDD | 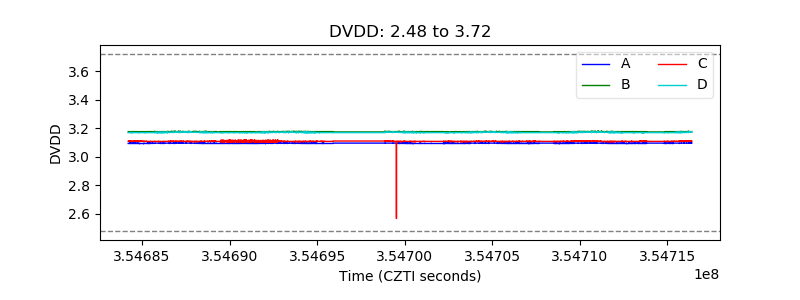 |
| Temperature 1 | 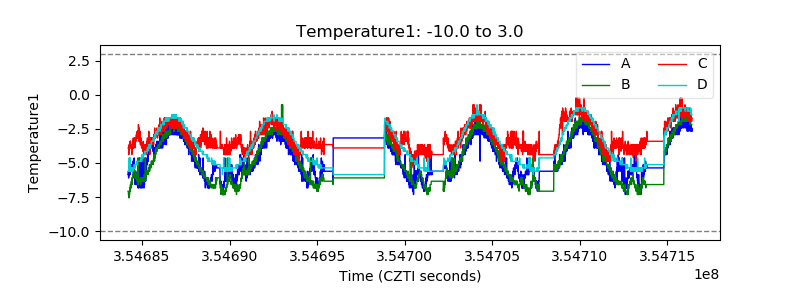 |
| Veto HV Monitor | 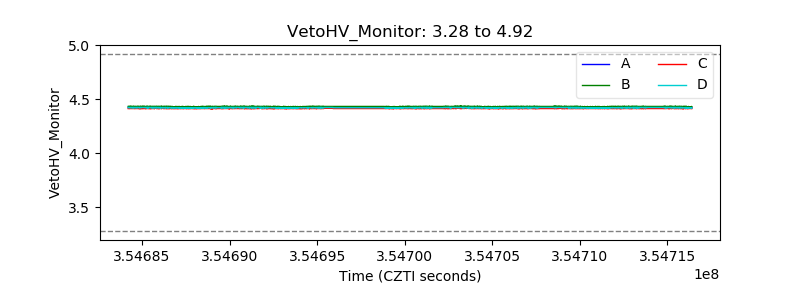 |
| Veto LLD | 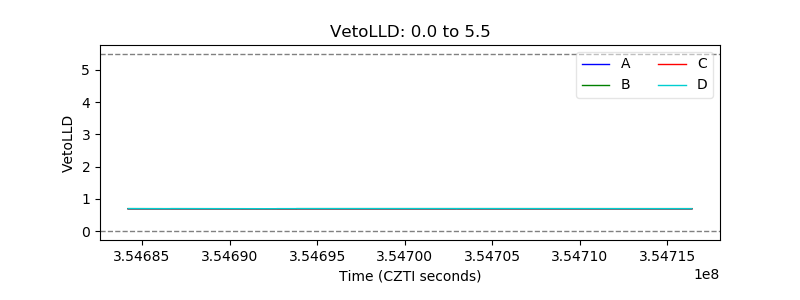 |
| Alpha Counter | 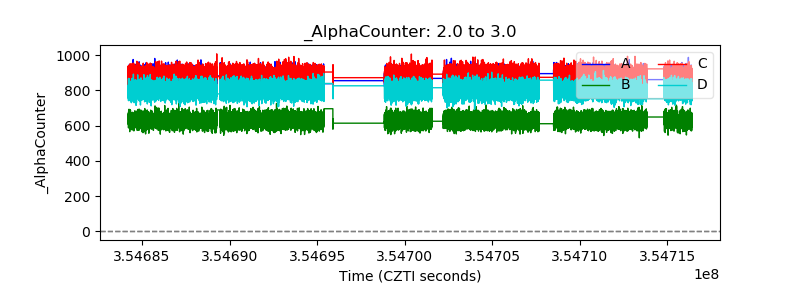 |
| _CPM_Rate | 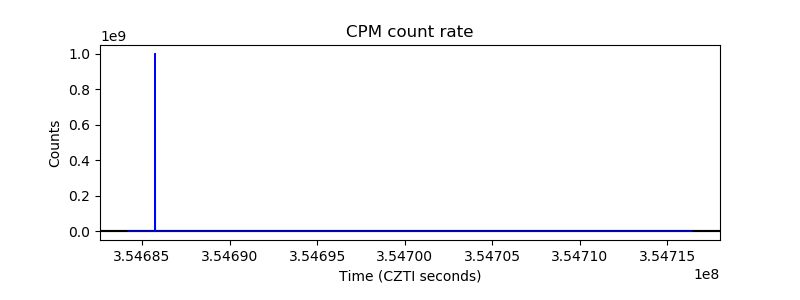 |
| CZT Counter |  |
| +2.5 Volts monitor |  |
| +5 Volts monitor |  |
| _ROLL_ROT | 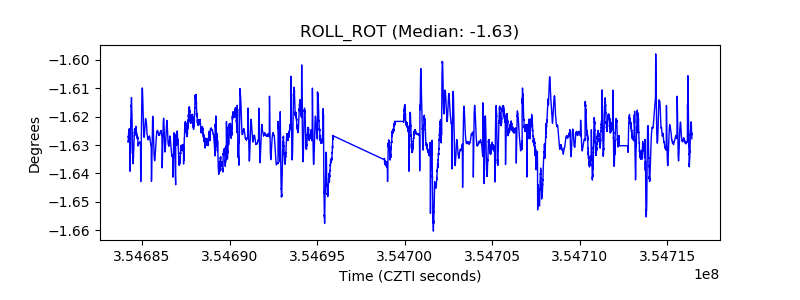 |
| _Roll_DEC | 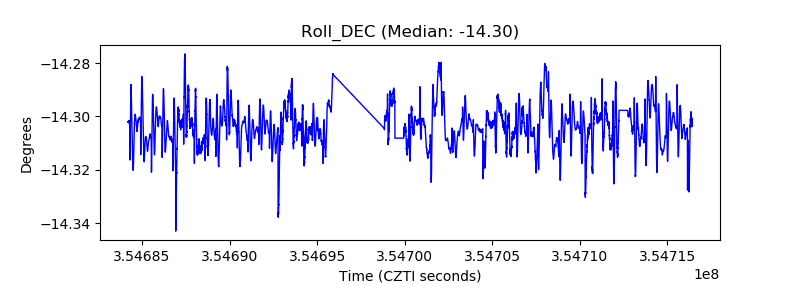 |
| _Roll_RA | 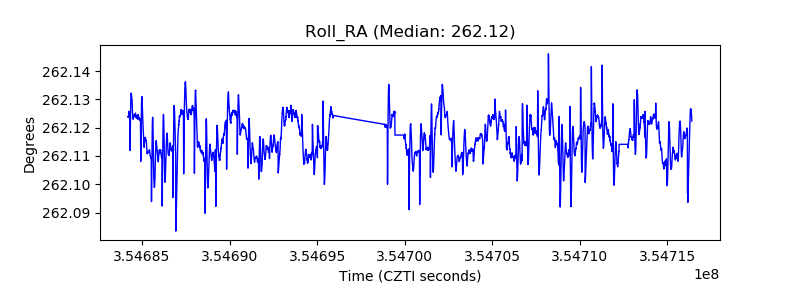 |
| Veto Counter | 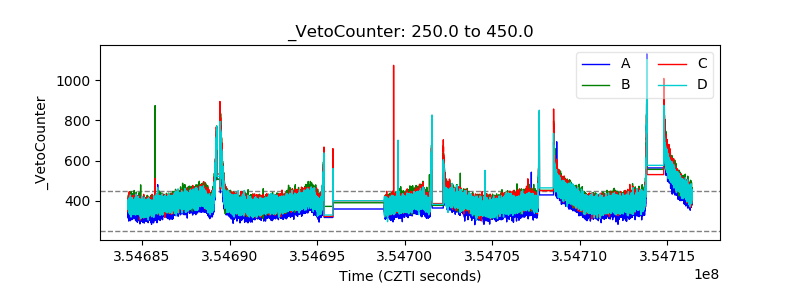 |