| Param | Original file | Final file |
|---|---|---|
| Filename | modeM0/AS1A10_007T01_9000004276_29743cztM0_level2.evt | modeM0/AS1A10_007T01_9000004276_29743cztM0_level2_quad_clean.evt |
| Size (bytes) | 2,300,230,080 | 296,521,920 |
| Size | 2.1 GB | 282.8 MB |
| Events in quadrant A | 12,946,699 | 1,840,017 |
| Events in quadrant B | 20,140,640 | 1,851,004 |
| Events in quadrant C | 15,853,683 | 1,801,285 |
| Events in quadrant D | 19,017,151 | 1,743,566 |
| Mode SS | |||
|---|---|---|---|
| Quadrant | BADHDUFLAG | Total packets | Discarded packets |
| A | 0 | 514 | 0 |
| B | 0 | 514 | 0 |
| C | 0 | 514 | 0 |
| D | 0 | 514 | 0 |
| Mode M0 | |||
|---|---|---|---|
| Quadrant | BADHDUFLAG | Total packets | Discarded packets |
| A | 0 | 54349 | 5 |
| B | 0 | 77522 | 5 |
| C | 0 | 63073 | 5 |
| D | 0 | 73792 | 5 |
| Mode M9 | |||
|---|---|---|---|
| Quadrant | BADHDUFLAG | Total packets | Discarded packets |
| A | 0 | 42 | 0 |
| B | 0 | 42 | 0 |
| C | 0 | 42 | 0 |
| D | 0 | 42 | 0 |
| Quadrant | Total seconds | Saturated seconds | Saturation percentage |
|---|---|---|---|
| A | 25372 | 296 | 1.166640% |
| B | 25373 | 502 | 1.978481% |
| C | 25372 | 957 | 3.771875% |
| D | 25372 | 756 | 2.979663% |
Noise dominated data is calculated using 1-second bins in cleaned event files. If a bin has >2000 counts, and if more than 50% of those come from <1% of pixels, then it is considered to be noise-dominated and hence unusable.
| Quadrant | # 1 sec bins | Bins with >0 counts | Bins with >2000 counts | High rate bins dominated by noise | Noise dominated (total time) | Noise dominated (detector-on time) | Marked lightcurve |
|---|---|---|---|---|---|---|---|
| A | 29417 | 25372 | 9 | 9 | 0.03% | 0.04% |  |
| B | 29418 | 25374 | 37 | 37 | 0.13% | 0.15% |  |
| C | 29417 | 25373 | 297 | 297 | 1.01% | 1.17% |  |
| D | 29417 | 25372 | 531 | 531 | 1.81% | 2.09% |  |
Top three noisy pixels from each quadrant. If the there are fewer than three noisy pixels in the level2.evt file, extra rows are filled as -1
| Pixel properties | Quadrant properties | ||||||
|---|---|---|---|---|---|---|---|
| Quadrant | DetID | PixID | Counts | Sigma | Mean | Median | Sigma |
| A | 12 | 16 | 578530 | 911.91 | 3175 | 3108 | 631.0 |
| A | 12 | 194 | 109954 | 169.33 | 3175 | 3108 | 631.0 |
| A | 13 | 254 | 49822 | 74.03 | 3175 | 3108 | 631.0 |
| B | 6 | 159 | 7221048 | 12054.9 | 3135 | 3049 | 598.8 |
| B | 0 | 229 | 268277 | 442.96 | 3135 | 3049 | 598.8 |
| B | 5 | 255 | 129402 | 211.02 | 3135 | 3049 | 598.8 |
| C | 3 | 233 | 2500118 | 3531.92 | 3044 | 3070 | 707.0 |
| C | 10 | 22 | 777247 | 1095.03 | 3044 | 3070 | 707.0 |
| C | 14 | 238 | 490475 | 689.4 | 3044 | 3070 | 707.0 |
| D | 8 | 195 | 5195592 | 7138.13 | 3065 | 2986 | 727.4 |
| D | 7 | 80 | 1541653 | 2115.16 | 3065 | 2986 | 727.4 |
| D | 12 | 227 | 192694 | 260.79 | 3065 | 2986 | 727.4 |
Histogram calculated using DETX and DETY for each event in the final _common_clean file
| Quadrant A |  |
 |
Quadrant B |
|---|---|---|---|
| Quadrant D |  |
 |
Quadrant C |
| Plot type | Count rate plots | Images |
|---|---|---|
| Comparison with Poisson distribution Blue bars denote a histogram of data divided into 1 sec bins. Red curve is a Poisson curve with rate = median count rate of data. |
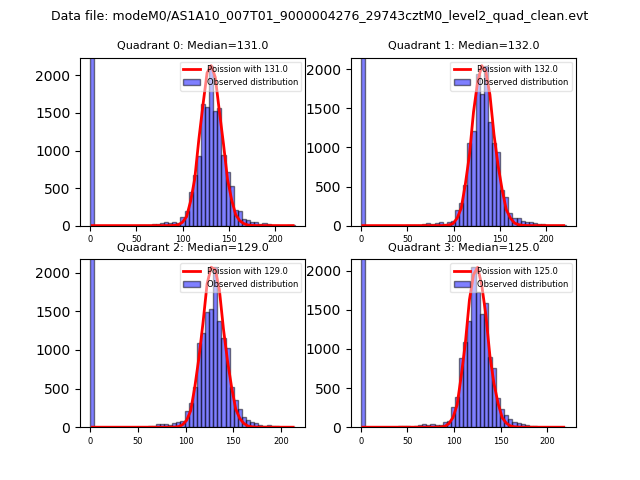 |
 |
| Quadrant-wise count rates Data is divided into 100 sec bins |
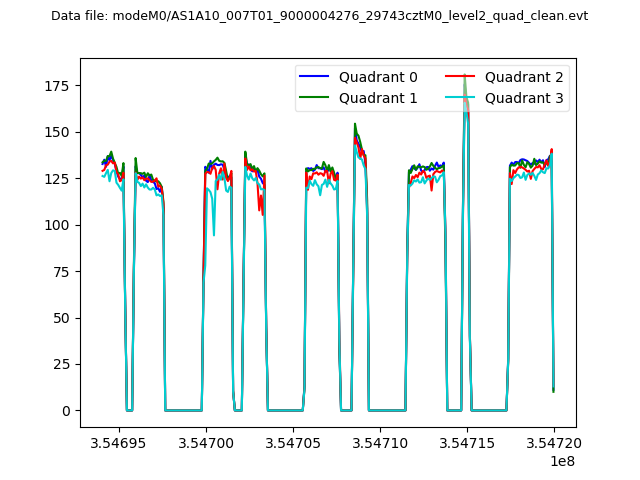 |
|
| Module-wise count rates for Quadrant A Data is divided into 100 sec bins |
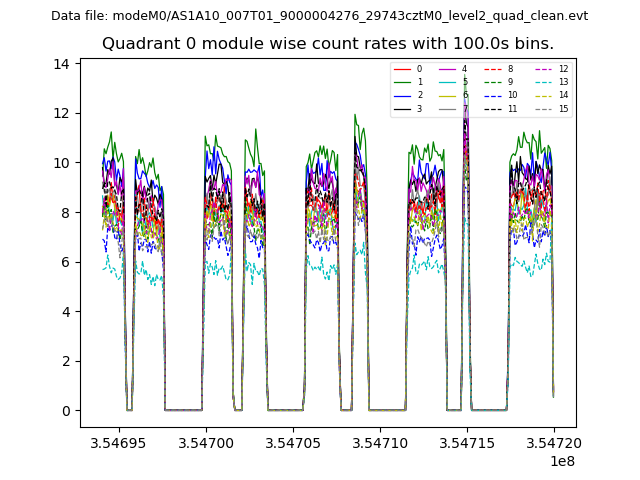 |
 |
| Module-wise count rates for Quadrant B Data is divided into 100 sec bins |
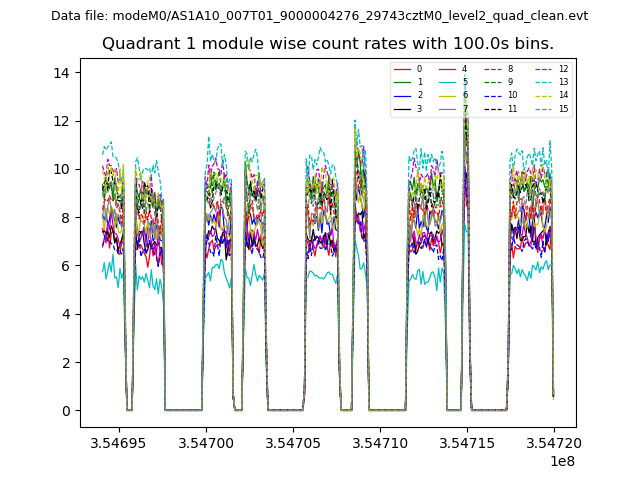 |
 |
| Module-wise count rates for Quadrant C Data is divided into 100 sec bins |
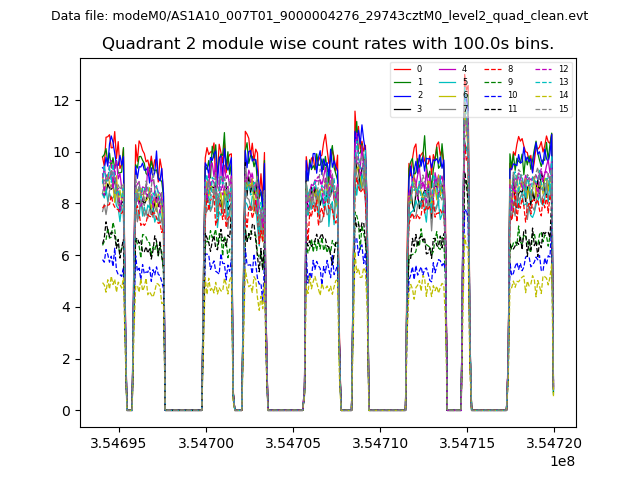 |
 |
| Module-wise count rates for Quadrant D Data is divided into 100 sec bins |
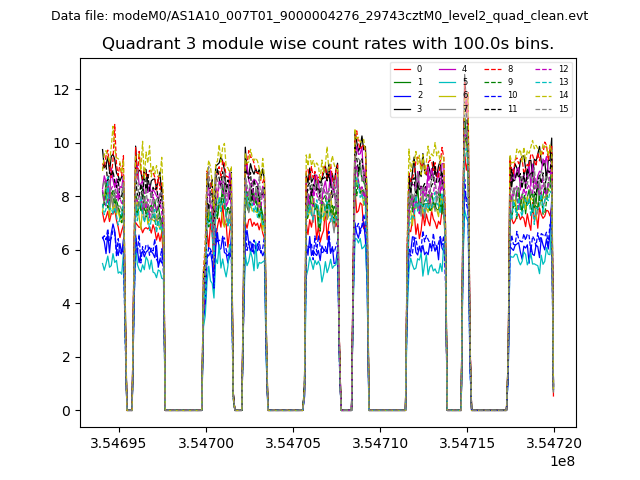 |
 |
| Parameter | Plot |
|---|---|
| CZT HV Monitor | 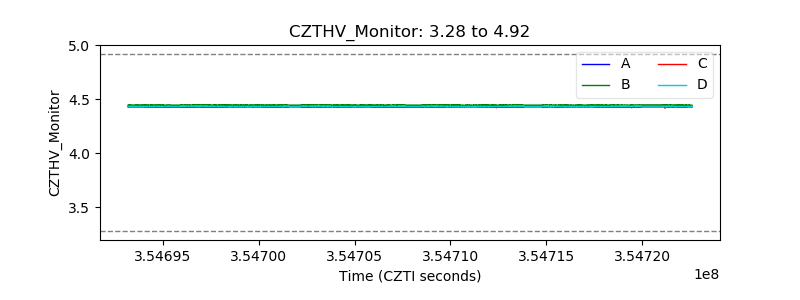 |
| D_VDD |  |
| Temperature 1 |  |
| Veto HV Monitor |  |
| Veto LLD |  |
| Alpha Counter | 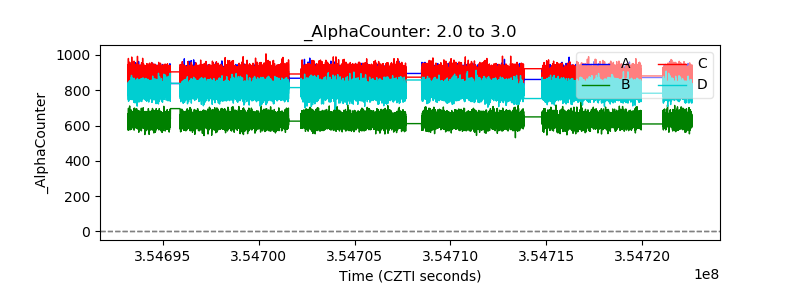 |
| _CPM_Rate | 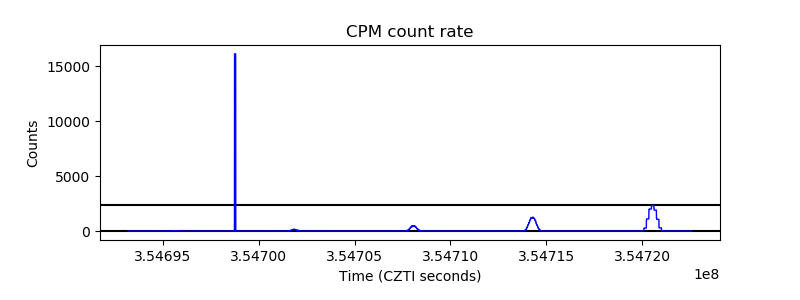 |
| CZT Counter |  |
| +2.5 Volts monitor |  |
| +5 Volts monitor |  |
| _ROLL_ROT | 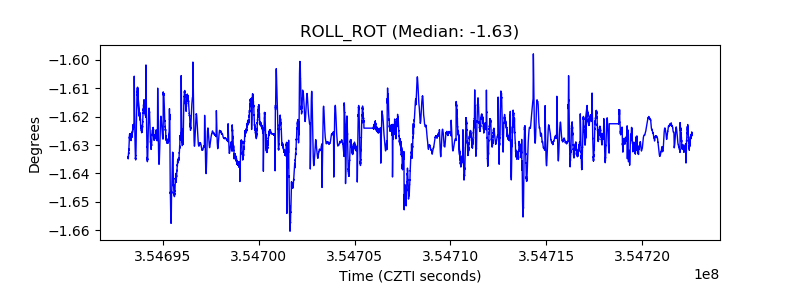 |
| _Roll_DEC | 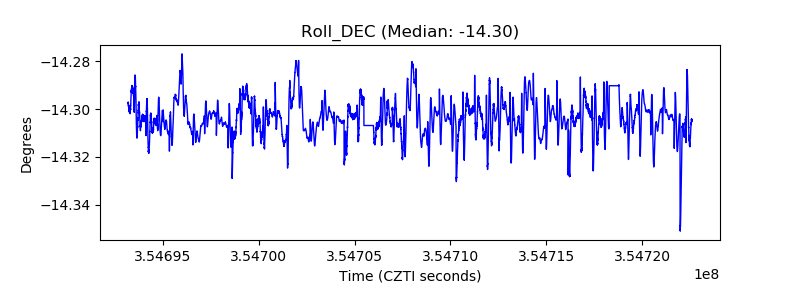 |
| _Roll_RA |  |
| Veto Counter | 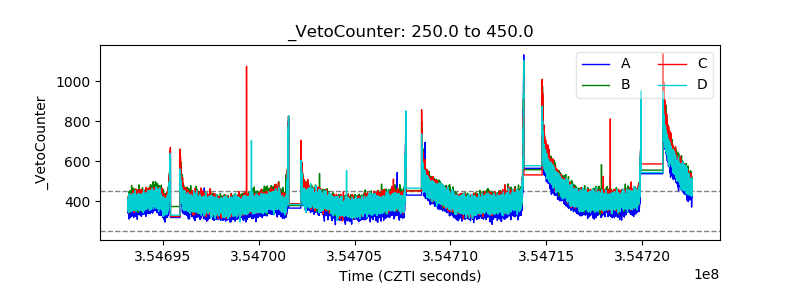 |