| Param | Original file | Final file |
|---|---|---|
| Filename | modeM0/AS1A10_007T01_9000004276_29744cztM0_level2.evt | modeM0/AS1A10_007T01_9000004276_29744cztM0_level2_quad_clean.evt |
| Size (bytes) | 594,884,160 | 66,709,440 |
| Size | 567.3 MB | 63.6 MB |
| Events in quadrant A | 3,513,920 | 401,652 |
| Events in quadrant B | 5,656,851 | 398,248 |
| Events in quadrant C | 3,785,693 | 389,696 |
| Events in quadrant D | 4,625,109 | 381,624 |
| Mode SS | |||
|---|---|---|---|
| Quadrant | BADHDUFLAG | Total packets | Discarded packets |
| A | 0 | 130 | 0 |
| B | 0 | 130 | 0 |
| C | 0 | 130 | 0 |
| D | 0 | 130 | 0 |
| Mode M0 | |||
|---|---|---|---|
| Quadrant | BADHDUFLAG | Total packets | Discarded packets |
| A | 0 | 14648 | 3 |
| B | 0 | 20947 | 2 |
| C | 0 | 15360 | 2 |
| D | 0 | 18285 | 2 |
| Mode M9 | |||
|---|---|---|---|
| Quadrant | BADHDUFLAG | Total packets | Discarded packets |
| A | 0 | 14 | 0 |
| B | 0 | 15 | 0 |
| C | 0 | 15 | 0 |
| D | 0 | 15 | 0 |
| Quadrant | Total seconds | Saturated seconds | Saturation percentage |
|---|---|---|---|
| A | 6431 | 82 | 1.275074% |
| B | 6431 | 201 | 3.125486% |
| C | 6431 | 163 | 2.534598% |
| D | 6431 | 95 | 1.477220% |
Noise dominated data is calculated using 1-second bins in cleaned event files. If a bin has >2000 counts, and if more than 50% of those come from <1% of pixels, then it is considered to be noise-dominated and hence unusable.
| Quadrant | # 1 sec bins | Bins with >0 counts | Bins with >2000 counts | High rate bins dominated by noise | Noise dominated (total time) | Noise dominated (detector-on time) | Marked lightcurve |
|---|---|---|---|---|---|---|---|
| A | 7636 | 6431 | 0 | 0 | 0.00% | 0.00% | 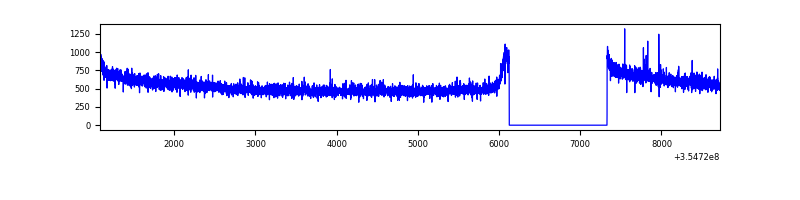 |
| B | 7636 | 6431 | 38 | 38 | 0.50% | 0.59% | 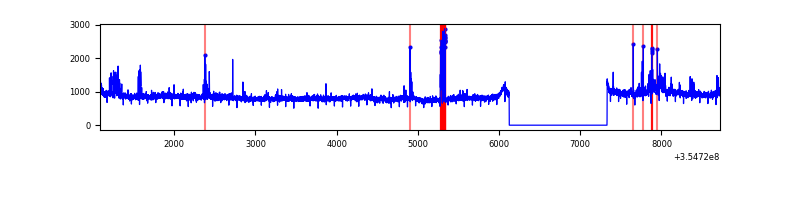 |
| C | 7636 | 6431 | 6 | 6 | 0.08% | 0.09% | 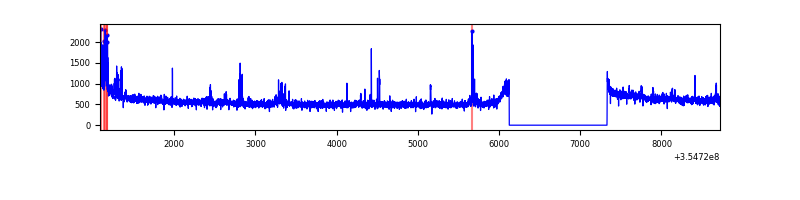 |
| D | 7636 | 6431 | 35 | 35 | 0.46% | 0.54% | 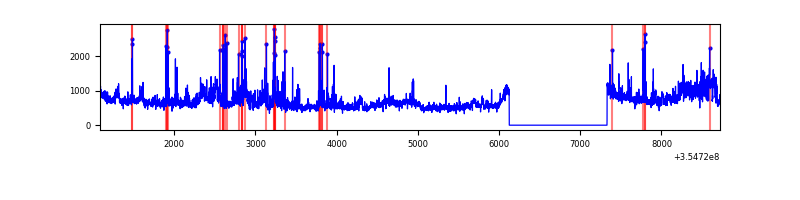 |
Top three noisy pixels from each quadrant. If the there are fewer than three noisy pixels in the level2.evt file, extra rows are filled as -1
| Pixel properties | Quadrant properties | ||||||
|---|---|---|---|---|---|---|---|
| Quadrant | DetID | PixID | Counts | Sigma | Mean | Median | Sigma |
| A | 12 | 96 | 13290 | 69.73 | 905 | 891 | 177.8 |
| A | 13 | 254 | 12674 | 66.26 | 905 | 891 | 177.8 |
| A | 3 | 137 | 8296 | 41.64 | 905 | 891 | 177.8 |
| B | 6 | 159 | 1878272 | 11159.3 | 890 | 868 | 168.2 |
| B | 0 | 229 | 210670 | 1247.06 | 890 | 868 | 168.2 |
| B | 0 | 190 | 46179 | 269.33 | 890 | 868 | 168.2 |
| C | 3 | 233 | 169131 | 849.66 | 862 | 872 | 198.0 |
| C | 14 | 238 | 141425 | 709.75 | 862 | 872 | 198.0 |
| C | 10 | 22 | 71696 | 357.64 | 862 | 872 | 198.0 |
| D | 8 | 195 | 953600 | 4671.29 | 873 | 852 | 204.0 |
| D | 7 | 80 | 199217 | 972.58 | 873 | 852 | 204.0 |
| D | 13 | 153 | 54864 | 264.82 | 873 | 852 | 204.0 |
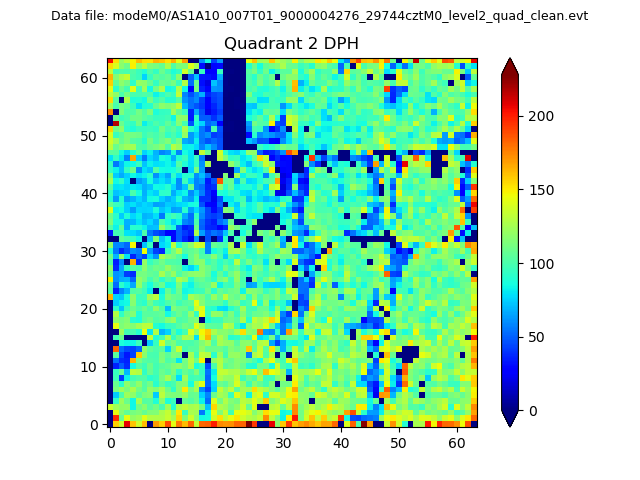
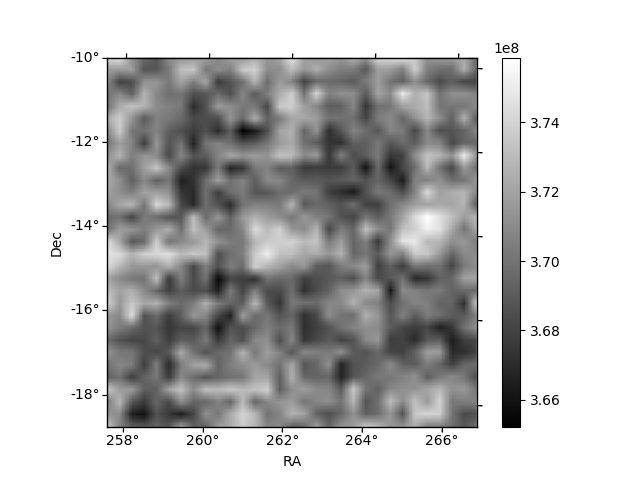
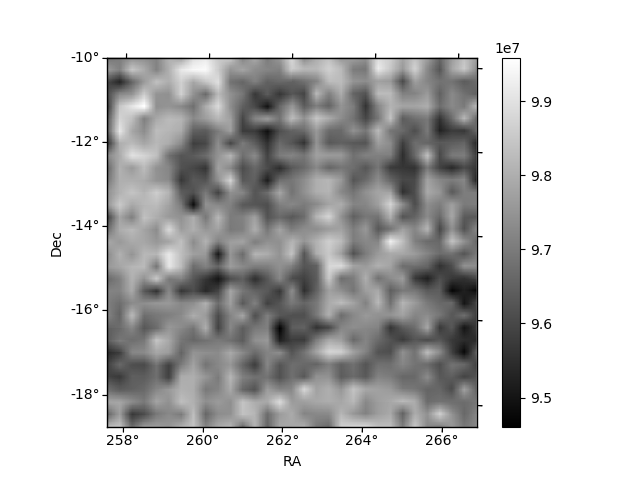
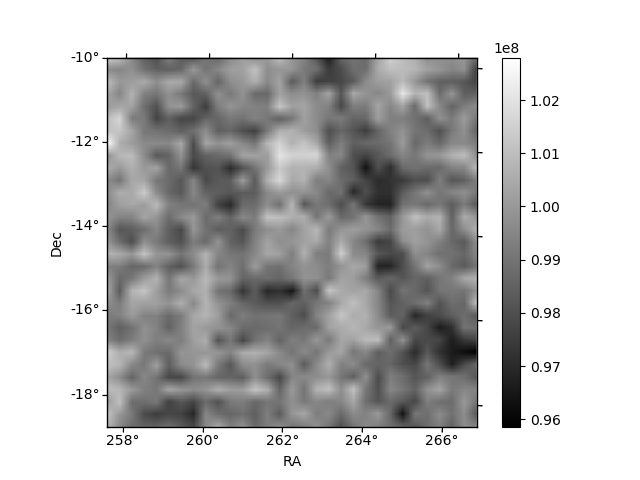
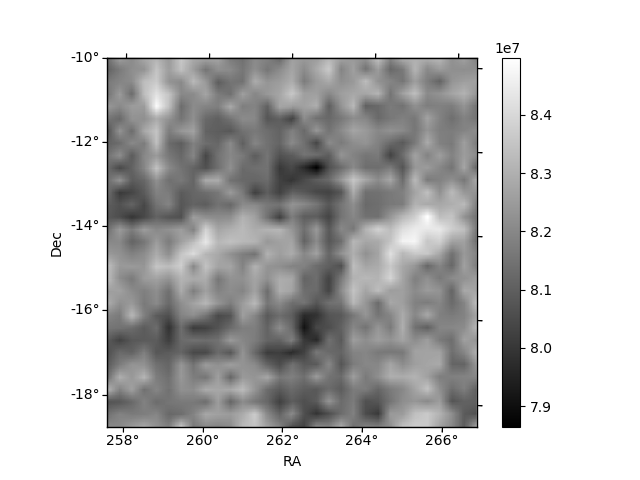
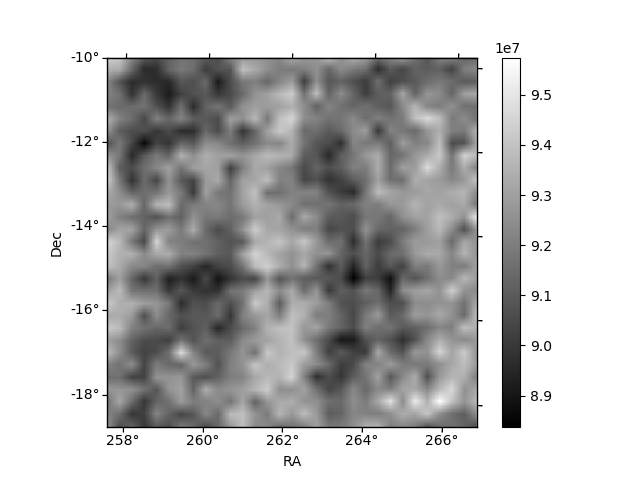
Histogram calculated using DETX and DETY for each event in the final _common_clean file
| Quadrant A | 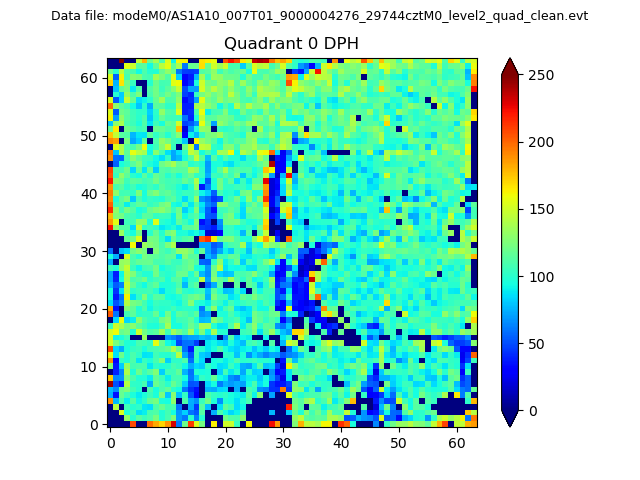 |
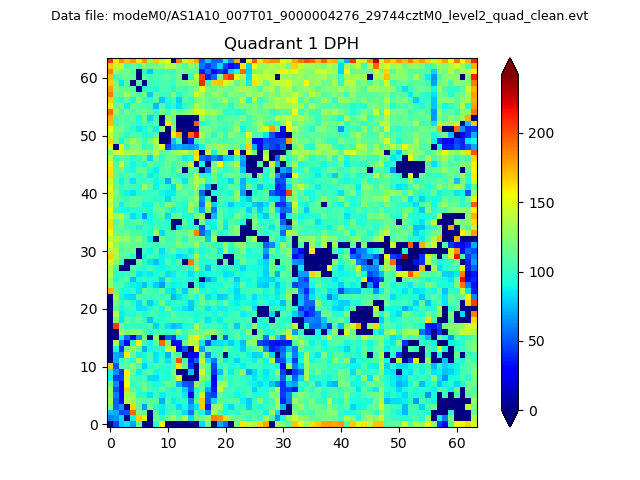 |
Quadrant B |
|---|---|---|---|
| Quadrant D | 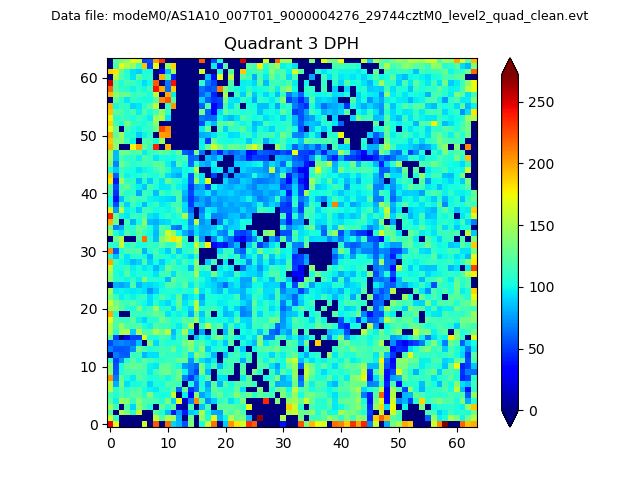 |
 |
Quadrant C |
| Plot type | Count rate plots | Images |
|---|---|---|
| Comparison with Poisson distribution Blue bars denote a histogram of data divided into 1 sec bins. Red curve is a Poisson curve with rate = median count rate of data. |
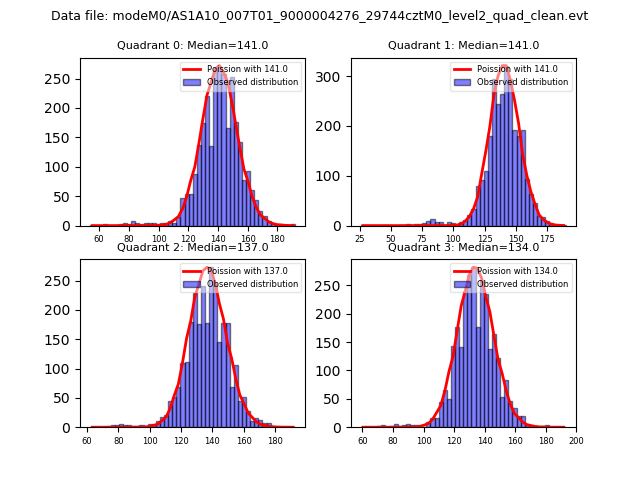 |
 |
| Quadrant-wise count rates Data is divided into 100 sec bins |
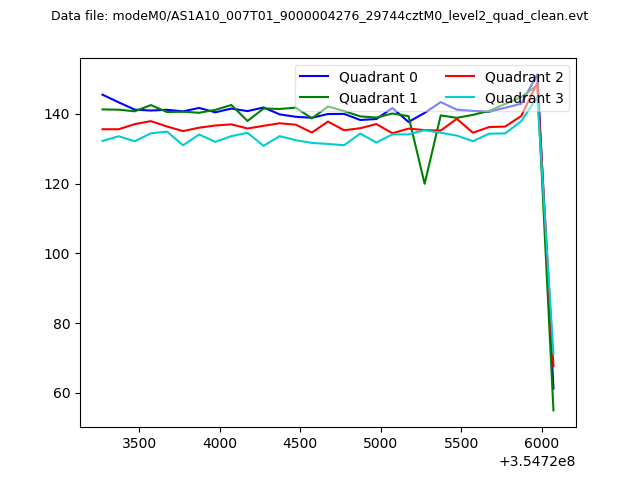 |
|
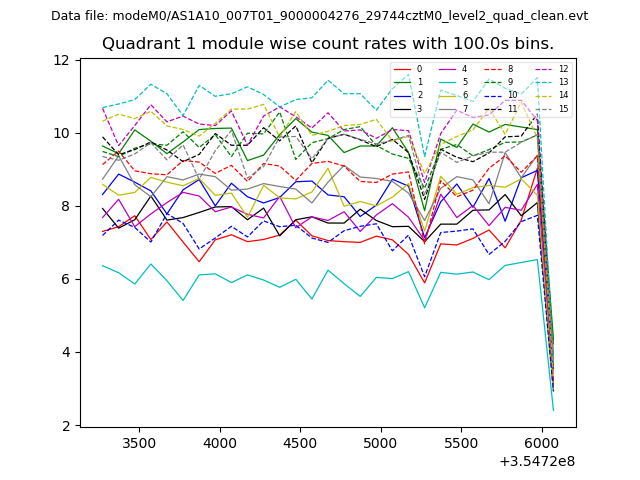
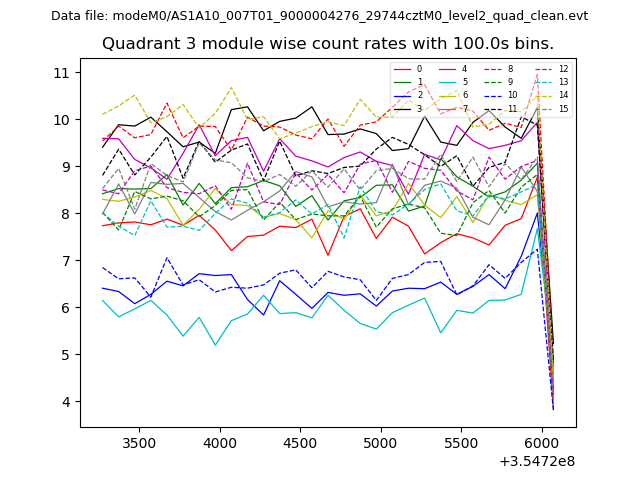
| Module-wise count rates for Quadrant A Data is divided into 100 sec bins |
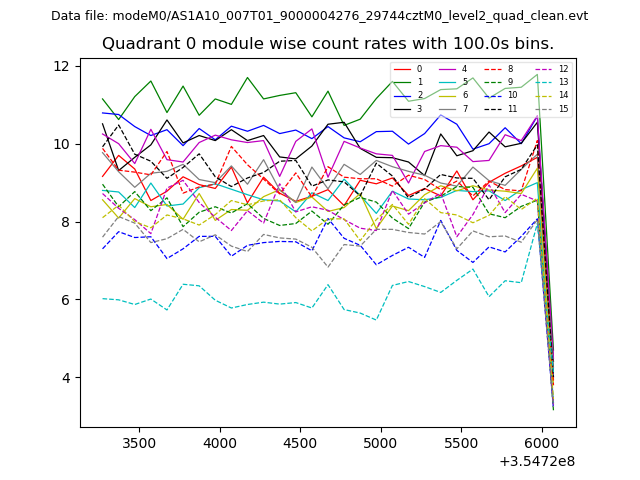 |
 |
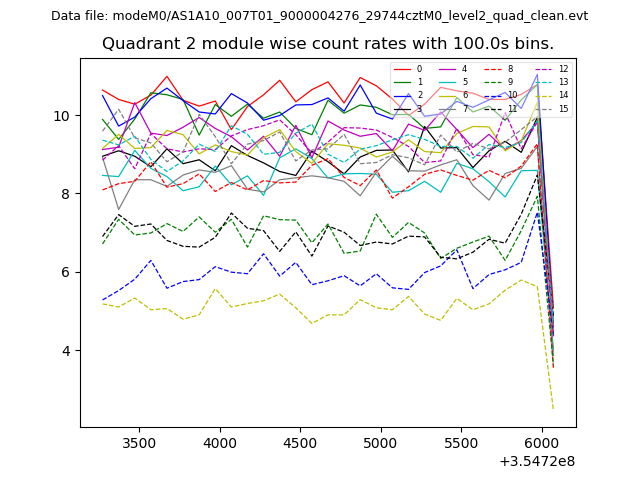
| Module-wise count rates for Quadrant B Data is divided into 100 sec bins |
 |
 |
| Module-wise count rates for Quadrant C Data is divided into 100 sec bins |
 |
 |
| Module-wise count rates for Quadrant D Data is divided into 100 sec bins |
 |
 |
| Parameter | Plot |
|---|---|
| CZT HV Monitor |  |
| D_VDD | 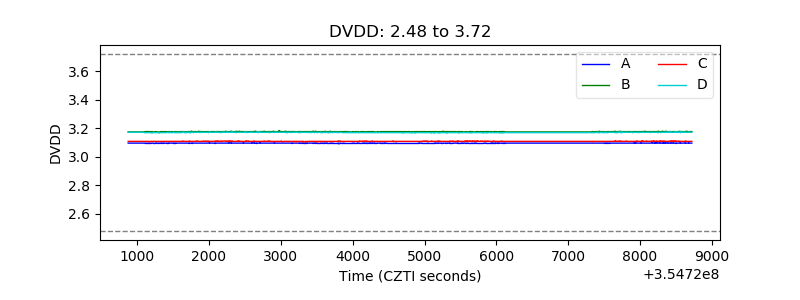 |
| Temperature 1 |  |
| Veto HV Monitor | 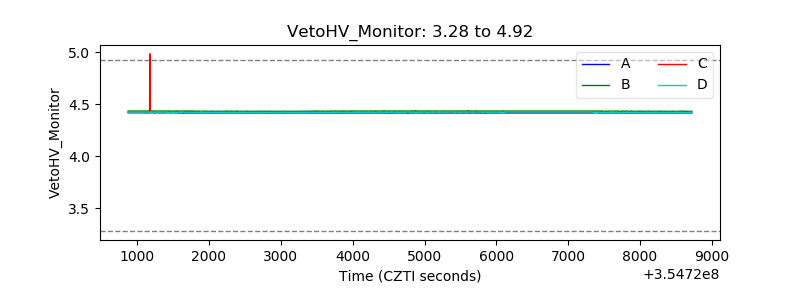 |
| Veto LLD |  |
| Alpha Counter | 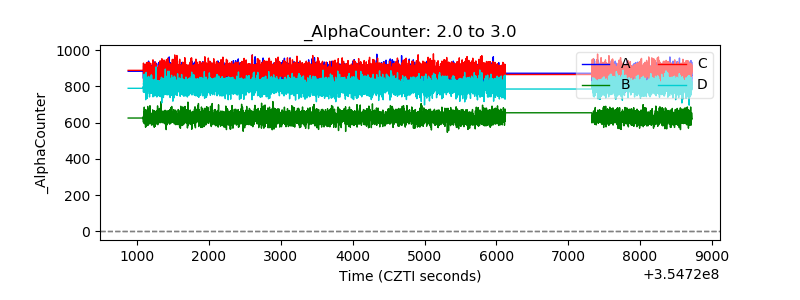 |
| _CPM_Rate | 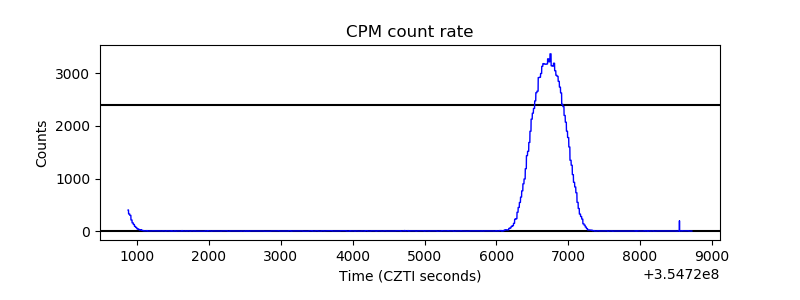 |
| CZT Counter | 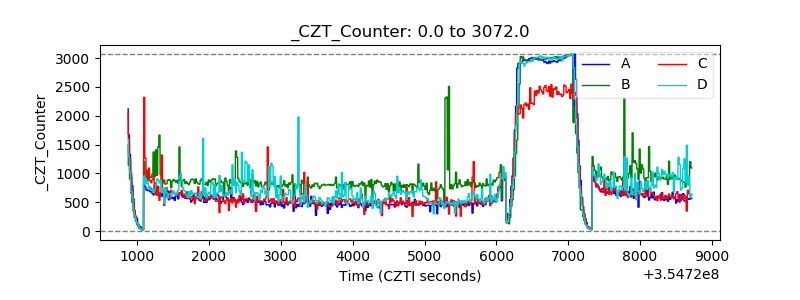 |
| +2.5 Volts monitor |  |
| +5 Volts monitor |  |
| _ROLL_ROT | 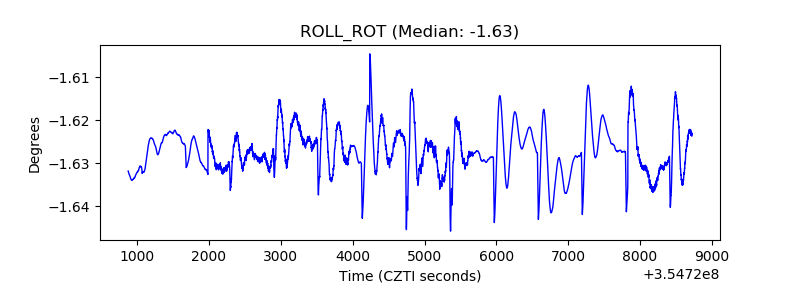 |
| _Roll_DEC | 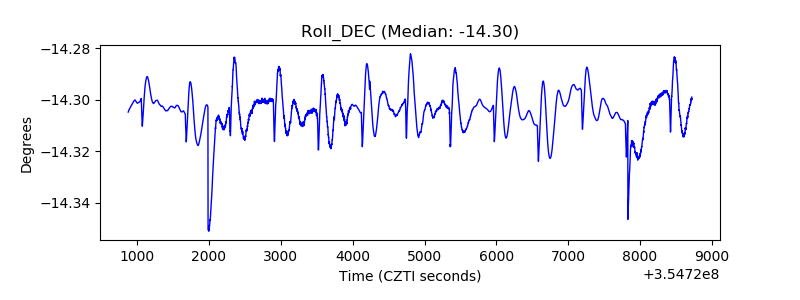 |
| _Roll_RA | 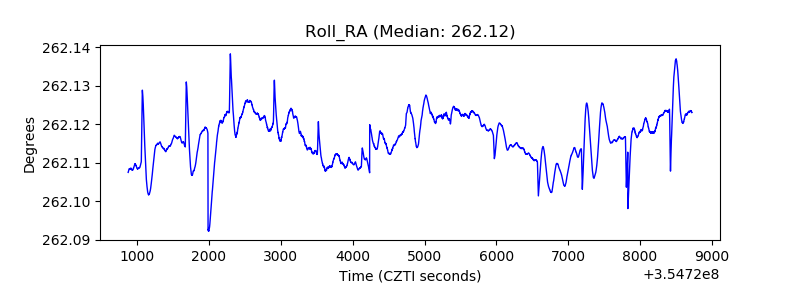 |
| Veto Counter | 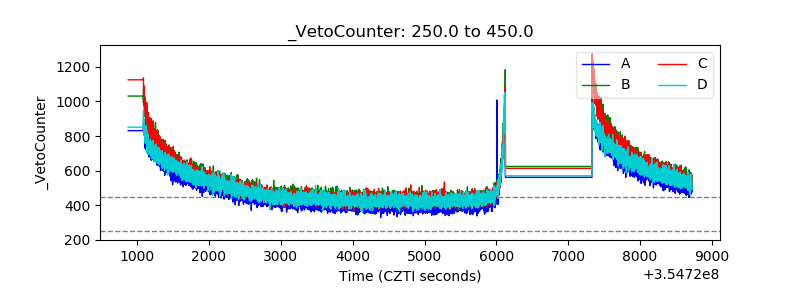 |