| Param | Original file | Final file |
|---|---|---|
| Filename | modeM0/AS1A10_007T01_9000004276_29745cztM0_level2.evt | modeM0/AS1A10_007T01_9000004276_29745cztM0_level2_quad_clean.evt |
| Size (bytes) | 550,048,320 | 74,162,880 |
| Size | 524.6 MB | 70.7 MB |
| Events in quadrant A | 3,216,112 | 470,724 |
| Events in quadrant B | 5,211,012 | 473,134 |
| Events in quadrant C | 3,548,453 | 454,063 |
| Events in quadrant D | 4,288,602 | 440,585 |
| Mode SS | |||
|---|---|---|---|
| Quadrant | BADHDUFLAG | Total packets | Discarded packets |
| A | 0 | 120 | 0 |
| B | 0 | 120 | 0 |
| C | 0 | 120 | 0 |
| D | 0 | 120 | 0 |
| Mode M0 | |||
|---|---|---|---|
| Quadrant | BADHDUFLAG | Total packets | Discarded packets |
| A | 0 | 13301 | 1 |
| B | 0 | 19442 | 1 |
| C | 0 | 14304 | 1 |
| D | 0 | 16823 | 1 |
| Mode M9 | |||
|---|---|---|---|
| Quadrant | BADHDUFLAG | Total packets | Discarded packets |
| A | 0 | 12 | 0 |
| B | 0 | 12 | 0 |
| C | 0 | 12 | 0 |
| D | 0 | 12 | 0 |
| Quadrant | Total seconds | Saturated seconds | Saturation percentage |
|---|---|---|---|
| A | 5821 | 91 | 1.563305% |
| B | 5821 | 168 | 2.886102% |
| C | 5821 | 168 | 2.886102% |
| D | 5821 | 160 | 2.748669% |
Noise dominated data is calculated using 1-second bins in cleaned event files. If a bin has >2000 counts, and if more than 50% of those come from <1% of pixels, then it is considered to be noise-dominated and hence unusable.
| Quadrant | # 1 sec bins | Bins with >0 counts | Bins with >2000 counts | High rate bins dominated by noise | Noise dominated (total time) | Noise dominated (detector-on time) | Marked lightcurve |
|---|---|---|---|---|---|---|---|
| A | 7096 | 5821 | 0 | 0 | 0.00% | 0.00% | 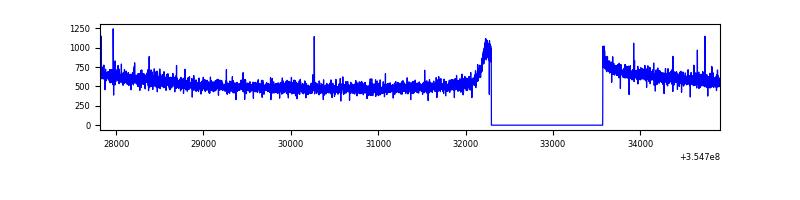 |
| B | 7096 | 5821 | 8 | 8 | 0.11% | 0.14% | 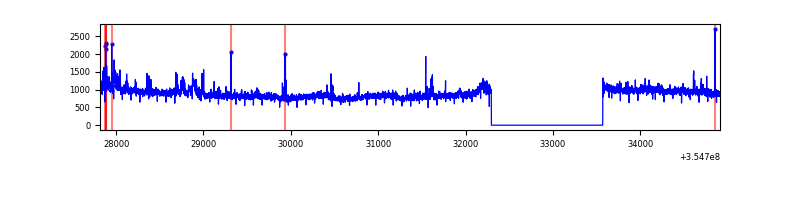 |
| C | 7096 | 5821 | 31 | 31 | 0.44% | 0.53% | 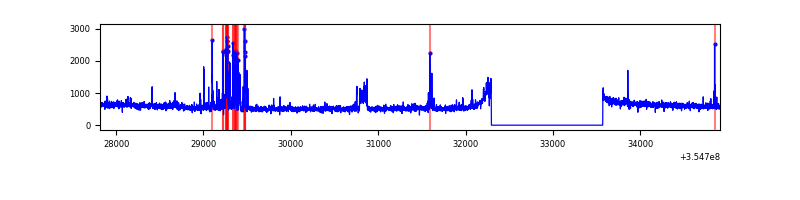 |
| D | 7096 | 5821 | 82 | 82 | 1.16% | 1.41% | 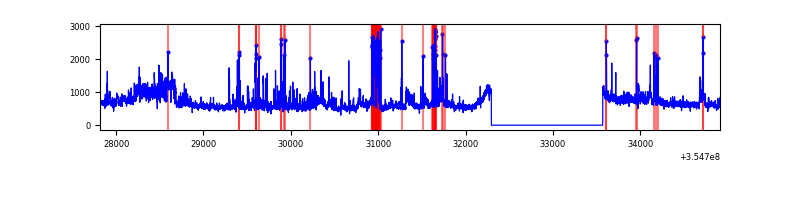 |
Top three noisy pixels from each quadrant. If the there are fewer than three noisy pixels in the level2.evt file, extra rows are filled as -1
| Pixel properties | Quadrant properties | ||||||
|---|---|---|---|---|---|---|---|
| Quadrant | DetID | PixID | Counts | Sigma | Mean | Median | Sigma |
| A | 13 | 254 | 11565 | 65.38 | 828 | 815 | 164.4 |
| A | 12 | 96 | 11552 | 65.3 | 828 | 815 | 164.4 |
| A | 12 | 16 | 8275 | 45.37 | 828 | 815 | 164.4 |
| B | 6 | 159 | 1760820 | 11477.2 | 819 | 801 | 153.3 |
| B | 0 | 229 | 197508 | 1282.74 | 819 | 801 | 153.3 |
| B | 3 | 209 | 18573 | 115.89 | 819 | 801 | 153.3 |
| C | 10 | 22 | 159819 | 875.27 | 790 | 798 | 181.7 |
| C | 14 | 238 | 131466 | 719.21 | 790 | 798 | 181.7 |
| C | 3 | 233 | 97601 | 532.82 | 790 | 798 | 181.7 |
| D | 8 | 195 | 749839 | 4050.06 | 795 | 779 | 185.0 |
| D | 7 | 80 | 313979 | 1693.43 | 795 | 779 | 185.0 |
| D | 1 | 52 | 161824 | 870.75 | 795 | 779 | 185.0 |
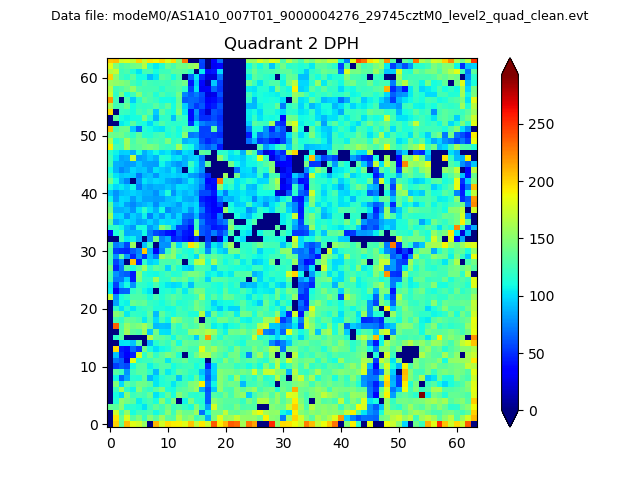
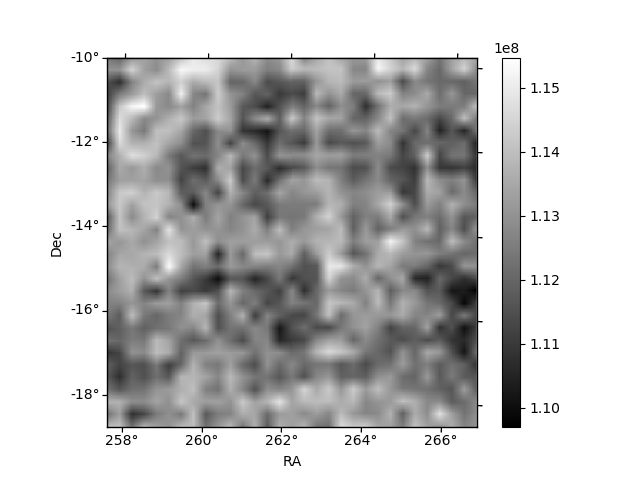
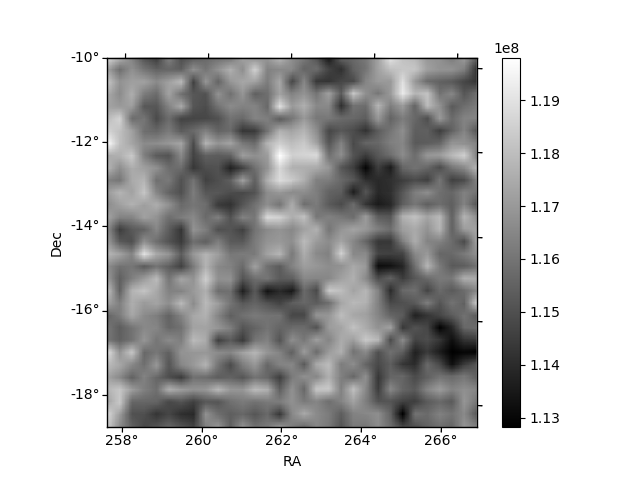
Histogram calculated using DETX and DETY for each event in the final _common_clean file
| Quadrant A | 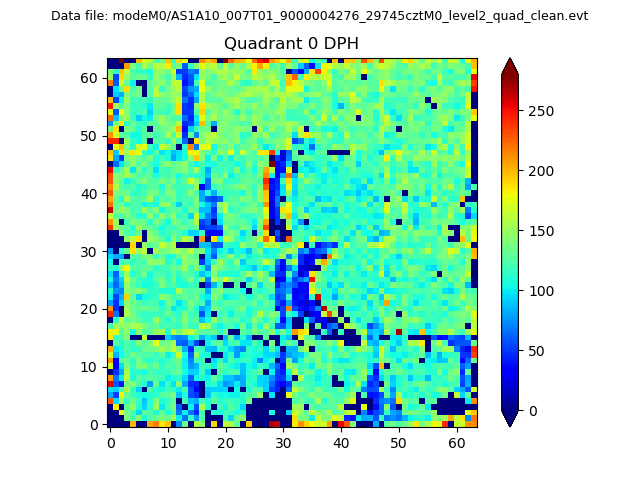 |
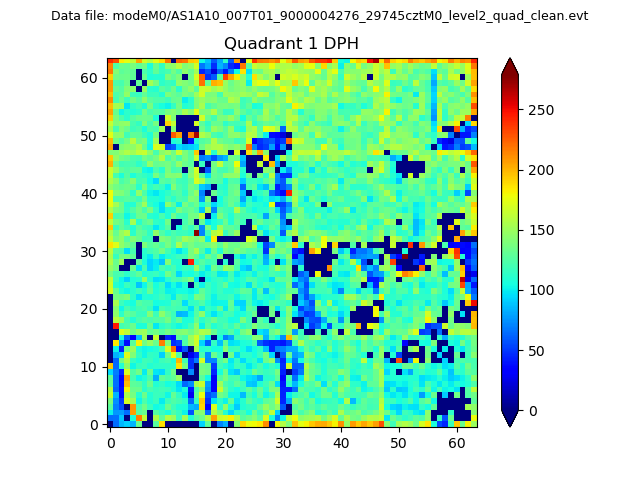 |
Quadrant B |
|---|---|---|---|
| Quadrant D | 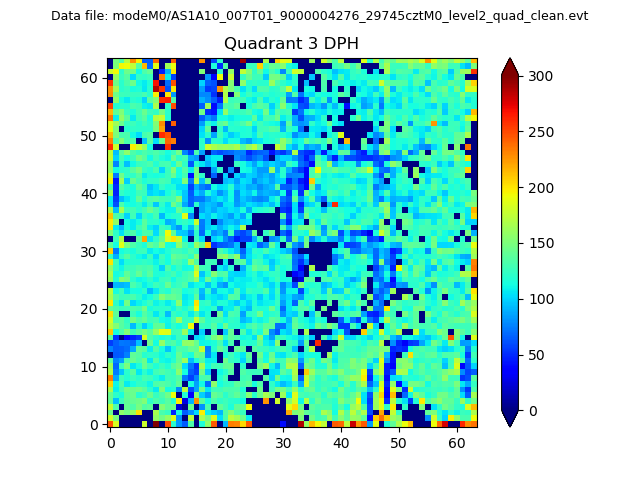 |
 |
Quadrant C |
| Plot type | Count rate plots | Images |
|---|---|---|
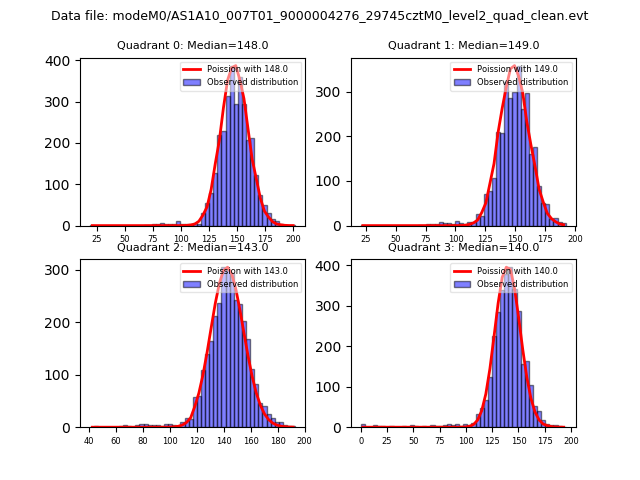
| Comparison with Poisson distribution Blue bars denote a histogram of data divided into 1 sec bins. Red curve is a Poisson curve with rate = median count rate of data. |
 |
 |
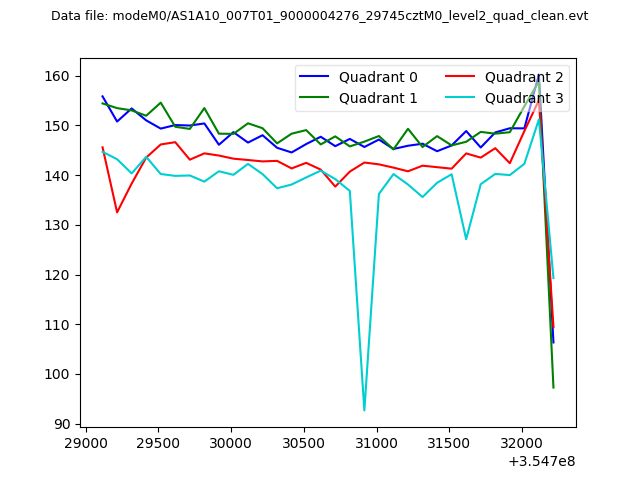
| Quadrant-wise count rates Data is divided into 100 sec bins |
 |
|
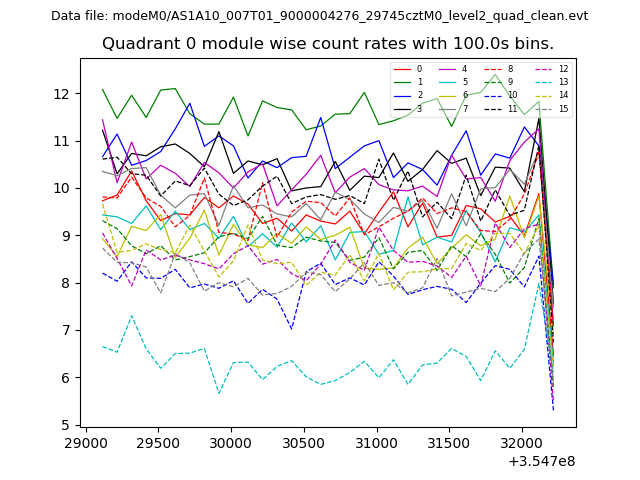
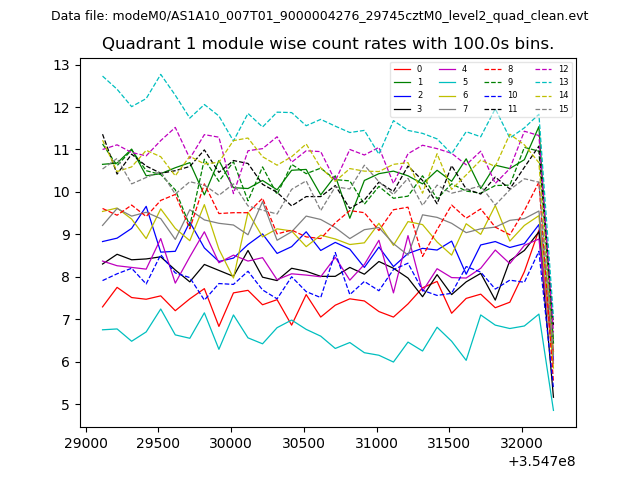
| Module-wise count rates for Quadrant A Data is divided into 100 sec bins |
 |
 |
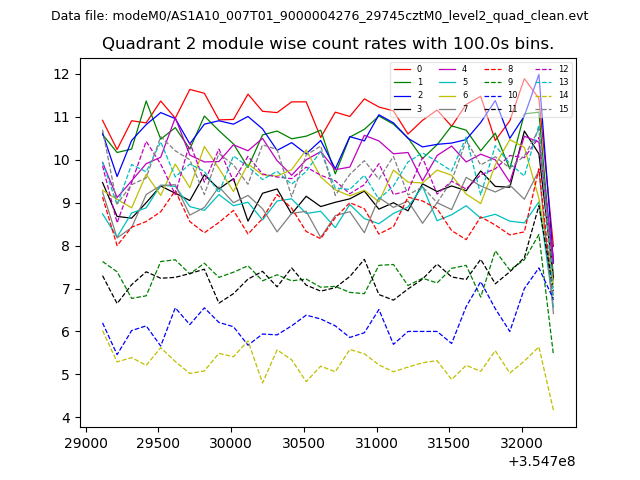
| Module-wise count rates for Quadrant B Data is divided into 100 sec bins |
 |
 |
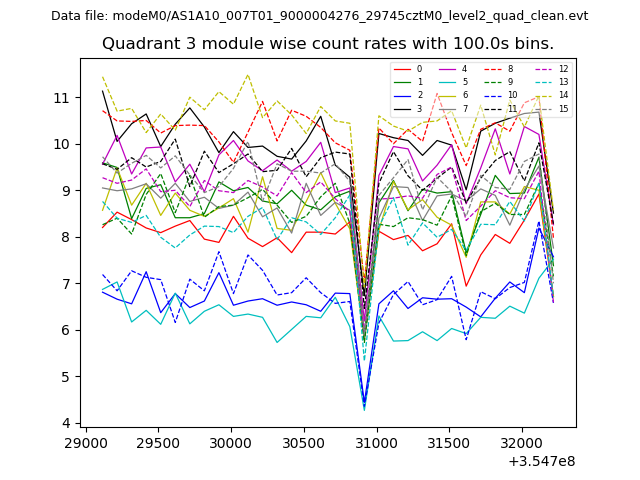
| Module-wise count rates for Quadrant C Data is divided into 100 sec bins |
 |
 |
| Module-wise count rates for Quadrant D Data is divided into 100 sec bins |
 |
 |
| Parameter | Plot |
|---|---|
| CZT HV Monitor | 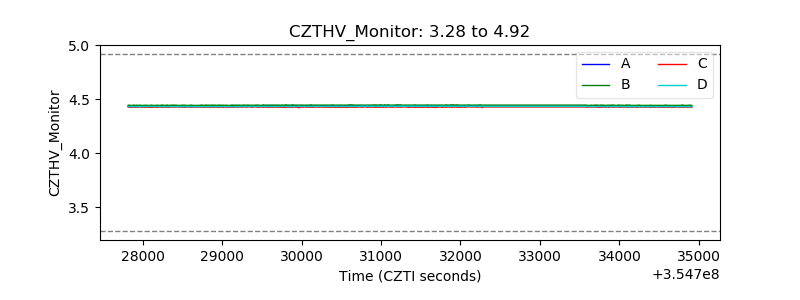 |
| D_VDD | 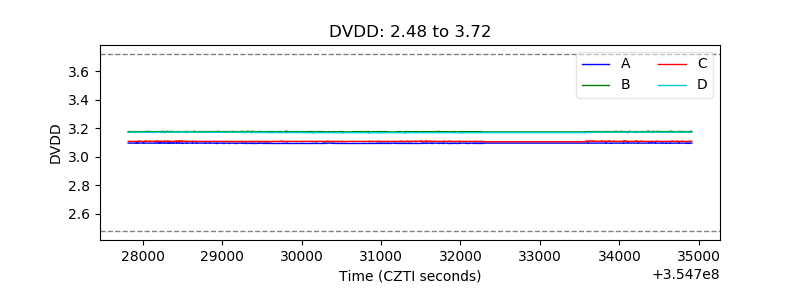 |
| Temperature 1 |  |
| Veto HV Monitor |  |
| Veto LLD | 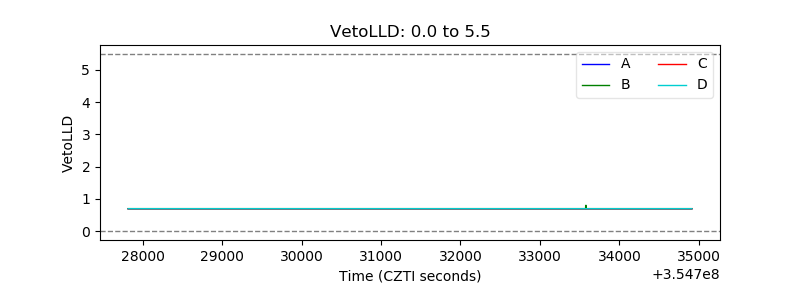 |
| Alpha Counter | 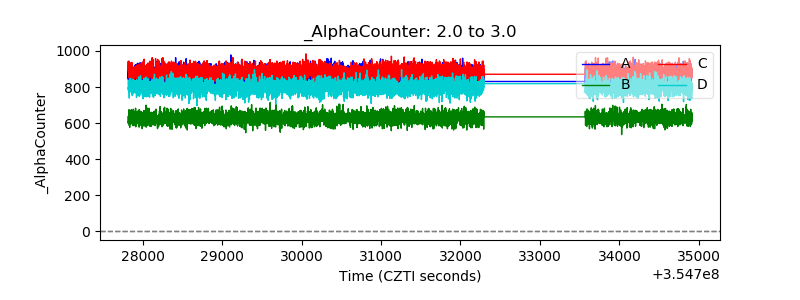 |
| _CPM_Rate | 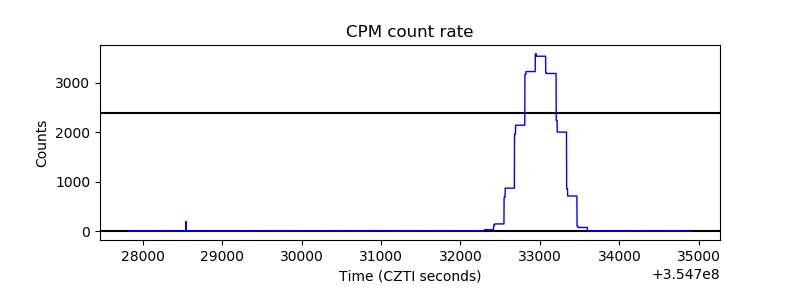 |
| CZT Counter | 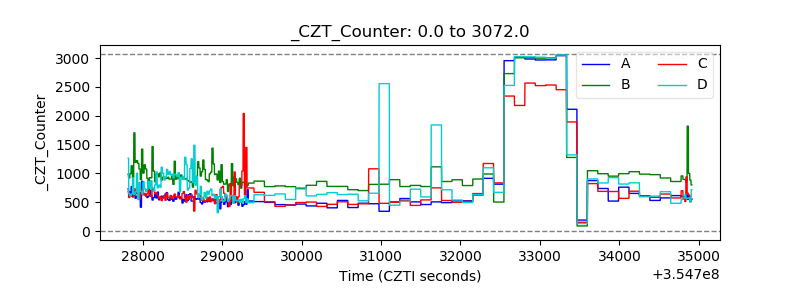 |
| +2.5 Volts monitor |  |
| +5 Volts monitor |  |
| _ROLL_ROT | 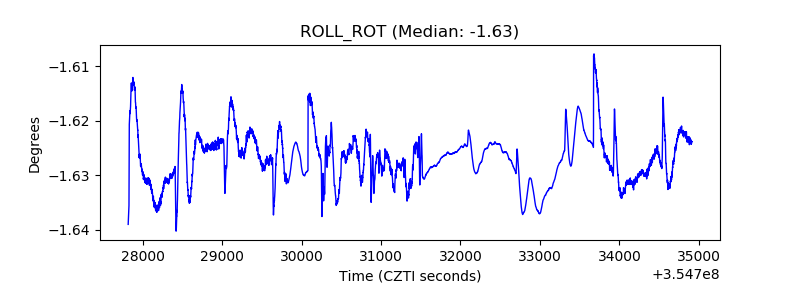 |
| _Roll_DEC | 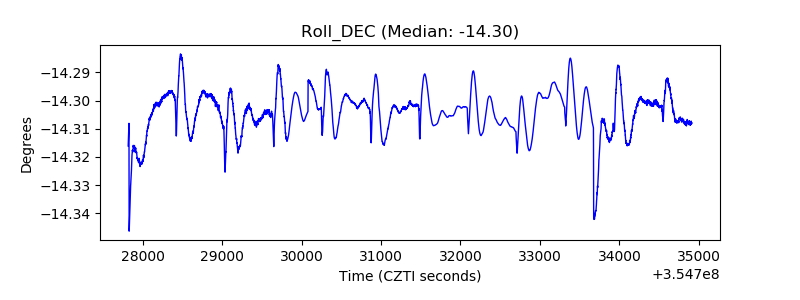 |
| _Roll_RA | 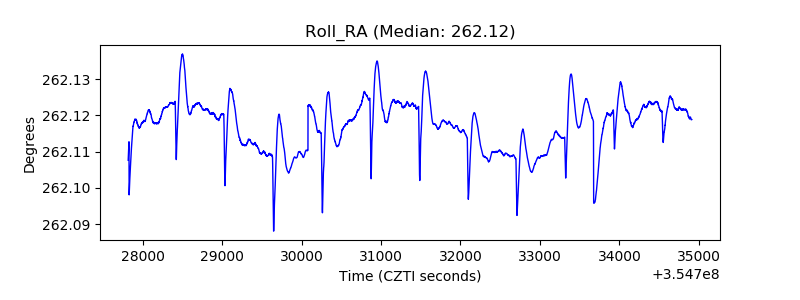 |
| Veto Counter | 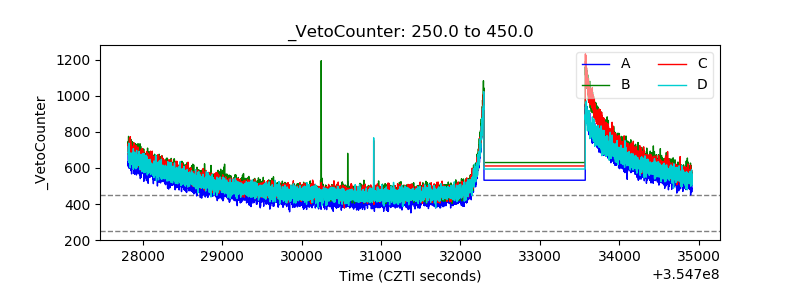 |