| Param | Original file | Final file |
|---|---|---|
| Filename | modeM0/AS1A10_007T01_9000004276_29746cztM0_level2.evt | modeM0/AS1A10_007T01_9000004276_29746cztM0_level2_quad_clean.evt |
| Size (bytes) | 572,987,520 | 88,974,720 |
| Size | 546.4 MB | 84.9 MB |
| Events in quadrant A | 3,443,438 | 578,062 |
| Events in quadrant B | 5,429,269 | 581,256 |
| Events in quadrant C | 3,769,692 | 558,616 |
| Events in quadrant D | 4,295,436 | 547,835 |
| Mode SS | |||
|---|---|---|---|
| Quadrant | BADHDUFLAG | Total packets | Discarded packets |
| A | 0 | 126 | 0 |
| B | 0 | 126 | 0 |
| C | 0 | 126 | 0 |
| D | 0 | 126 | 0 |
| Mode M0 | |||
|---|---|---|---|
| Quadrant | BADHDUFLAG | Total packets | Discarded packets |
| A | 0 | 14155 | 1 |
| B | 0 | 20136 | 1 |
| C | 0 | 15239 | 1 |
| D | 0 | 17027 | 1 |
| Mode M9 | |||
|---|---|---|---|
| Quadrant | BADHDUFLAG | Total packets | Discarded packets |
| A | 0 | 13 | 0 |
| B | 0 | 13 | 0 |
| C | 0 | 13 | 0 |
| D | 0 | 13 | 0 |
| Quadrant | Total seconds | Saturated seconds | Saturation percentage |
|---|---|---|---|
| A | 6134 | 72 | 1.173785% |
| B | 6134 | 191 | 3.113792% |
| C | 6135 | 206 | 3.357783% |
| D | 6135 | 169 | 2.754686% |
Noise dominated data is calculated using 1-second bins in cleaned event files. If a bin has >2000 counts, and if more than 50% of those come from <1% of pixels, then it is considered to be noise-dominated and hence unusable.
| Quadrant | # 1 sec bins | Bins with >0 counts | Bins with >2000 counts | High rate bins dominated by noise | Noise dominated (total time) | Noise dominated (detector-on time) | Marked lightcurve |
|---|---|---|---|---|---|---|---|
| A | 7479 | 6134 | 0 | 0 | 0.00% | 0.00% | 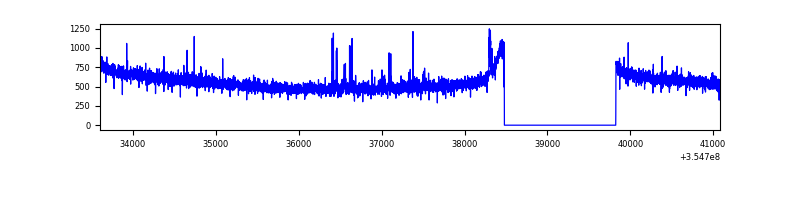 |
| B | 7479 | 6134 | 18 | 18 | 0.24% | 0.29% | 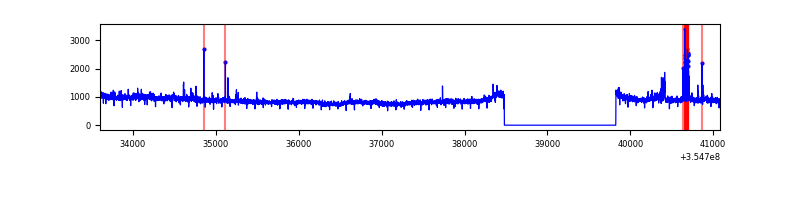 |
| C | 7480 | 6135 | 38 | 38 | 0.51% | 0.62% | 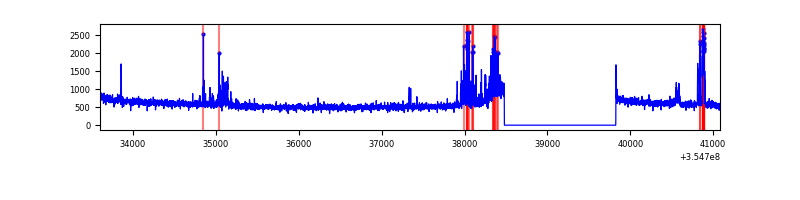 |
| D | 7480 | 6135 | 129 | 129 | 1.72% | 2.10% | 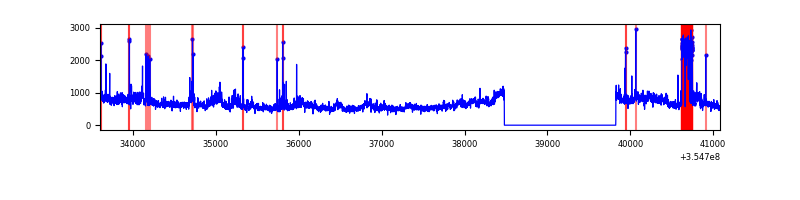 |
Top three noisy pixels from each quadrant. If the there are fewer than three noisy pixels in the level2.evt file, extra rows are filled as -1
| Pixel properties | Quadrant properties | ||||||
|---|---|---|---|---|---|---|---|
| Quadrant | DetID | PixID | Counts | Sigma | Mean | Median | Sigma |
| A | 12 | 16 | 46149 | 259.31 | 878 | 865 | 174.6 |
| A | 12 | 194 | 12450 | 66.34 | 878 | 865 | 174.6 |
| A | 13 | 254 | 12225 | 65.05 | 878 | 865 | 174.6 |
| B | 6 | 159 | 1850571 | 11355.0 | 873 | 854 | 162.9 |
| B | 0 | 229 | 128168 | 781.55 | 873 | 854 | 162.9 |
| B | 12 | 111 | 18777 | 110.03 | 873 | 854 | 162.9 |
| C | 10 | 22 | 249595 | 1282.02 | 840 | 851 | 194.0 |
| C | 14 | 238 | 138246 | 708.13 | 840 | 851 | 194.0 |
| C | 15 | 208 | 45696 | 231.13 | 840 | 851 | 194.0 |
| D | 8 | 195 | 731940 | 3702.75 | 841 | 820 | 197.5 |
| D | 2 | 225 | 253143 | 1277.89 | 841 | 820 | 197.5 |
| D | 7 | 80 | 45496 | 226.26 | 841 | 820 | 197.5 |
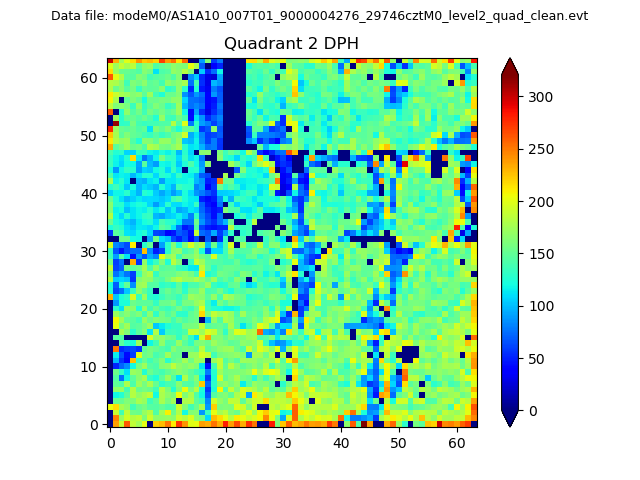
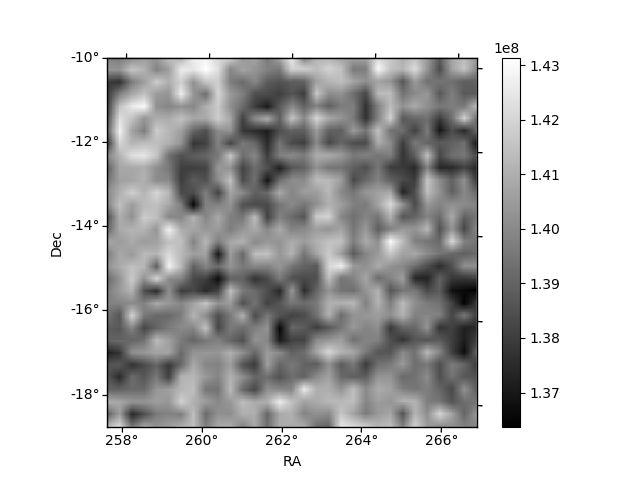
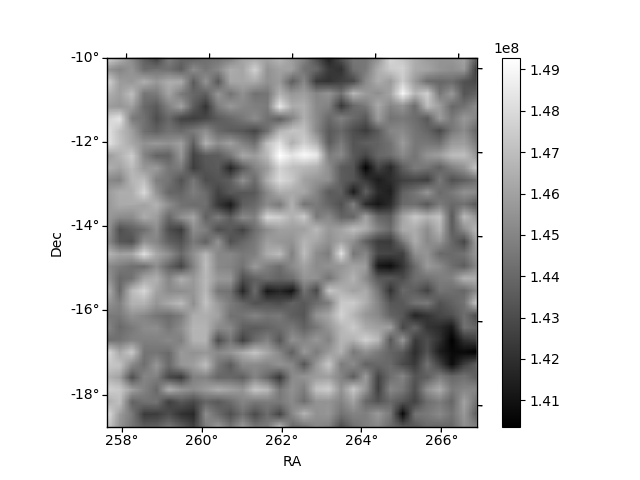
Histogram calculated using DETX and DETY for each event in the final _common_clean file
| Quadrant A | 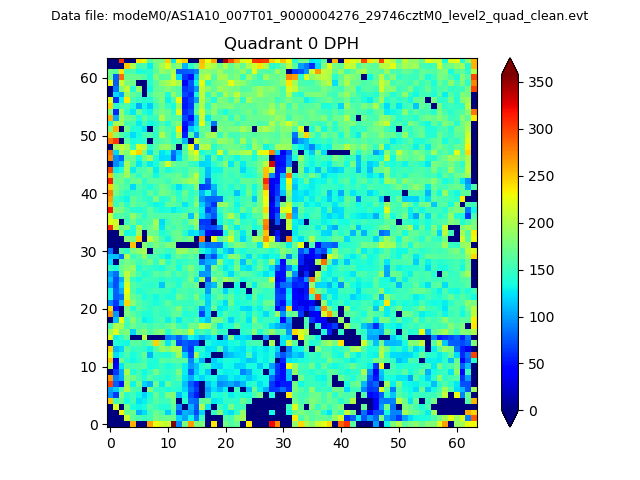 |
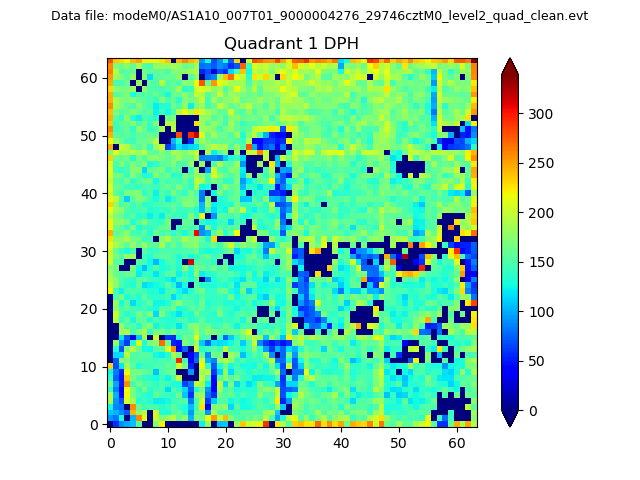 |
Quadrant B |
|---|---|---|---|
| Quadrant D | 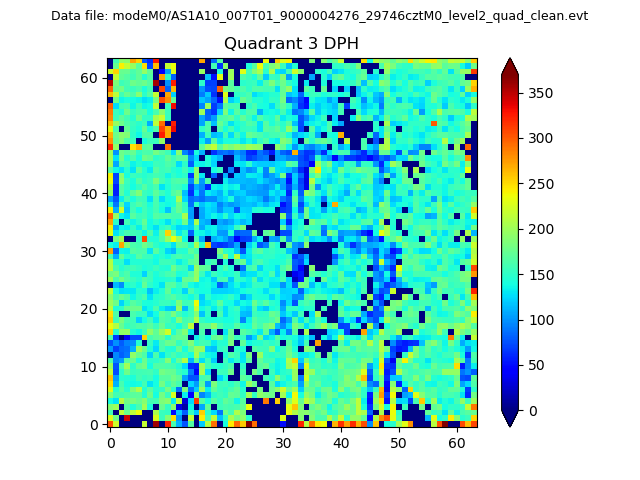 |
 |
Quadrant C |
| Plot type | Count rate plots | Images |
|---|---|---|
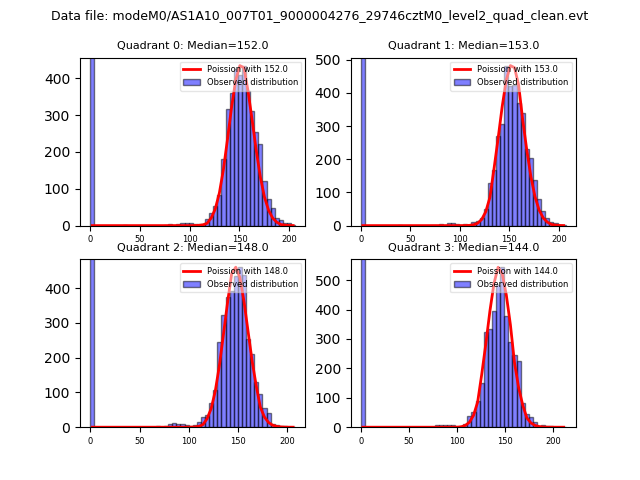
| Comparison with Poisson distribution Blue bars denote a histogram of data divided into 1 sec bins. Red curve is a Poisson curve with rate = median count rate of data. |
 |
 |
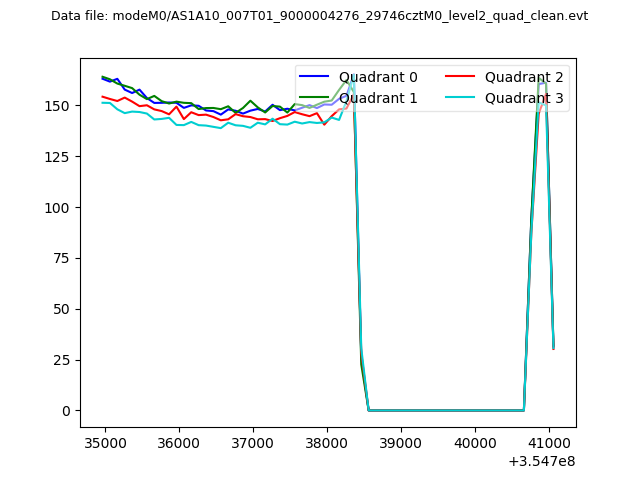
| Quadrant-wise count rates Data is divided into 100 sec bins |
 |
|
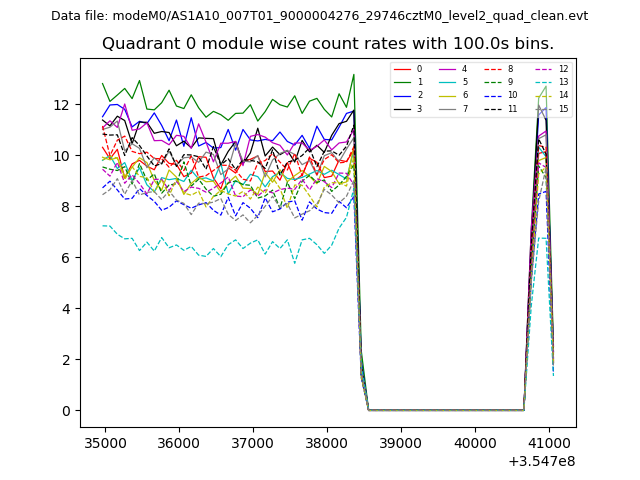
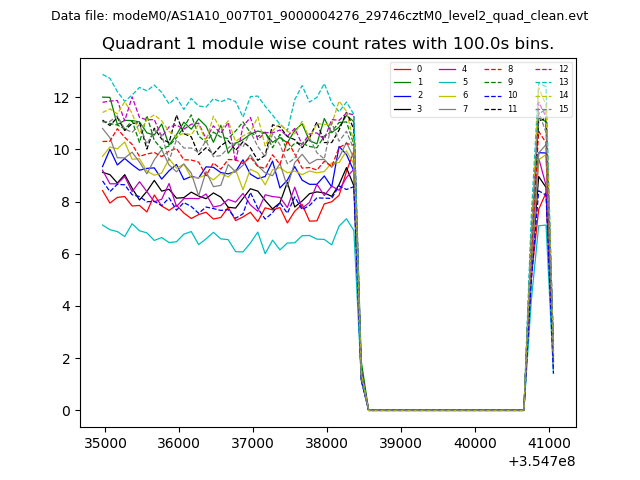
| Module-wise count rates for Quadrant A Data is divided into 100 sec bins |
 |
 |
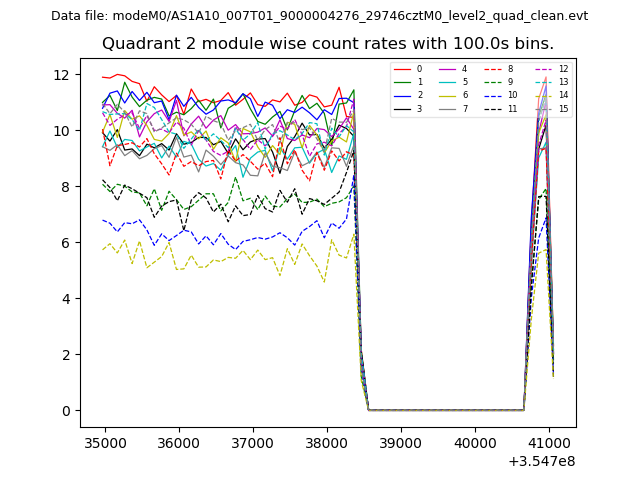
| Module-wise count rates for Quadrant B Data is divided into 100 sec bins |
 |
 |
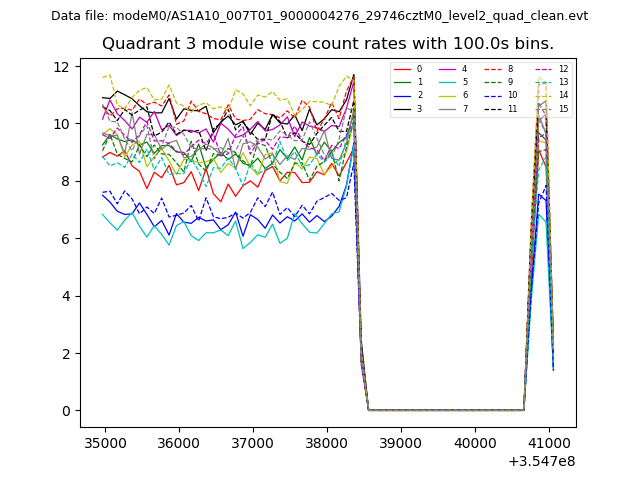
| Module-wise count rates for Quadrant C Data is divided into 100 sec bins |
 |
 |
| Module-wise count rates for Quadrant D Data is divided into 100 sec bins |
 |
 |
| Parameter | Plot |
|---|---|
| CZT HV Monitor |  |
| D_VDD | 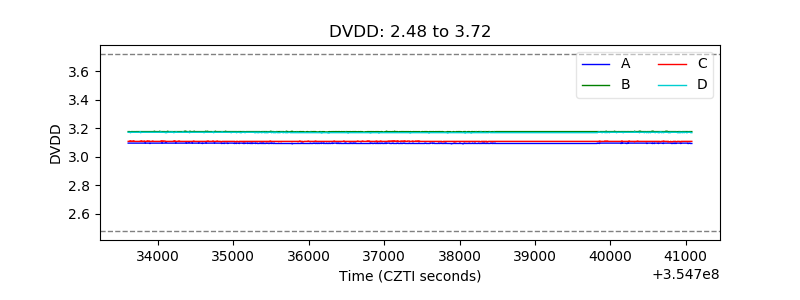 |
| Temperature 1 |  |
| Veto HV Monitor | 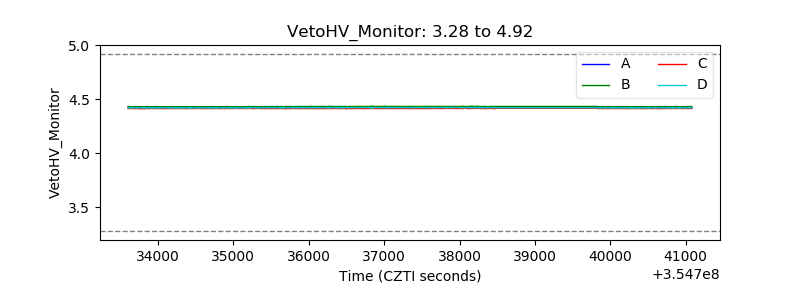 |
| Veto LLD |  |
| Alpha Counter | 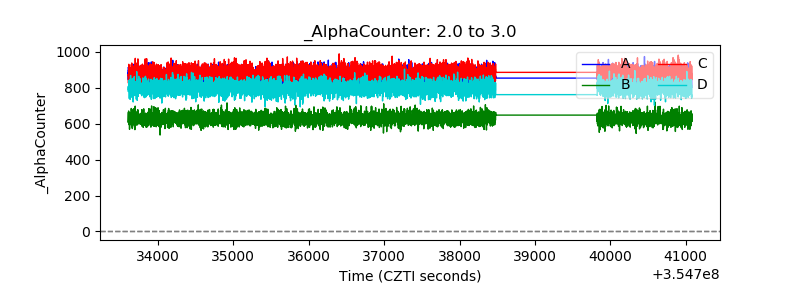 |
| _CPM_Rate | 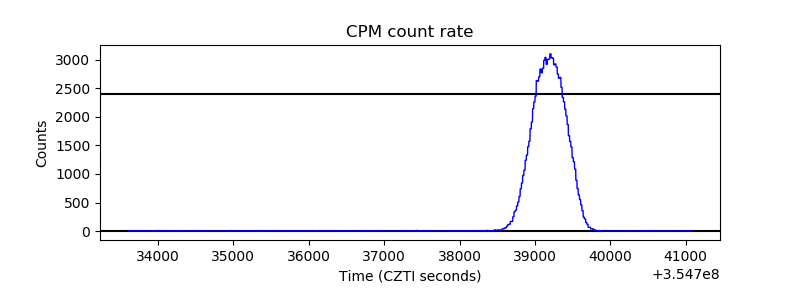 |
| CZT Counter | 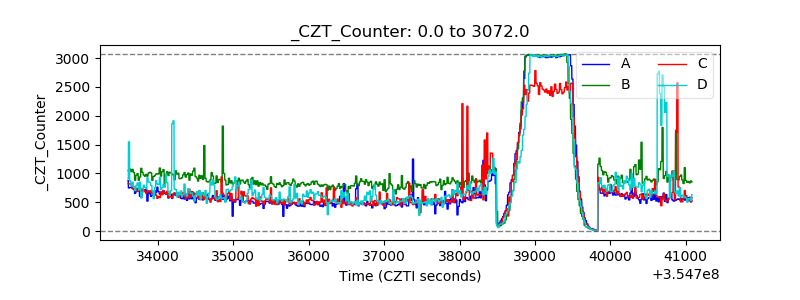 |
| +2.5 Volts monitor |  |
| +5 Volts monitor |  |
| _ROLL_ROT | 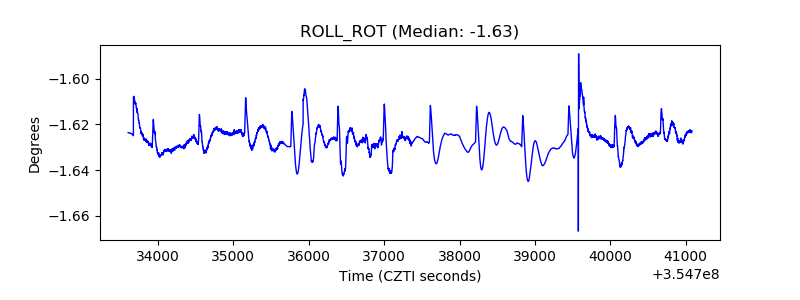 |
| _Roll_DEC | 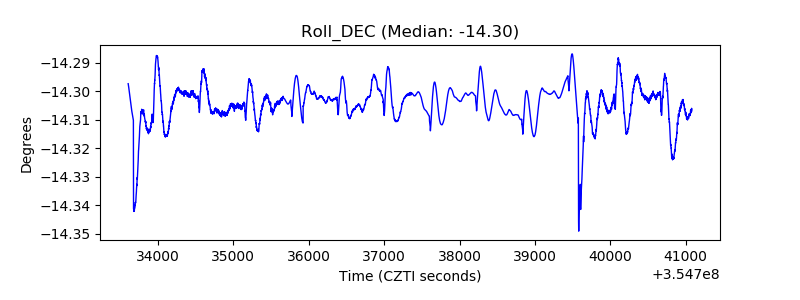 |
| _Roll_RA | 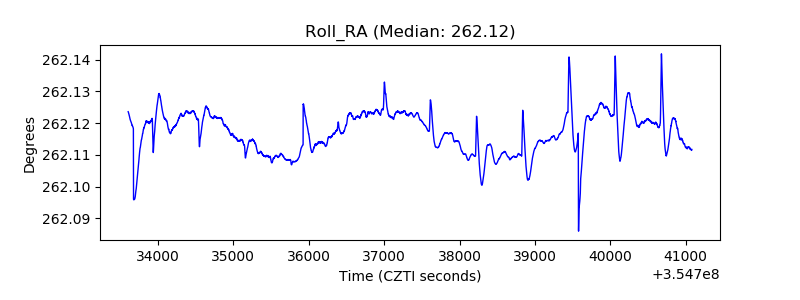 |
| Veto Counter | 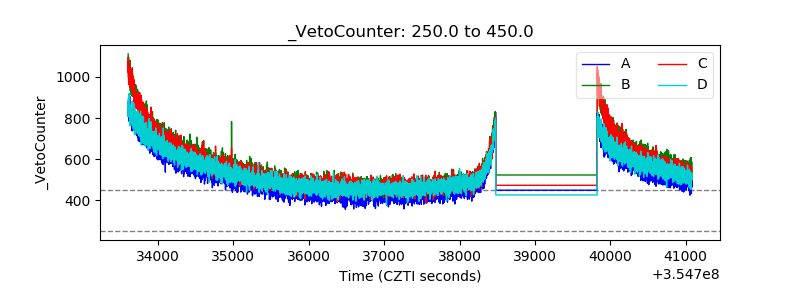 |