| Param | Original file | Final file |
|---|---|---|
| Filename | modeM0/AS1A10_007T01_9000004276_29747cztM0_level2.evt | modeM0/AS1A10_007T01_9000004276_29747cztM0_level2_quad_clean.evt |
| Size (bytes) | 564,621,120 | 98,616,960 |
| Size | 538.5 MB | 94.0 MB |
| Events in quadrant A | 3,308,231 | 649,024 |
| Events in quadrant B | 5,450,311 | 655,837 |
| Events in quadrant C | 3,633,161 | 634,118 |
| Events in quadrant D | 4,282,372 | 608,851 |
| Mode SS | |||
|---|---|---|---|
| Quadrant | BADHDUFLAG | Total packets | Discarded packets |
| A | 0 | 128 | 0 |
| B | 0 | 128 | 0 |
| C | 0 | 128 | 0 |
| D | 0 | 128 | 0 |
| Mode M0 | |||
|---|---|---|---|
| Quadrant | BADHDUFLAG | Total packets | Discarded packets |
| A | 0 | 13671 | 2 |
| B | 0 | 20193 | 2 |
| C | 0 | 14680 | 2 |
| D | 0 | 16764 | 2 |
| Mode M9 | |||
|---|---|---|---|
| Quadrant | BADHDUFLAG | Total packets | Discarded packets |
| A | 0 | 20 | 0 |
| B | 0 | 21 | 0 |
| C | 0 | 21 | 0 |
| D | 0 | 21 | 0 |
| Quadrant | Total seconds | Saturated seconds | Saturation percentage |
|---|---|---|---|
| A | 6287 | 29 | 0.461269% |
| B | 6287 | 156 | 2.481311% |
| C | 6287 | 160 | 2.544934% |
| D | 6287 | 257 | 4.087800% |
Noise dominated data is calculated using 1-second bins in cleaned event files. If a bin has >2000 counts, and if more than 50% of those come from <1% of pixels, then it is considered to be noise-dominated and hence unusable.
| Quadrant | # 1 sec bins | Bins with >0 counts | Bins with >2000 counts | High rate bins dominated by noise | Noise dominated (total time) | Noise dominated (detector-on time) | Marked lightcurve |
|---|---|---|---|---|---|---|---|
| A | 7622 | 6287 | 0 | 0 | 0.00% | 0.00% | 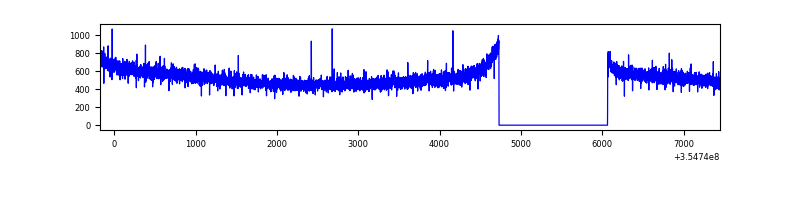 |
| B | 7622 | 6287 | 18 | 18 | 0.24% | 0.29% | 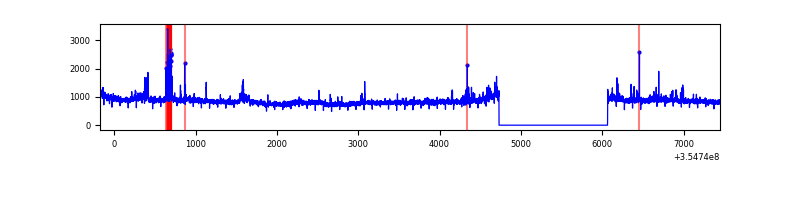 |
| C | 7622 | 6288 | 25 | 25 | 0.33% | 0.40% | 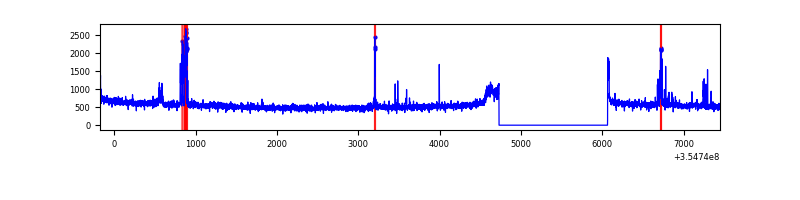 |
| D | 7622 | 6288 | 248 | 248 | 3.25% | 3.94% | 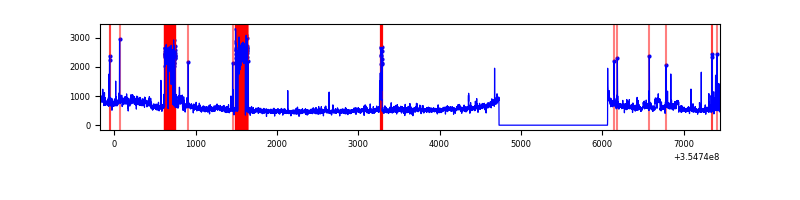 |
Top three noisy pixels from each quadrant. If the there are fewer than three noisy pixels in the level2.evt file, extra rows are filled as -1
| Pixel properties | Quadrant properties | ||||||
|---|---|---|---|---|---|---|---|
| Quadrant | DetID | PixID | Counts | Sigma | Mean | Median | Sigma |
| A | 13 | 254 | 12188 | 66.92 | 857 | 841 | 169.6 |
| A | 3 | 137 | 7979 | 42.1 | 857 | 841 | 169.6 |
| A | 0 | 226 | 7245 | 37.77 | 857 | 841 | 169.6 |
| B | 6 | 159 | 1869408 | 11595.48 | 853 | 835 | 161.1 |
| B | 0 | 229 | 169806 | 1048.55 | 853 | 835 | 161.1 |
| B | 12 | 111 | 18896 | 112.08 | 853 | 835 | 161.1 |
| C | 14 | 238 | 135771 | 707.96 | 824 | 833 | 190.6 |
| C | 3 | 233 | 119850 | 624.43 | 824 | 833 | 190.6 |
| C | 10 | 22 | 110614 | 575.97 | 824 | 833 | 190.6 |
| D | 8 | 195 | 494521 | 2560.42 | 817 | 799 | 192.8 |
| D | 2 | 225 | 253112 | 1308.48 | 817 | 799 | 192.8 |
| D | 7 | 80 | 250149 | 1293.12 | 817 | 799 | 192.8 |
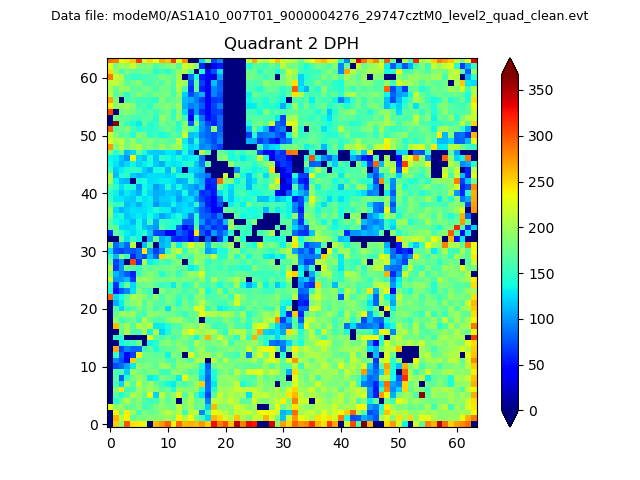
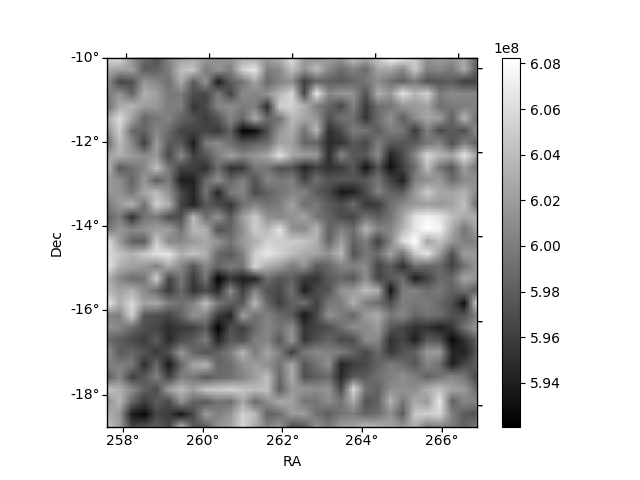
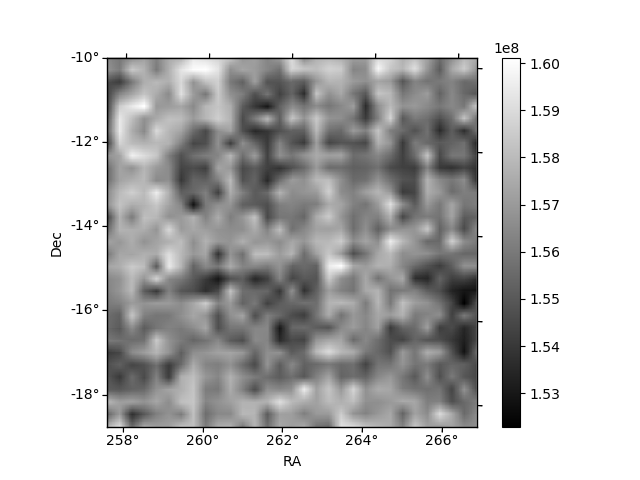
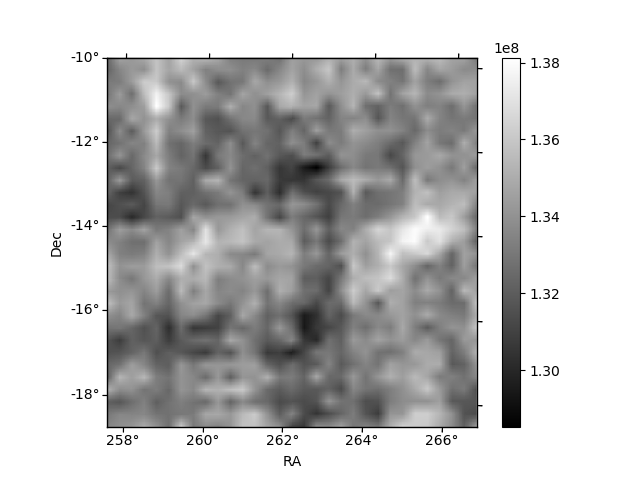
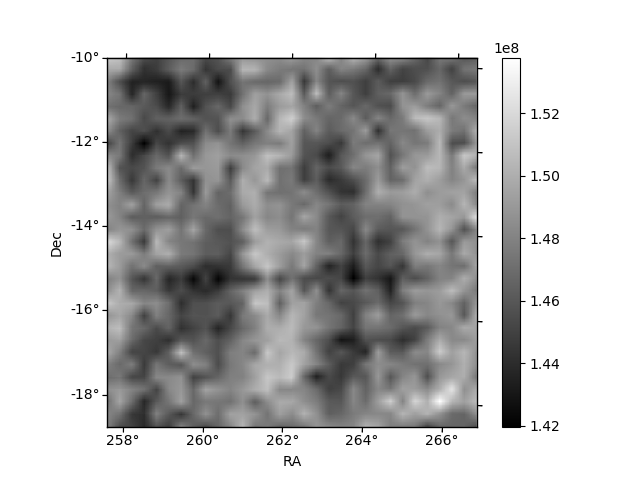
Histogram calculated using DETX and DETY for each event in the final _common_clean file
| Quadrant A | 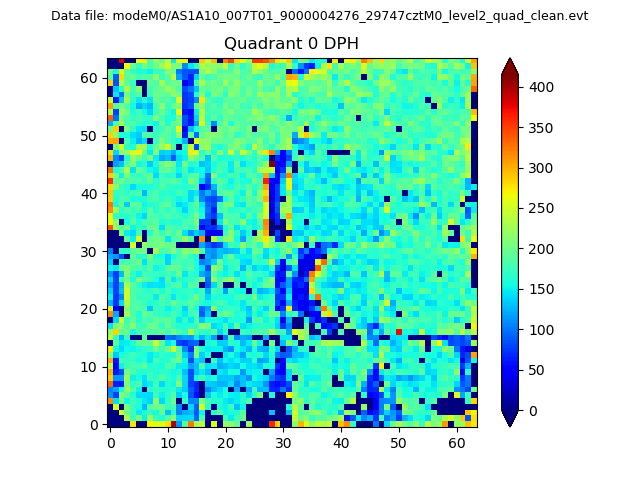 |
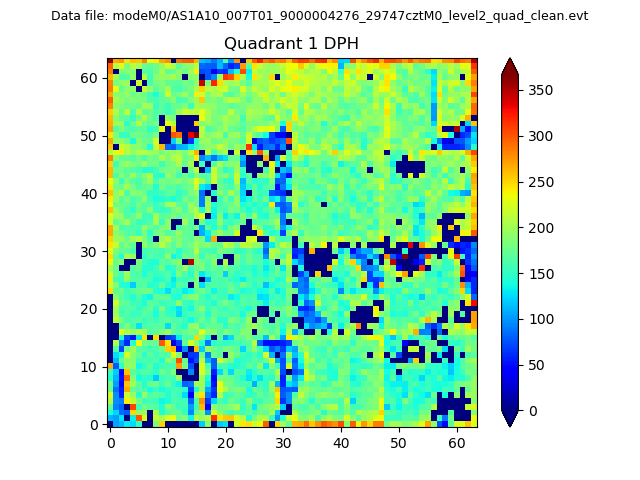 |
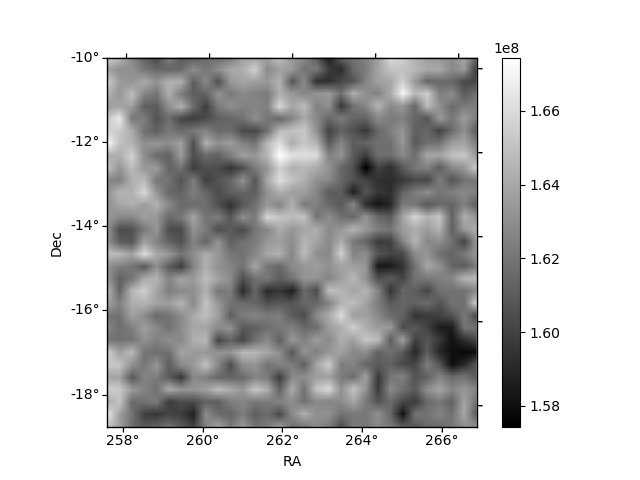
Quadrant B |
|---|---|---|---|
| Quadrant D | 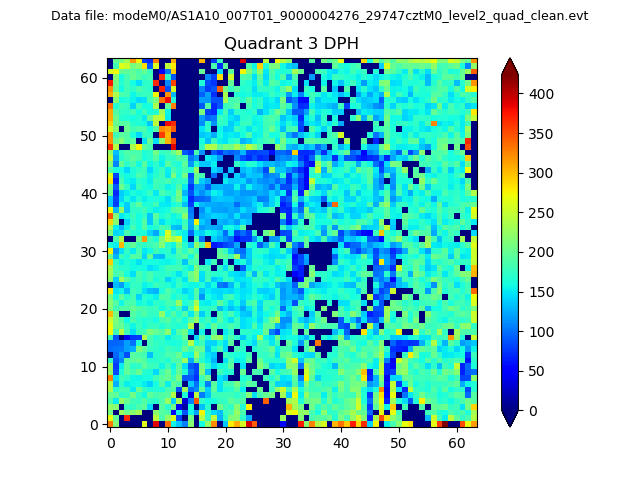 |
 |
Quadrant C |
| Plot type | Count rate plots | Images |
|---|---|---|
| Comparison with Poisson distribution Blue bars denote a histogram of data divided into 1 sec bins. Red curve is a Poisson curve with rate = median count rate of data. |
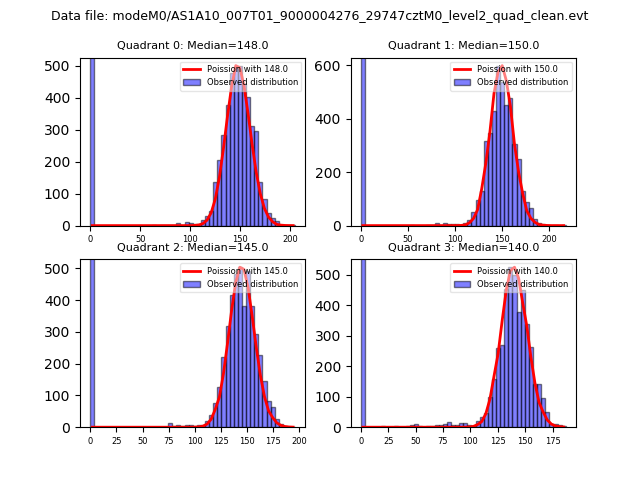 |
 |
| Quadrant-wise count rates Data is divided into 100 sec bins |
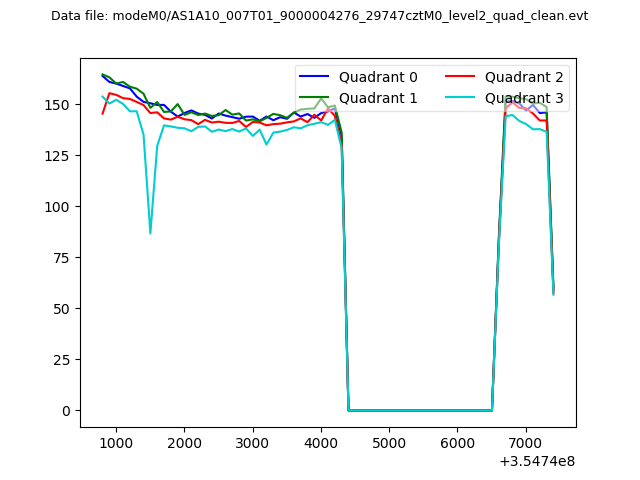 |
|
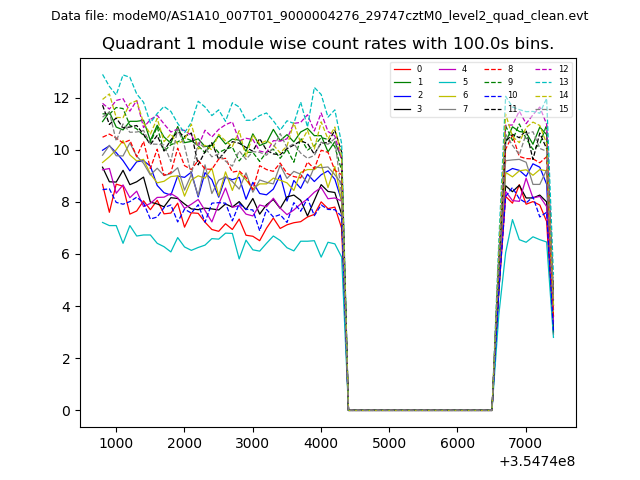
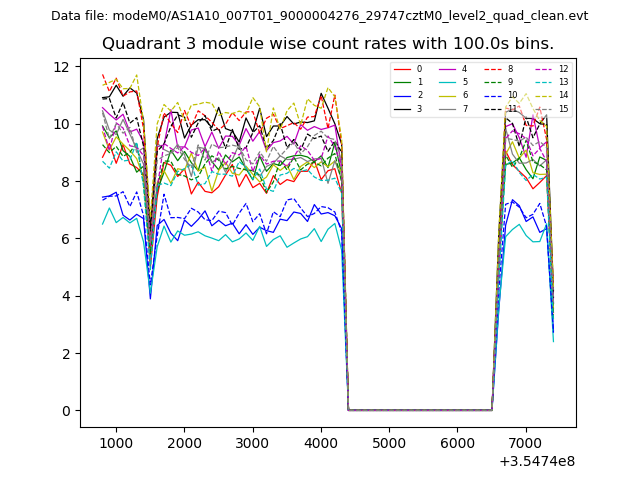
| Module-wise count rates for Quadrant A Data is divided into 100 sec bins |
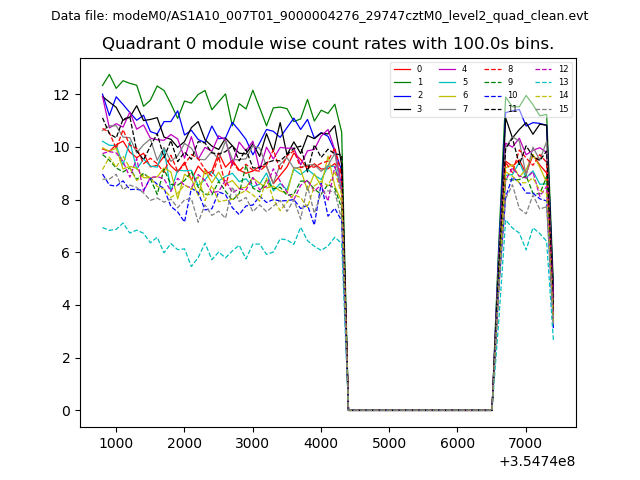 |
 |
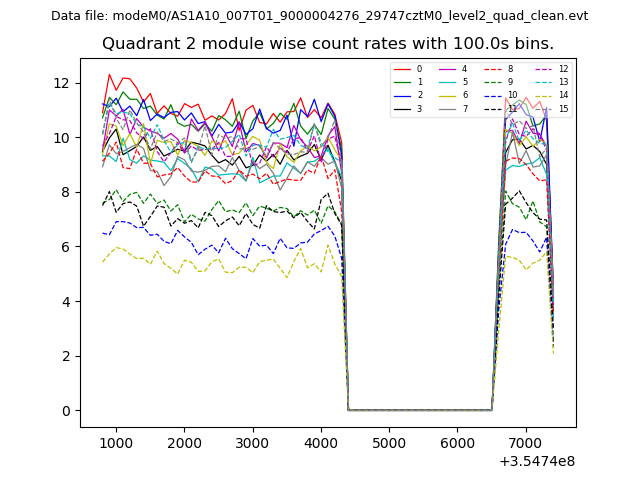
| Module-wise count rates for Quadrant B Data is divided into 100 sec bins |
 |
 |
| Module-wise count rates for Quadrant C Data is divided into 100 sec bins |
 |
 |
| Module-wise count rates for Quadrant D Data is divided into 100 sec bins |
 |
 |
| Parameter | Plot |
|---|---|
| CZT HV Monitor | 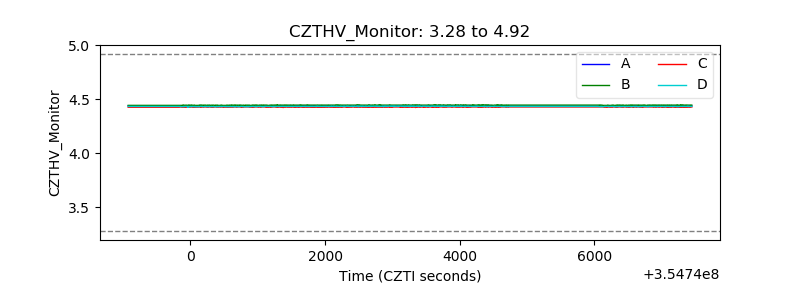 |
| D_VDD | 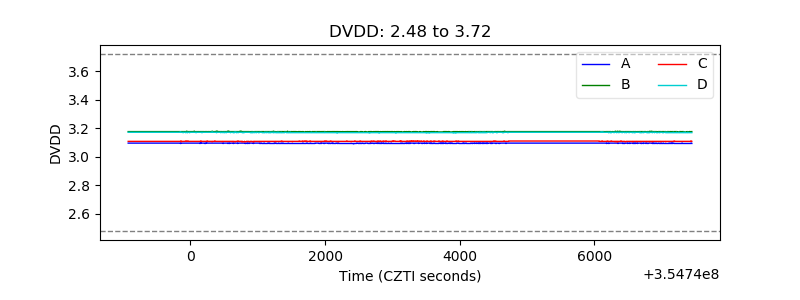 |
| Temperature 1 | 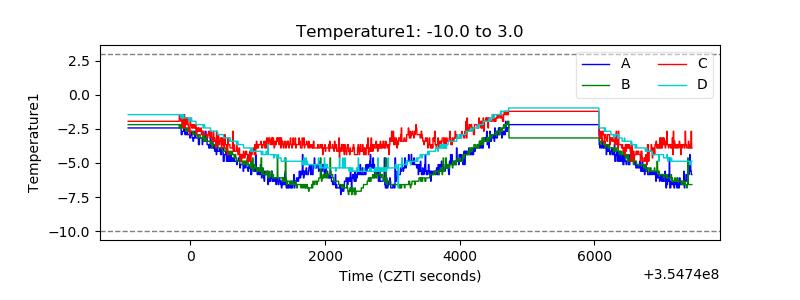 |
| Veto HV Monitor | 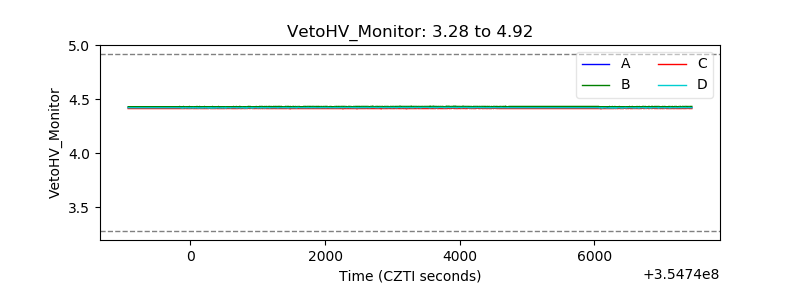 |
| Veto LLD | 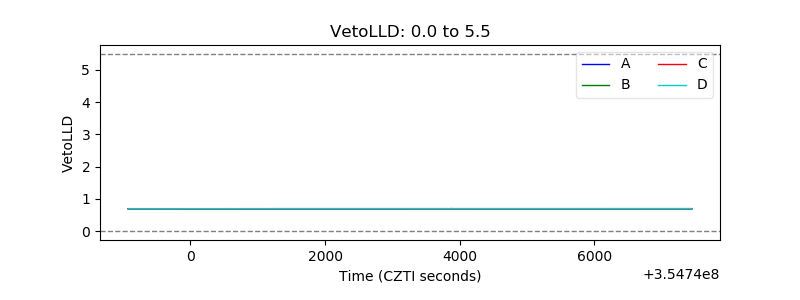 |
| Alpha Counter | 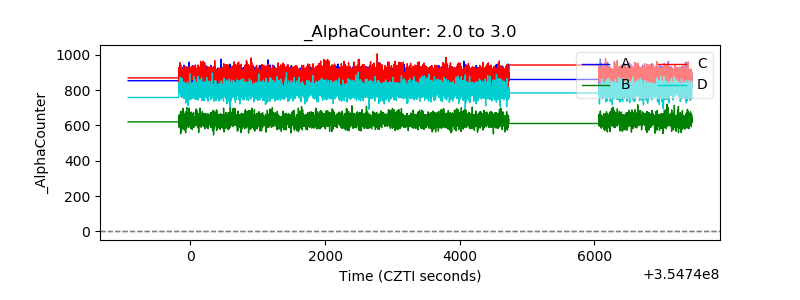 |
| _CPM_Rate | 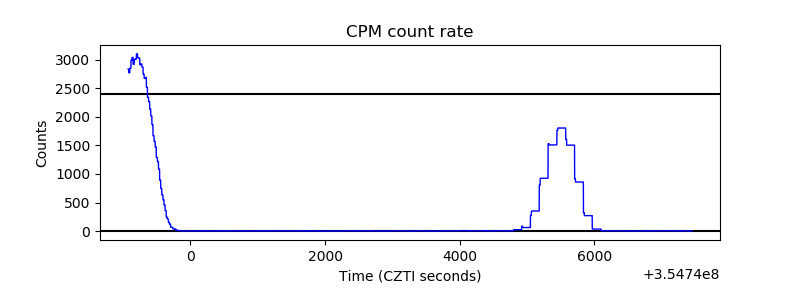 |
| CZT Counter | 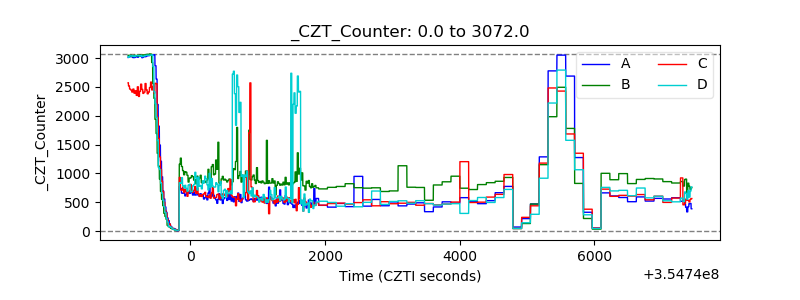 |
| +2.5 Volts monitor |  |
| +5 Volts monitor |  |
| _ROLL_ROT | 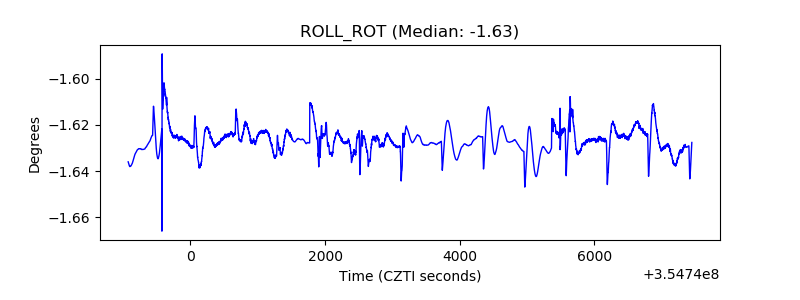 |
| _Roll_DEC | 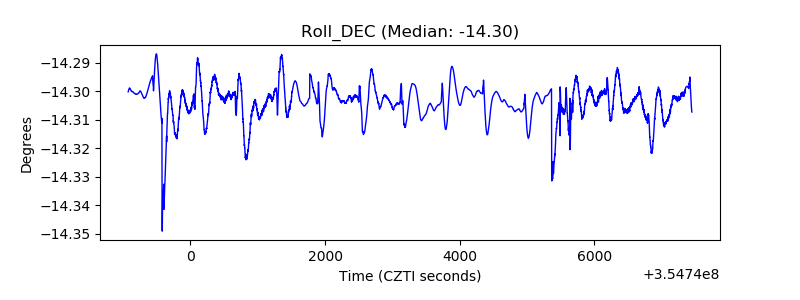 |
| _Roll_RA | 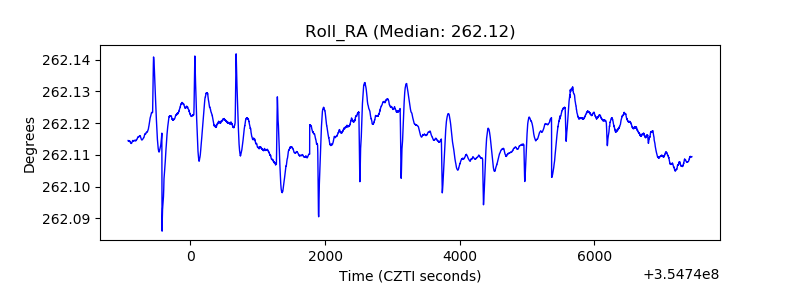 |
| Veto Counter | 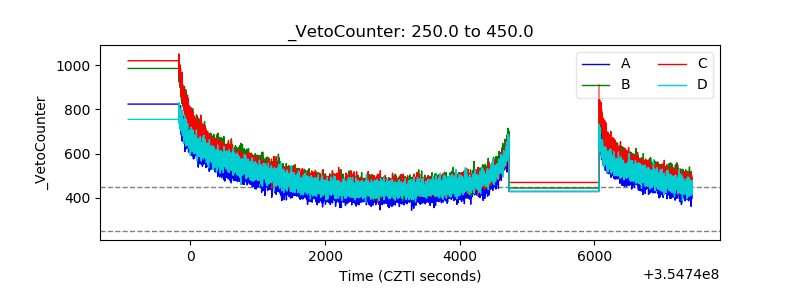 |