| Param | Original file | Final file |
|---|---|---|
| Filename | modeM0/AS1A10_007T01_9000004276_29748cztM0_level2.evt | modeM0/AS1A10_007T01_9000004276_29748cztM0_level2_quad_clean.evt |
| Size (bytes) | 560,666,880 | 101,689,920 |
| Size | 534.7 MB | 97.0 MB |
| Events in quadrant A | 3,151,967 | 669,360 |
| Events in quadrant B | 5,310,183 | 679,861 |
| Events in quadrant C | 3,835,205 | 653,414 |
| Events in quadrant D | 4,253,407 | 634,473 |
| Mode SS | |||
|---|---|---|---|
| Quadrant | BADHDUFLAG | Total packets | Discarded packets |
| A | 0 | 128 | 0 |
| B | 0 | 128 | 0 |
| C | 0 | 128 | 0 |
| D | 0 | 128 | 0 |
| Mode M0 | |||
|---|---|---|---|
| Quadrant | BADHDUFLAG | Total packets | Discarded packets |
| A | 0 | 13236 | 1 |
| B | 0 | 19962 | 1 |
| C | 0 | 15273 | 1 |
| D | 0 | 16886 | 1 |
| Mode M9 | |||
|---|---|---|---|
| Quadrant | BADHDUFLAG | Total packets | Discarded packets |
| A | 0 | 11 | 0 |
| B | 0 | 11 | 0 |
| C | 0 | 11 | 0 |
| D | 0 | 11 | 0 |
| Quadrant | Total seconds | Saturated seconds | Saturation percentage |
|---|---|---|---|
| A | 6343 | 35 | 0.551789% |
| B | 6344 | 156 | 2.459016% |
| C | 6344 | 210 | 3.310214% |
| D | 6343 | 117 | 1.844553% |
Noise dominated data is calculated using 1-second bins in cleaned event files. If a bin has >2000 counts, and if more than 50% of those come from <1% of pixels, then it is considered to be noise-dominated and hence unusable.
| Quadrant | # 1 sec bins | Bins with >0 counts | Bins with >2000 counts | High rate bins dominated by noise | Noise dominated (total time) | Noise dominated (detector-on time) | Marked lightcurve |
|---|---|---|---|---|---|---|---|
| A | 7418 | 6343 | 0 | 0 | 0.00% | 0.00% | 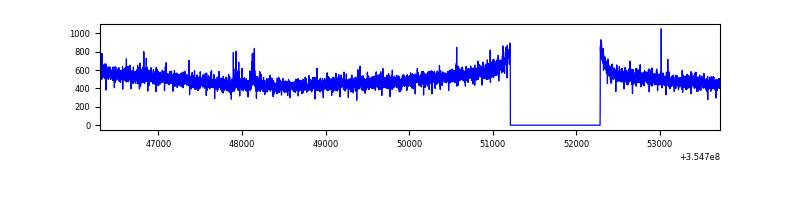 |
| B | 7419 | 6344 | 8 | 8 | 0.11% | 0.13% | 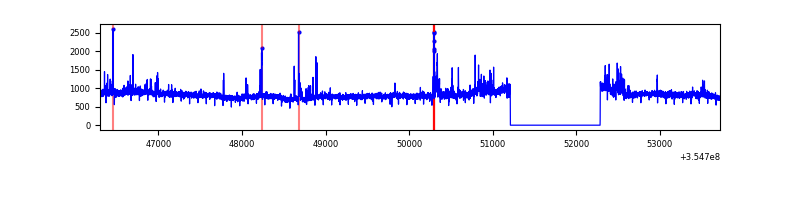 |
| C | 7419 | 6345 | 96 | 96 | 1.29% | 1.51% | 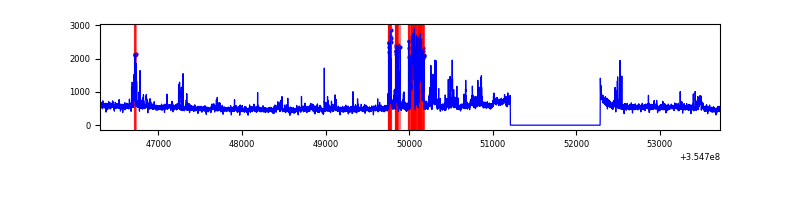 |
| D | 7418 | 6343 | 65 | 65 | 0.88% | 1.02% | 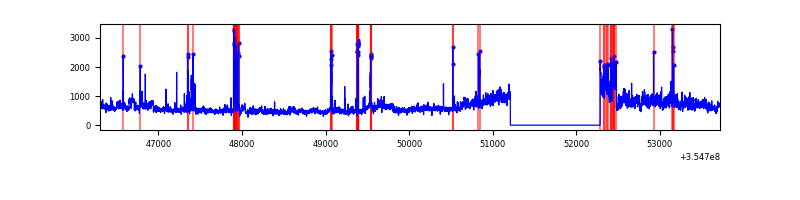 |
Top three noisy pixels from each quadrant. If the there are fewer than three noisy pixels in the level2.evt file, extra rows are filled as -1
| Pixel properties | Quadrant properties | ||||||
|---|---|---|---|---|---|---|---|
| Quadrant | DetID | PixID | Counts | Sigma | Mean | Median | Sigma |
| A | 13 | 254 | 12063 | 69.12 | 814 | 800 | 162.9 |
| A | 12 | 16 | 11311 | 64.51 | 814 | 800 | 162.9 |
| A | 3 | 137 | 7948 | 43.87 | 814 | 800 | 162.9 |
| B | 6 | 159 | 1900668 | 12366.01 | 811 | 791 | 153.6 |
| B | 0 | 229 | 146892 | 950.95 | 811 | 791 | 153.6 |
| B | 0 | 190 | 29228 | 185.09 | 811 | 791 | 153.6 |
| C | 10 | 22 | 360031 | 1940.32 | 786 | 792 | 185.1 |
| C | 3 | 233 | 225819 | 1215.41 | 786 | 792 | 185.1 |
| C | 14 | 238 | 126068 | 676.64 | 786 | 792 | 185.1 |
| D | 8 | 195 | 1022247 | 5491.62 | 785 | 767 | 186.0 |
| D | 2 | 250 | 128258 | 685.41 | 785 | 767 | 186.0 |
| D | 13 | 153 | 92657 | 494.01 | 785 | 767 | 186.0 |
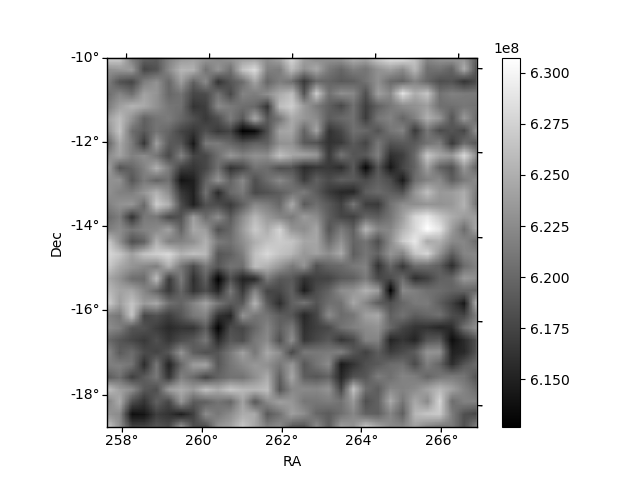
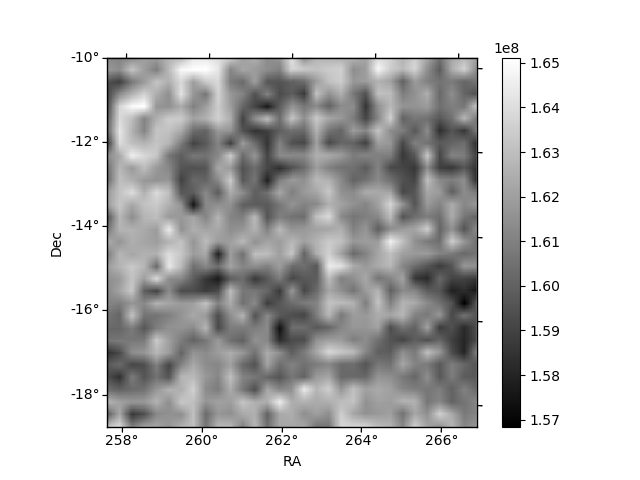
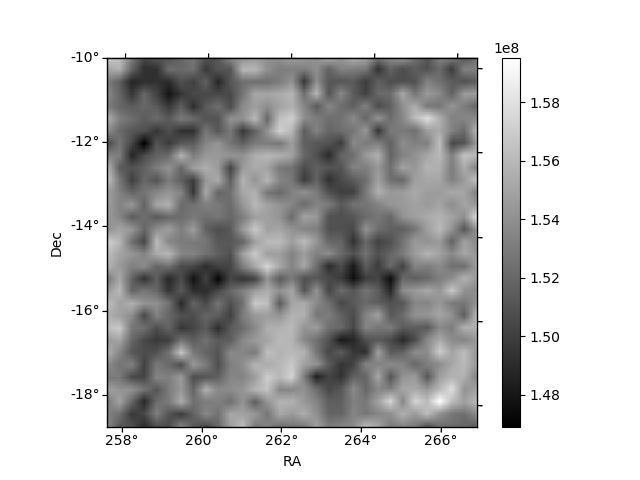
Histogram calculated using DETX and DETY for each event in the final _common_clean file
| Quadrant A | 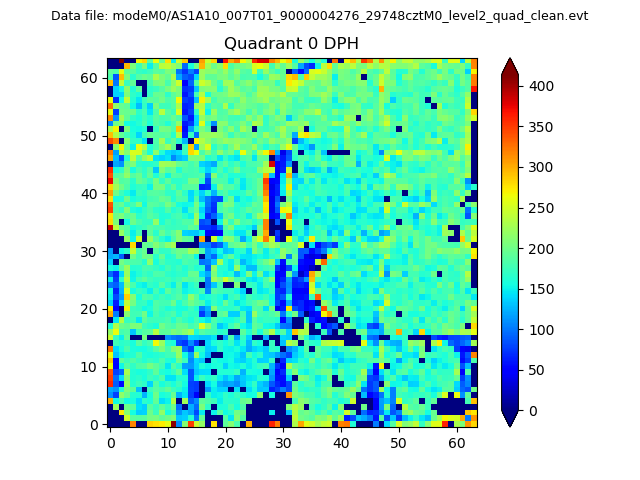 |
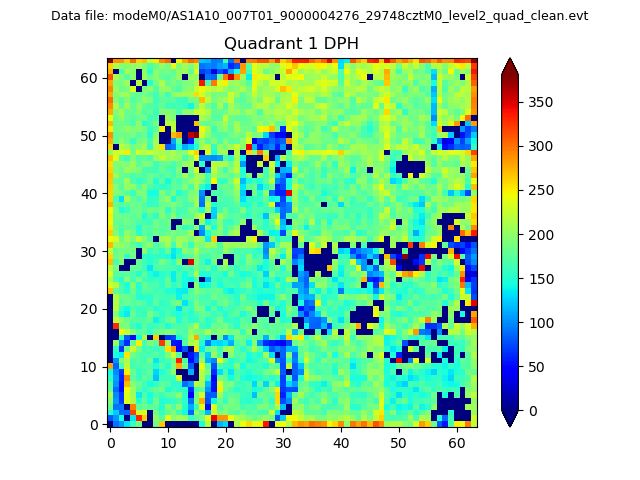 |
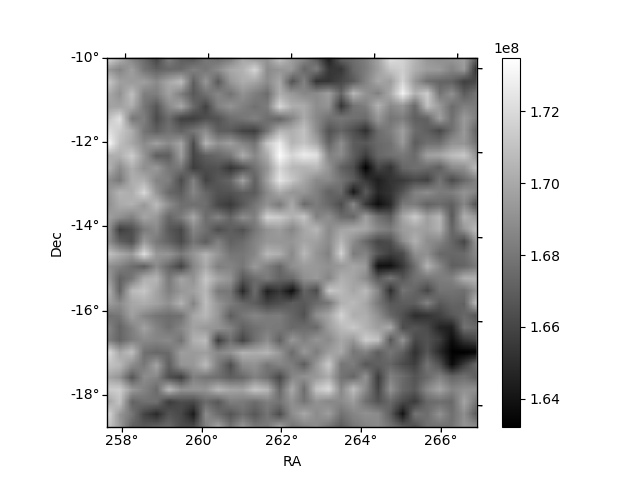
Quadrant B |
|---|---|---|---|
| Quadrant D | 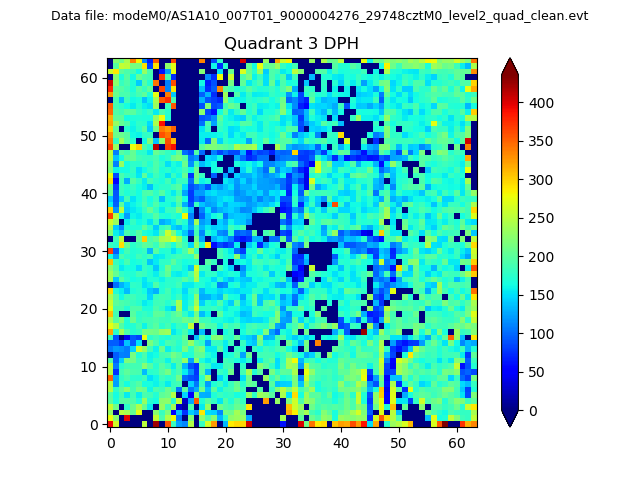 |
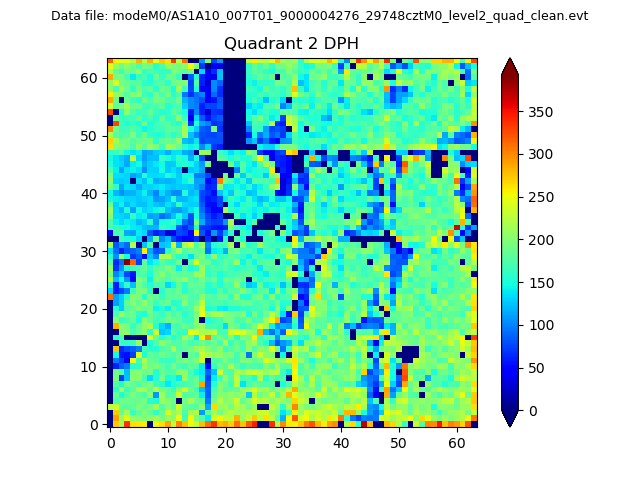 |
Quadrant C |
| Plot type | Count rate plots | Images |
|---|---|---|
| Comparison with Poisson distribution Blue bars denote a histogram of data divided into 1 sec bins. Red curve is a Poisson curve with rate = median count rate of data. |
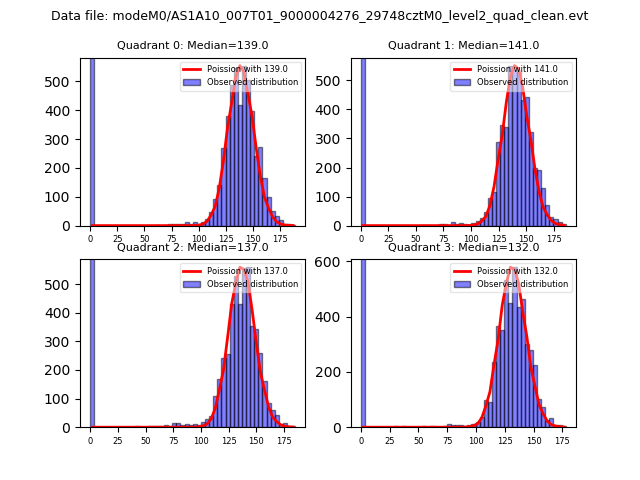 |
 |
| Quadrant-wise count rates Data is divided into 100 sec bins |
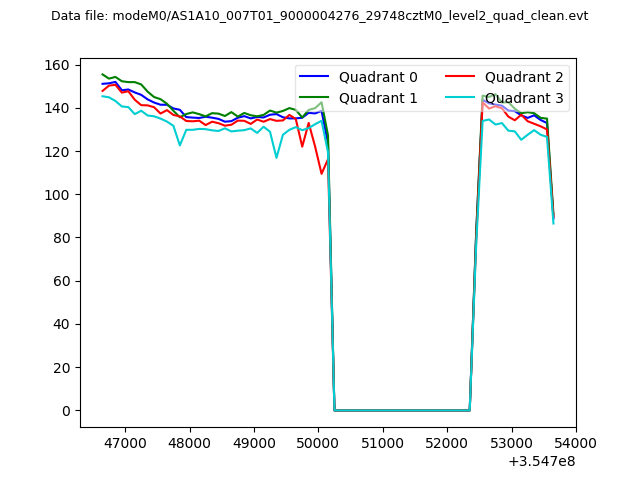 |
|
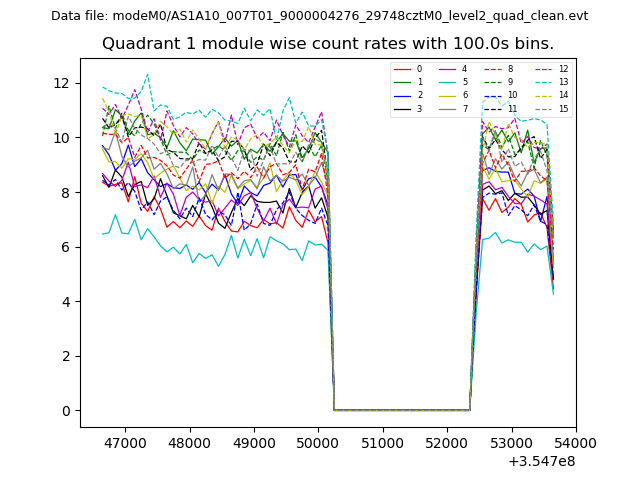
| Module-wise count rates for Quadrant A Data is divided into 100 sec bins |
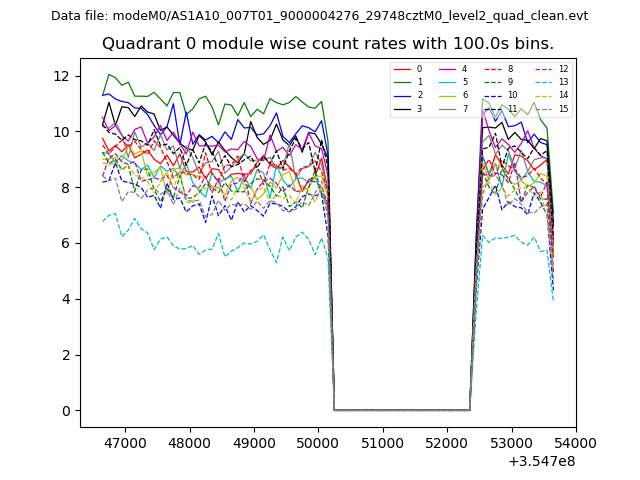 |
 |
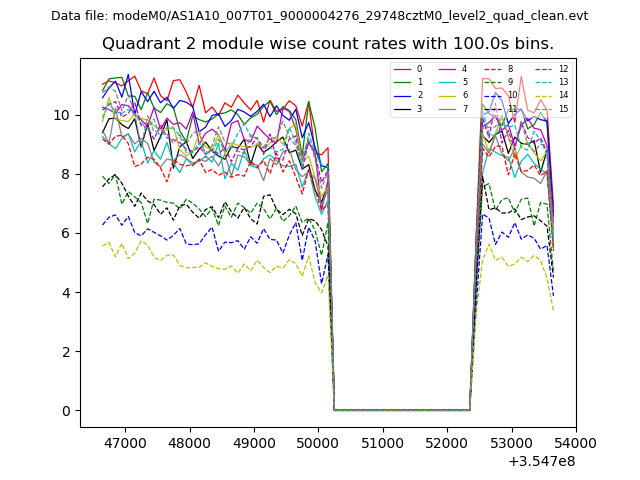
| Module-wise count rates for Quadrant B Data is divided into 100 sec bins |
 |
 |
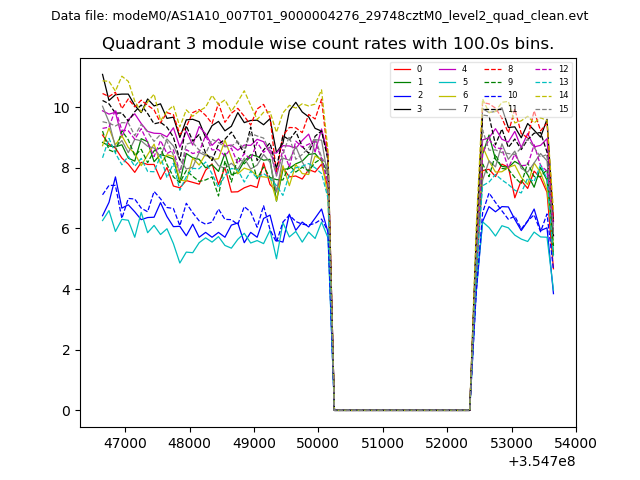
| Module-wise count rates for Quadrant C Data is divided into 100 sec bins |
 |
 |
| Module-wise count rates for Quadrant D Data is divided into 100 sec bins |
 |
 |
| Parameter | Plot |
|---|---|
| CZT HV Monitor | 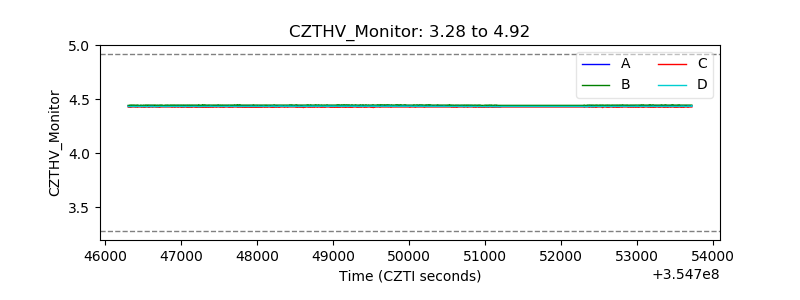 |
| D_VDD | 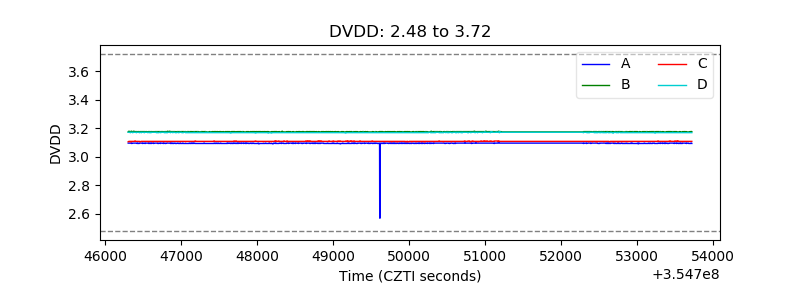 |
| Temperature 1 | 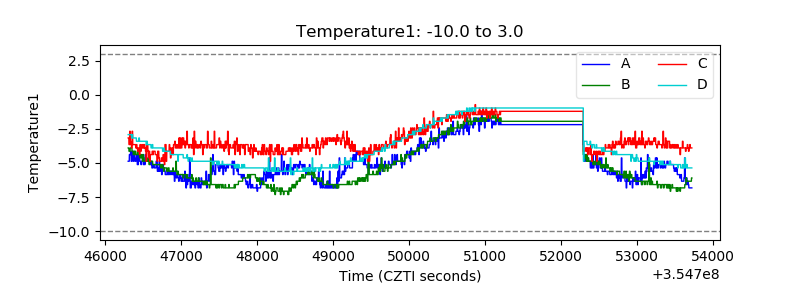 |
| Veto HV Monitor | 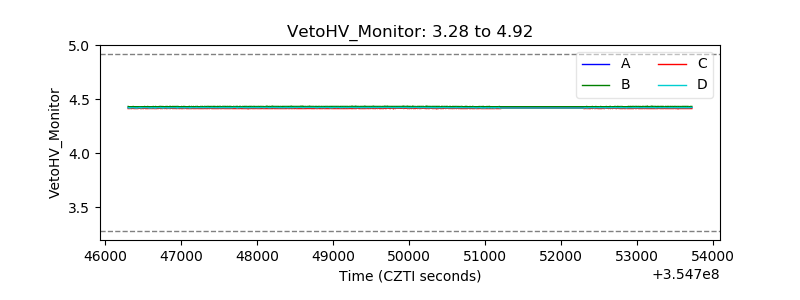 |
| Veto LLD | 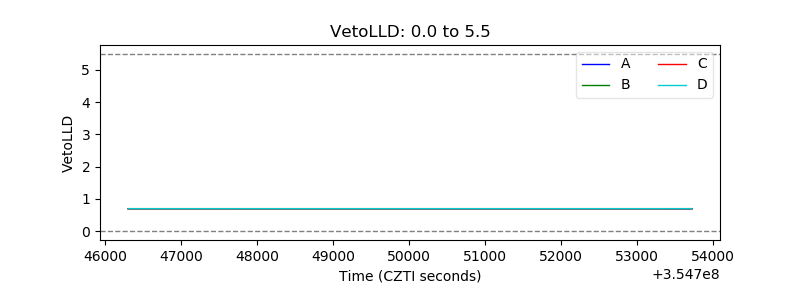 |
| Alpha Counter | 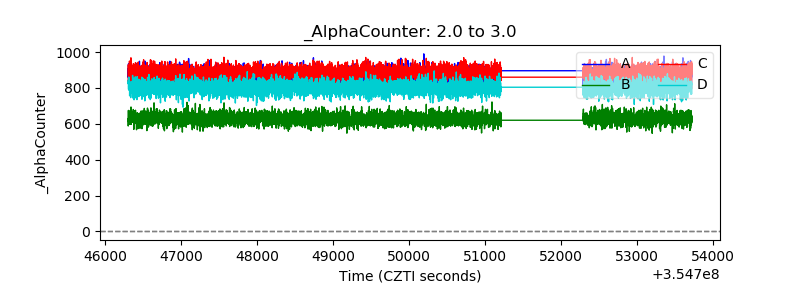 |
| _CPM_Rate | 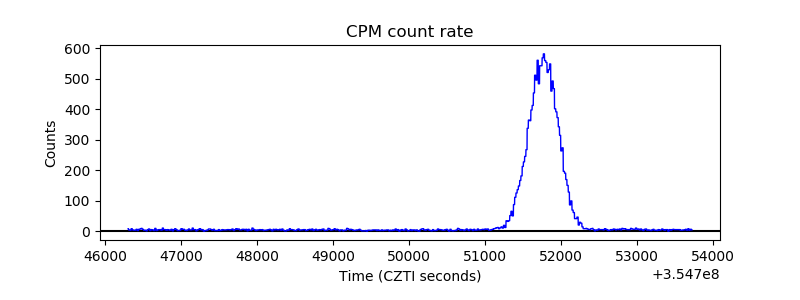 |
| CZT Counter | 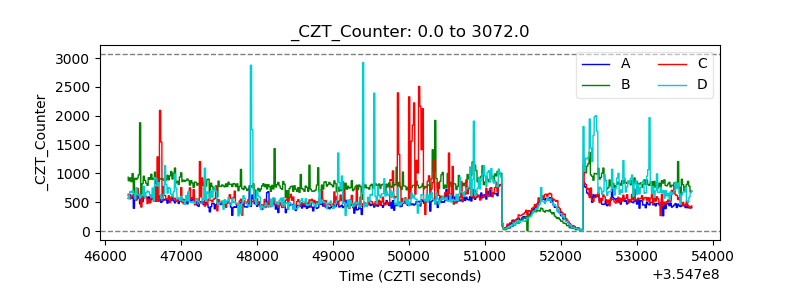 |
| +2.5 Volts monitor |  |
| +5 Volts monitor | 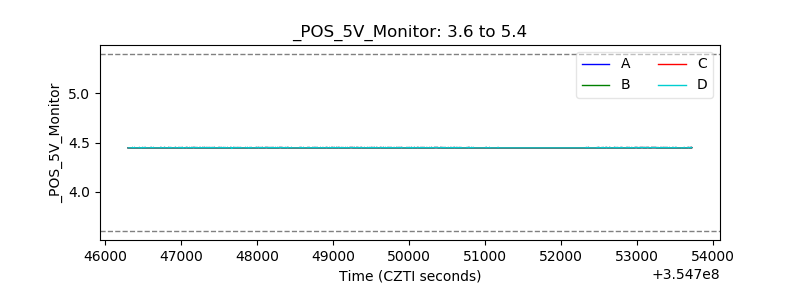 |
| _ROLL_ROT | 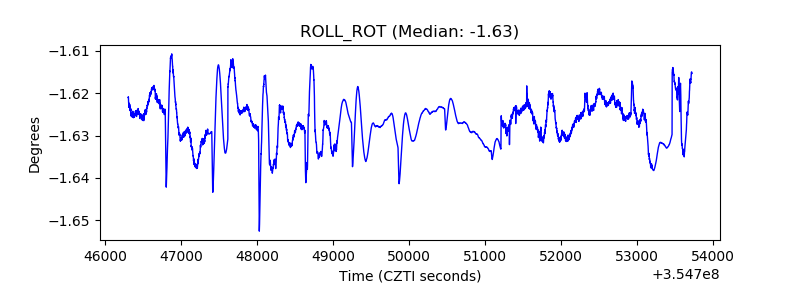 |
| _Roll_DEC | 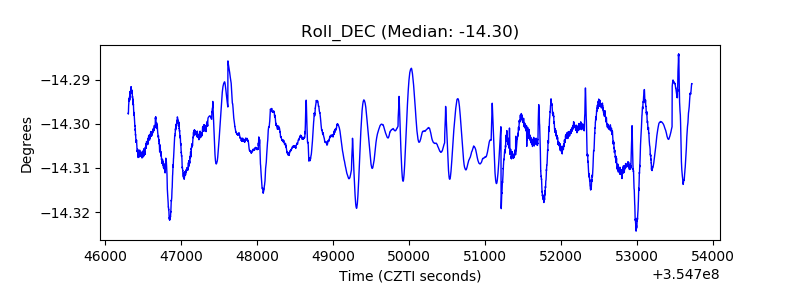 |
| _Roll_RA | 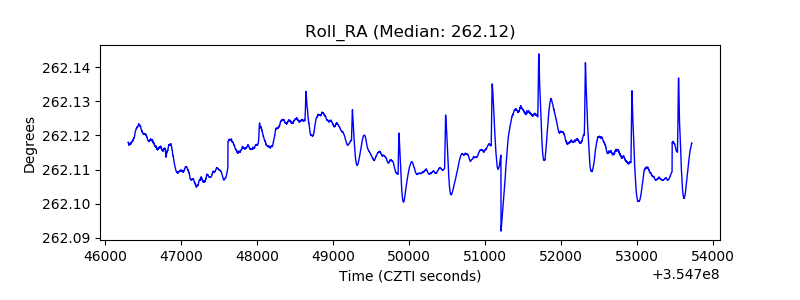 |
| Veto Counter | 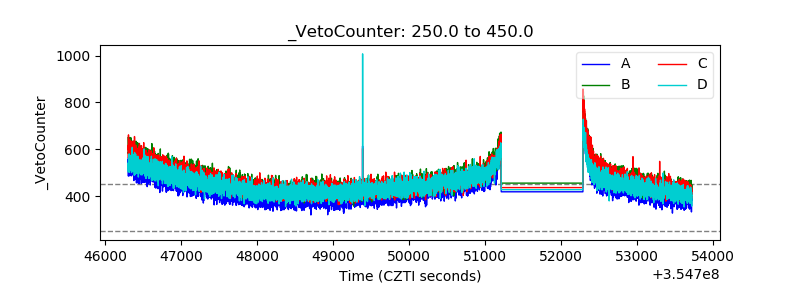 |