| Param | Original file | Final file |
|---|---|---|
| Filename | modeM0/AS1A10_007T01_9000004276_29749cztM0_level2.evt | modeM0/AS1A10_007T01_9000004276_29749cztM0_level2_quad_clean.evt |
| Size (bytes) | 581,437,440 | 100,895,040 |
| Size | 554.5 MB | 96.2 MB |
| Events in quadrant A | 3,315,281 | 653,457 |
| Events in quadrant B | 5,604,705 | 658,987 |
| Events in quadrant C | 3,581,723 | 646,670 |
| Events in quadrant D | 4,644,518 | 619,986 |
| Mode SS | |||
|---|---|---|---|
| Quadrant | BADHDUFLAG | Total packets | Discarded packets |
| A | 0 | 138 | 0 |
| B | 0 | 138 | 0 |
| C | 0 | 138 | 0 |
| D | 0 | 138 | 0 |
| Mode M0 | |||
|---|---|---|---|
| Quadrant | BADHDUFLAG | Total packets | Discarded packets |
| A | 0 | 14207 | 2 |
| B | 0 | 21337 | 2 |
| C | 0 | 14683 | 2 |
| D | 0 | 18527 | 2 |
| Mode M9 | |||
|---|---|---|---|
| Quadrant | BADHDUFLAG | Total packets | Discarded packets |
| A | 0 | 9 | 0 |
| B | 0 | 10 | 0 |
| C | 0 | 10 | 0 |
| D | 0 | 10 | 0 |
| Quadrant | Total seconds | Saturated seconds | Saturation percentage |
|---|---|---|---|
| A | 6841 | 34 | 0.497003% |
| B | 6841 | 162 | 2.368075% |
| C | 6841 | 75 | 1.096331% |
| D | 6841 | 88 | 1.286362% |
Noise dominated data is calculated using 1-second bins in cleaned event files. If a bin has >2000 counts, and if more than 50% of those come from <1% of pixels, then it is considered to be noise-dominated and hence unusable.
| Quadrant | # 1 sec bins | Bins with >0 counts | Bins with >2000 counts | High rate bins dominated by noise | Noise dominated (total time) | Noise dominated (detector-on time) | Marked lightcurve |
|---|---|---|---|---|---|---|---|
| A | 7561 | 6842 | 0 | 0 | 0.00% | 0.00% | 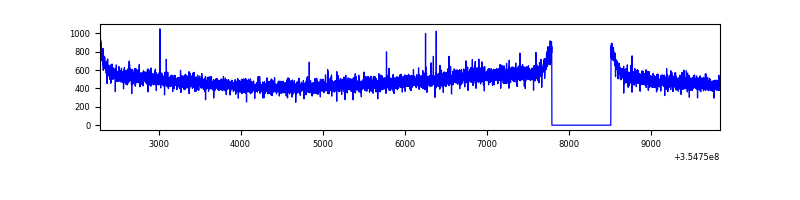 |
| B | 7561 | 6841 | 12 | 12 | 0.16% | 0.18% | 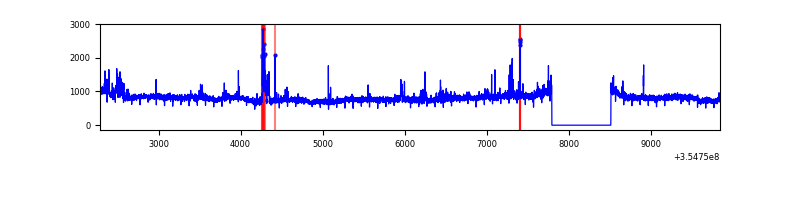 |
| C | 7561 | 6842 | 0 | 0 | 0.00% | 0.00% | 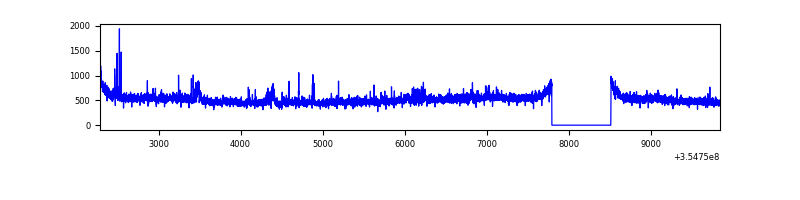 |
| D | 7561 | 6842 | 35 | 35 | 0.46% | 0.51% | 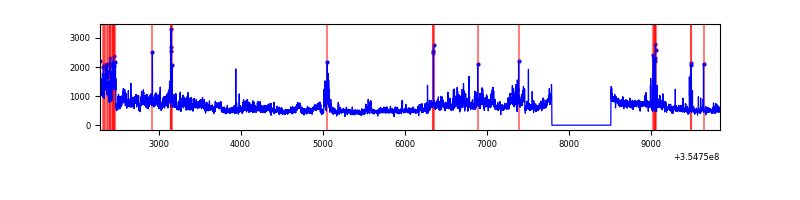 |
Top three noisy pixels from each quadrant. If the there are fewer than three noisy pixels in the level2.evt file, extra rows are filled as -1
| Pixel properties | Quadrant properties | ||||||
|---|---|---|---|---|---|---|---|
| Quadrant | DetID | PixID | Counts | Sigma | Mean | Median | Sigma |
| A | 13 | 254 | 12782 | 69.29 | 858 | 840 | 172.3 |
| A | 3 | 137 | 8674 | 45.46 | 858 | 840 | 172.3 |
| A | 0 | 226 | 7172 | 36.74 | 858 | 840 | 172.3 |
| B | 6 | 159 | 2025333 | 12375.9 | 853 | 833 | 163.6 |
| B | 5 | 255 | 81142 | 490.93 | 853 | 833 | 163.6 |
| B | 0 | 229 | 79216 | 479.16 | 853 | 833 | 163.6 |
| C | 14 | 238 | 132885 | 674.88 | 834 | 840 | 195.7 |
| C | 3 | 233 | 122127 | 619.9 | 834 | 840 | 195.7 |
| C | 7 | 247 | 46731 | 234.55 | 834 | 840 | 195.7 |
| D | 8 | 195 | 1294022 | 6498.68 | 833 | 811 | 199.0 |
| D | 2 | 250 | 68829 | 341.81 | 833 | 811 | 199.0 |
| D | 13 | 153 | 65345 | 324.3 | 833 | 811 | 199.0 |
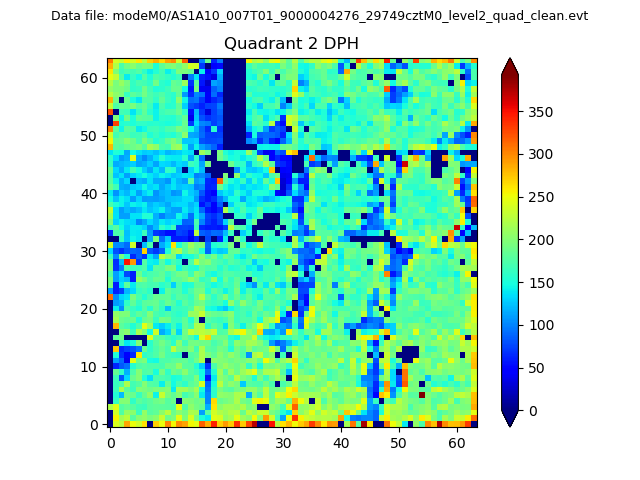
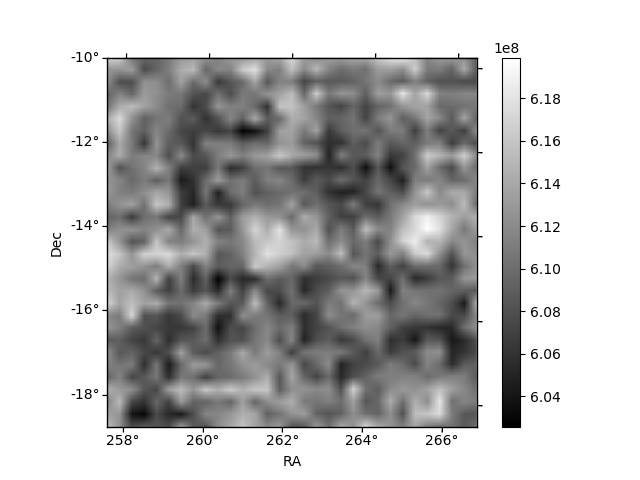
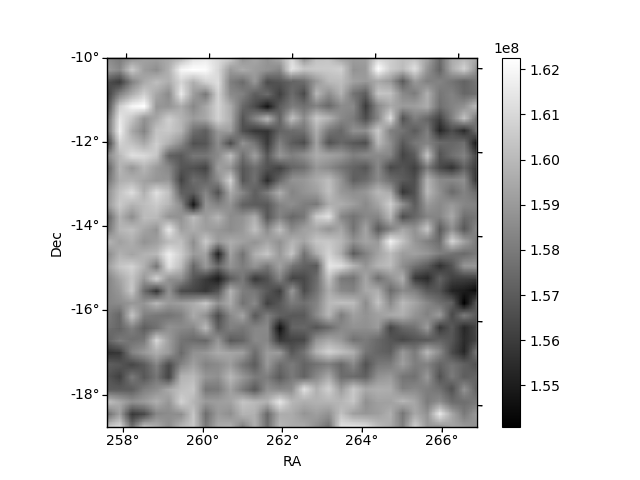
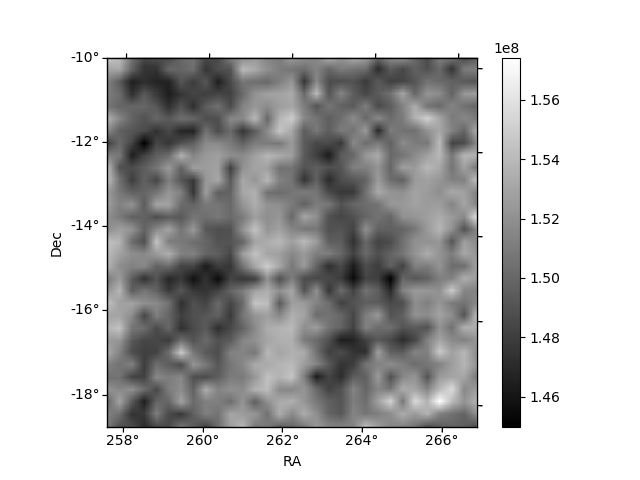
Histogram calculated using DETX and DETY for each event in the final _common_clean file
| Quadrant A | 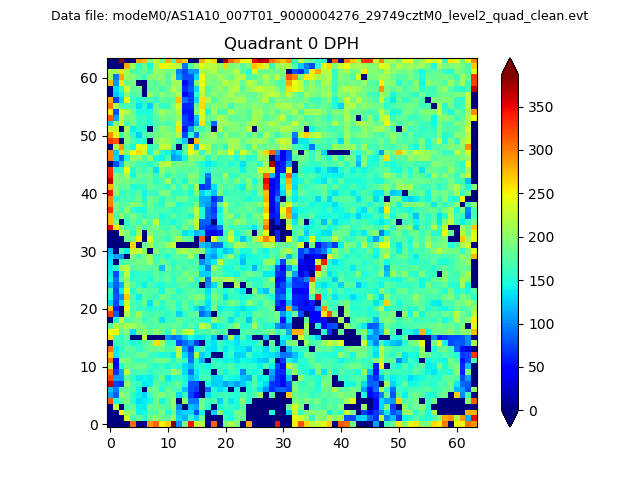 |
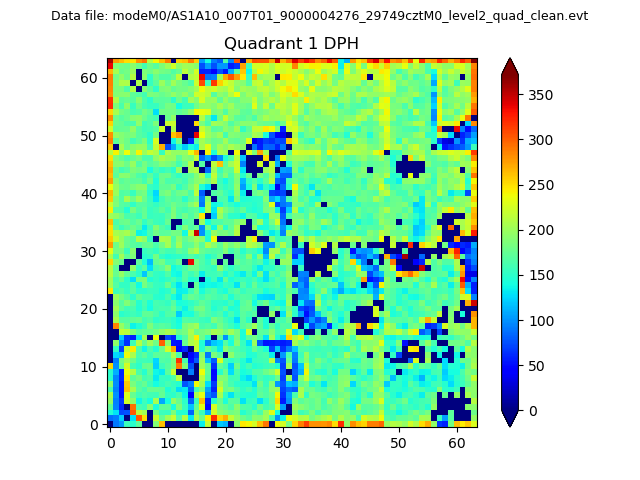 |
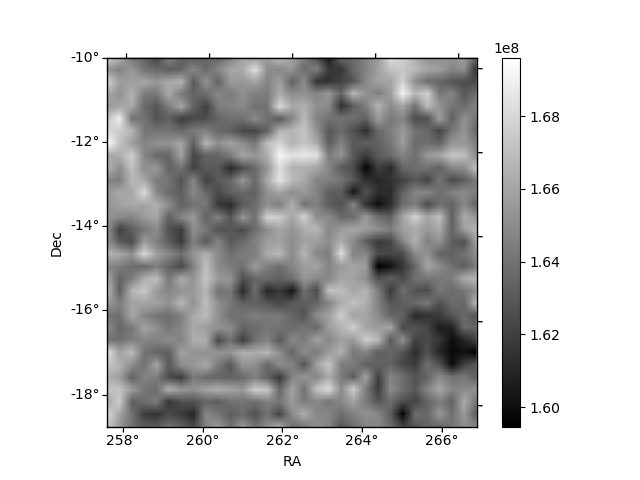
Quadrant B |
|---|---|---|---|
| Quadrant D | 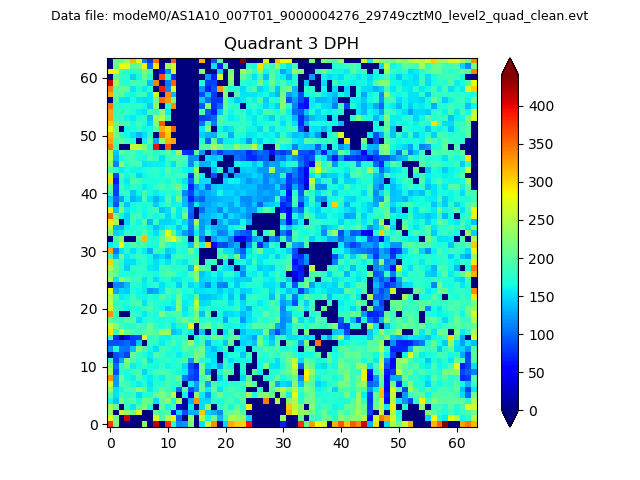 |
 |
Quadrant C |
| Plot type | Count rate plots | Images |
|---|---|---|
| Comparison with Poisson distribution Blue bars denote a histogram of data divided into 1 sec bins. Red curve is a Poisson curve with rate = median count rate of data. |
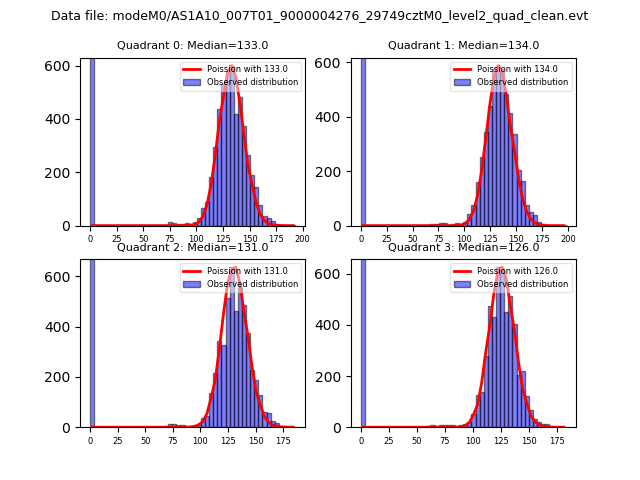 |
 |
| Quadrant-wise count rates Data is divided into 100 sec bins |
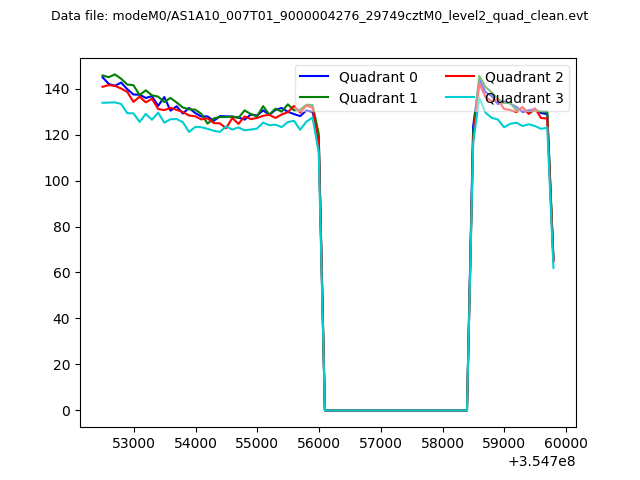 |
|
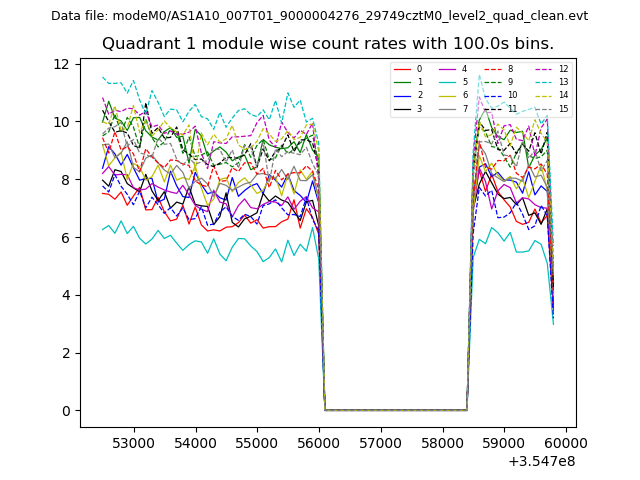
| Module-wise count rates for Quadrant A Data is divided into 100 sec bins |
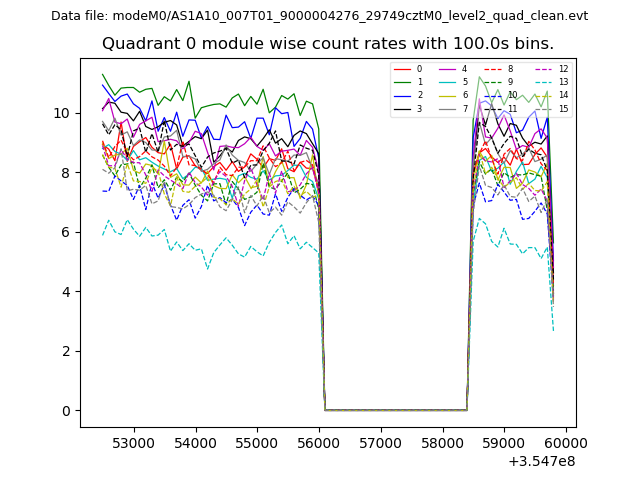 |
 |
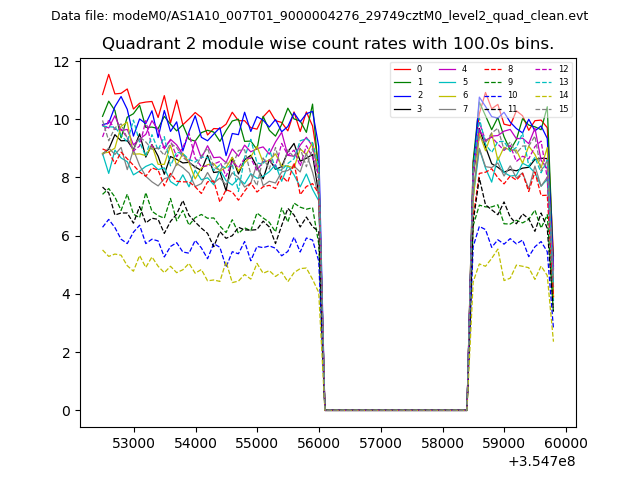
| Module-wise count rates for Quadrant B Data is divided into 100 sec bins |
 |
 |
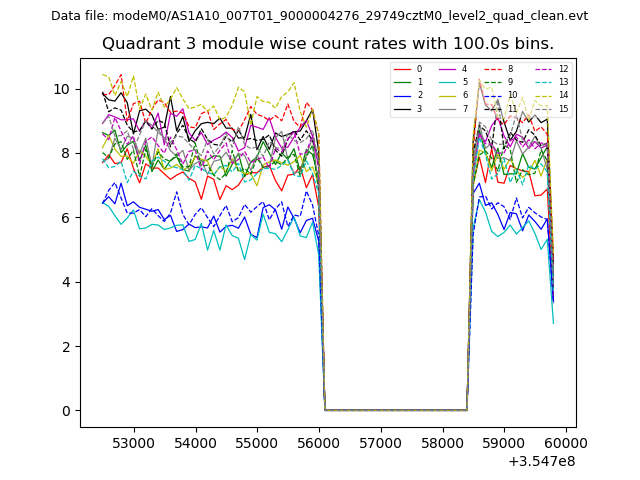
| Module-wise count rates for Quadrant C Data is divided into 100 sec bins |
 |
 |
| Module-wise count rates for Quadrant D Data is divided into 100 sec bins |
 |
 |
| Parameter | Plot |
|---|---|
| CZT HV Monitor | 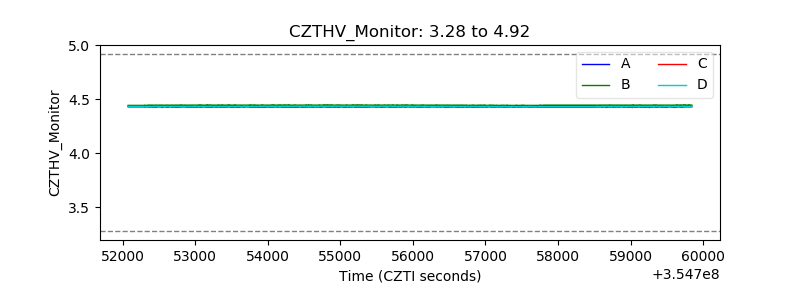 |
| D_VDD | 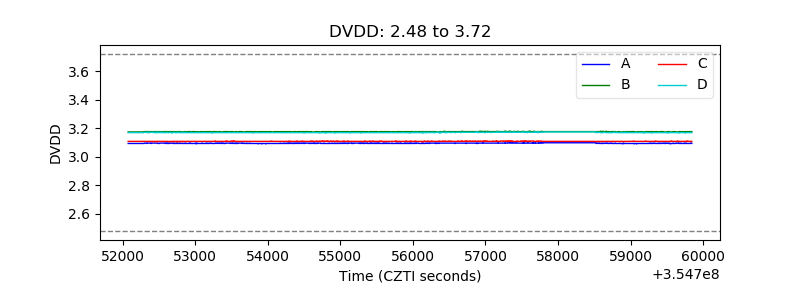 |
| Temperature 1 |  |
| Veto HV Monitor | 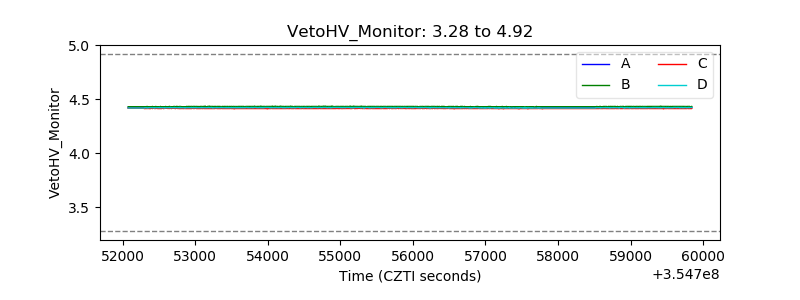 |
| Veto LLD | 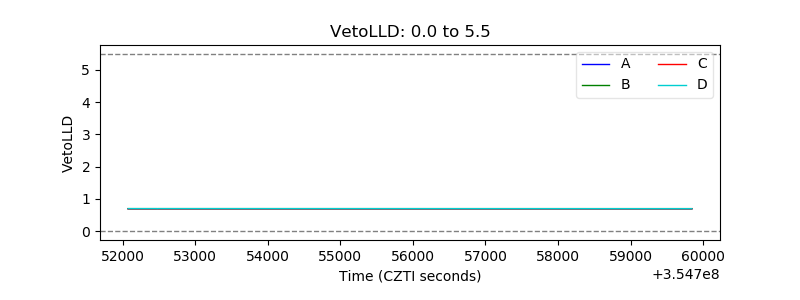 |
| Alpha Counter | 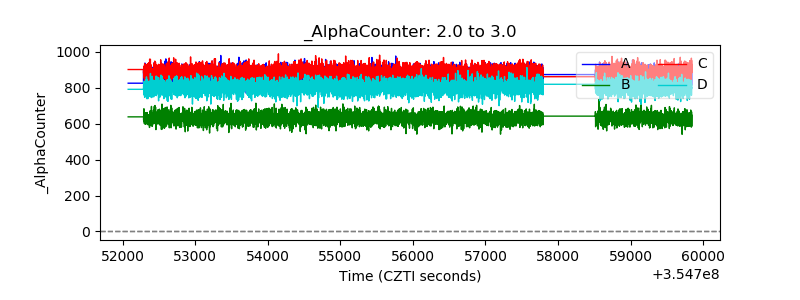 |
| _CPM_Rate | 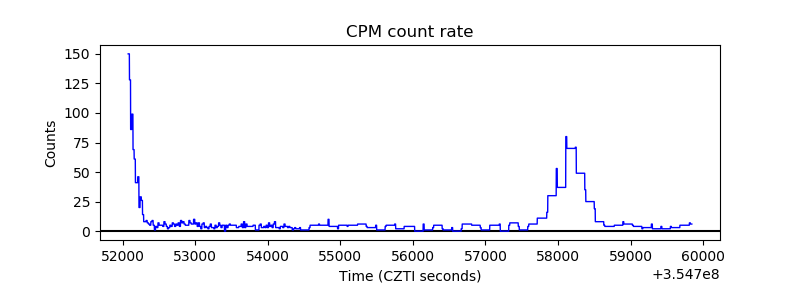 |
| CZT Counter | 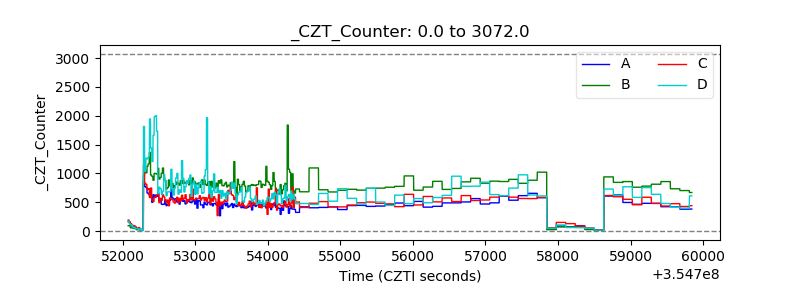 |
| +2.5 Volts monitor |  |
| +5 Volts monitor |  |
| _ROLL_ROT | 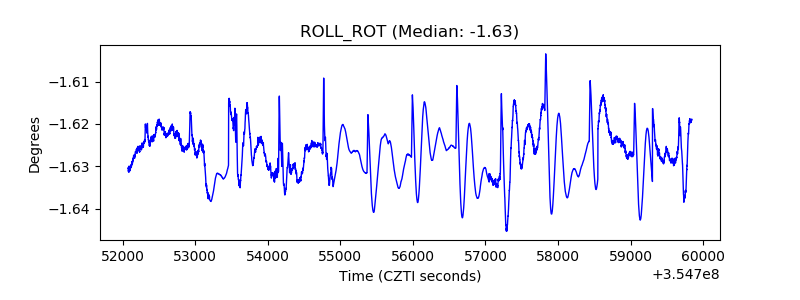 |
| _Roll_DEC | 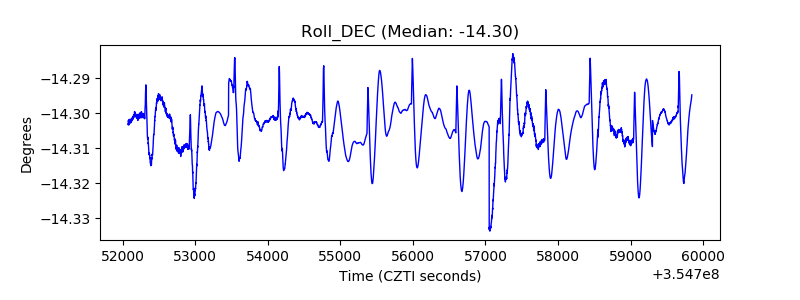 |
| _Roll_RA | 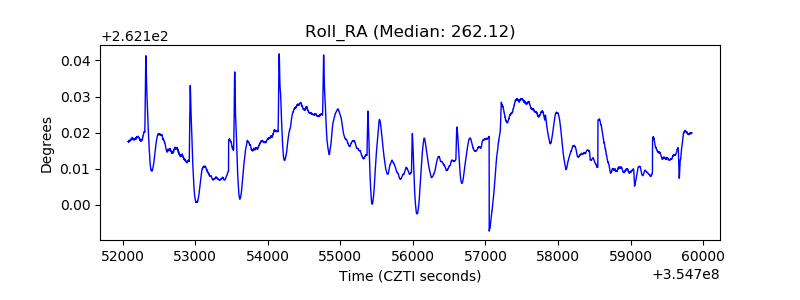 |
| Veto Counter | 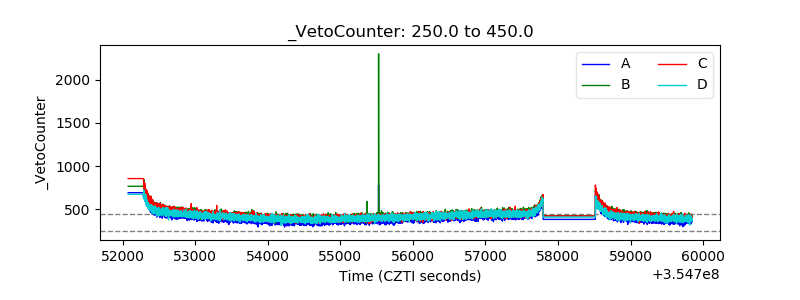 |