| Param | Original file | Final file |
|---|---|---|
| Filename | modeM0/AS1T03_291T01_9000004278cztM0_level2.fits | modeM0/AS1T03_291T01_9000004278cztM0_level2_quad_clean.evt |
| Size (bytes) | 5,775,992,640 | 5,079,902,400 |
| Size | 5.4 GB | 4.7 GB |
| Events in quadrant A | 36,998,514 | 31,121,788 |
| Events in quadrant B | 34,252,674 | 30,465,615 |
| Events in quadrant C | 34,983,346 | 28,804,612 |
| Events in quadrant D | 29,405,126 | 24,192,437 |
| Mode SS | |||
|---|---|---|---|
| Quadrant | BADHDUFLAG | Total packets | Discarded packets |
| A | 0 | 11694 | 0 |
| B | 0 | 11694 | 0 |
| C | 0 | 11694 | 0 |
| D | 0 | 11694 | 0 |
| Mode M0 | |||
|---|---|---|---|
| Quadrant | BADHDUFLAG | Total packets | Discarded packets |
| A | 0 | 1219692 | 0 |
| B | 0 | 1850650 | 0 |
| C | 0 | 1282804 | 0 |
| D | 0 | 1755149 | 0 |
| Mode M9 | |||
|---|---|---|---|
| Quadrant | BADHDUFLAG | Total packets | Discarded packets |
| A | 0 | 870 | 0 |
| B | 0 | 870 | 0 |
| C | 0 | 870 | 0 |
| D | 0 | 870 | 0 |
| Quadrant | Total seconds | Saturated seconds | Saturation percentage |
|---|---|---|---|
| A | 573265 | 7024 | 1.225262% |
| B | 573269 | 24760 | 4.319089% |
| C | 573268 | 13658 | 2.382481% |
| D | 573266 | 56664 | 9.884417% |
Noise dominated data is calculated using 1-second bins in cleaned event files. If a bin has >2000 counts, and if more than 50% of those come from <1% of pixels, then it is considered to be noise-dominated and hence unusable.
| Quadrant | # 1 sec bins | Bins with >0 counts | Bins with >2000 counts | High rate bins dominated by noise | Noise dominated (total time) | Noise dominated (detector-on time) | Marked lightcurve |
|---|---|---|---|---|---|---|---|
| A | 675458 | 573239 | 0 | 0 | 0.00% | 0.00% | 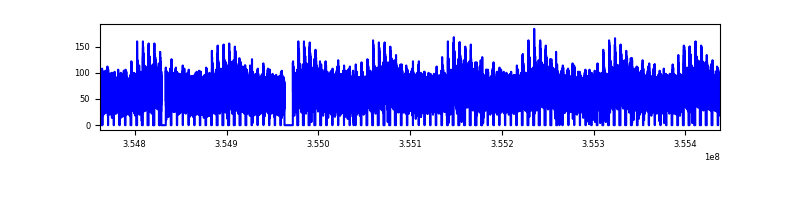 |
| B | 675458 | 573228 | 0 | 0 | 0.00% | 0.00% | 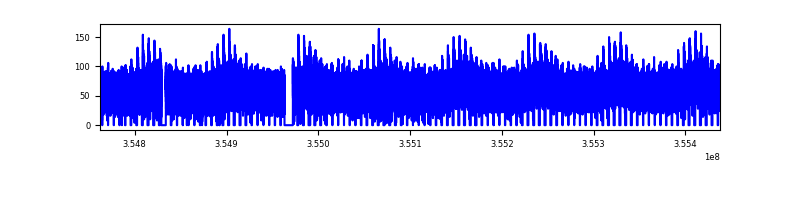 |
| C | 675458 | 573174 | 0 | 0 | 0.00% | 0.00% | 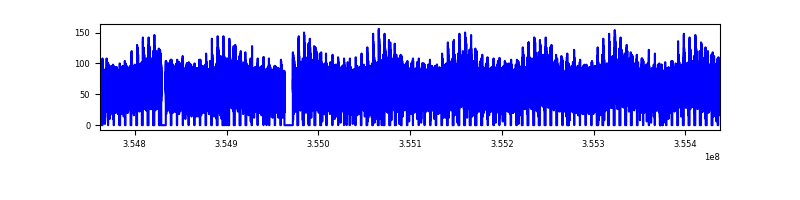 |
| D | 675458 | 571287 | 0 | 0 | 0.00% | 0.00% | 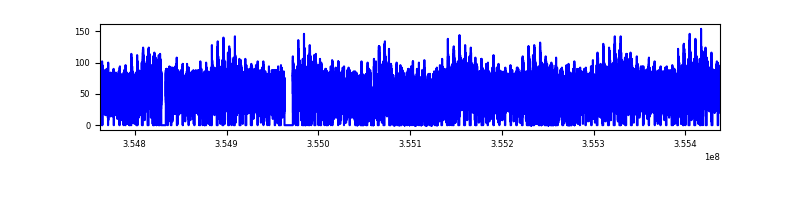 |
Top three noisy pixels from each quadrant. If the there are fewer than three noisy pixels in the level2.evt file, extra rows are filled as -1
| Pixel properties | Quadrant properties | ||||||
|---|---|---|---|---|---|---|---|
| Quadrant | DetID | PixID | Counts | Sigma | Mean | Median | Sigma |
| A | 0 | 29 | 30401 | 9.2 | 9664 | 9127 | 2312.5 |
| A | 7 | 110 | 29037 | 8.61 | 9664 | 9127 | 2312.5 |
| A | 9 | 19 | 27554 | 7.97 | 9664 | 9127 | 2312.5 |
| B | 2 | 9 | 26985 | 10.53 | 9084 | 8729 | 1732.9 |
| B | 5 | 128 | 22490 | 7.94 | 9084 | 8729 | 1732.9 |
| B | 2 | 8 | 22452 | 7.92 | 9084 | 8729 | 1732.9 |
| C | 12 | 241 | 24446 | 6.8 | 9259 | 8705 | 2313.9 |
| C | 3 | 126 | 23330 | 6.32 | 9259 | 8705 | 2313.9 |
| C | 9 | 209 | 23294 | 6.3 | 9259 | 8705 | 2313.9 |
| D | 15 | 46 | 22237 | 6.6 | 8408 | 7669 | 2206.9 |
| D | 10 | 189 | 20700 | 5.9 | 8408 | 7669 | 2206.9 |
| D | 7 | 3 | 20370 | 5.75 | 8408 | 7669 | 2206.9 |
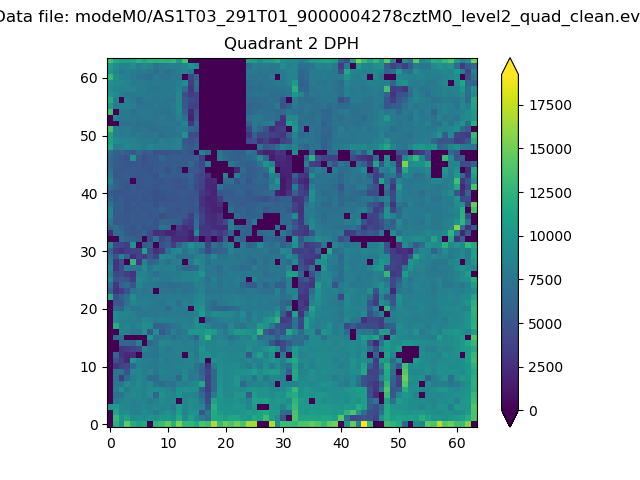
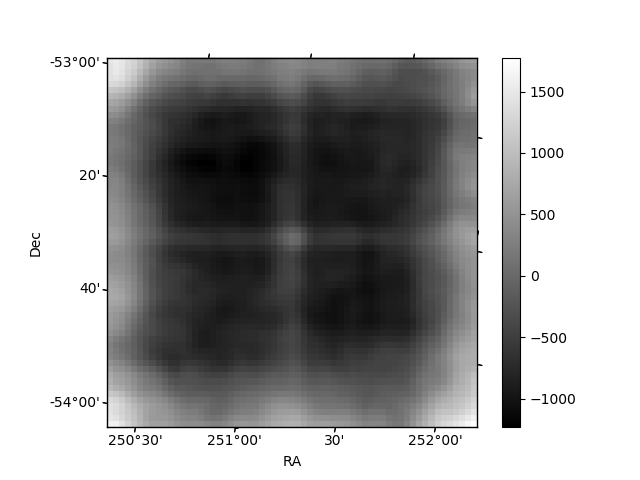
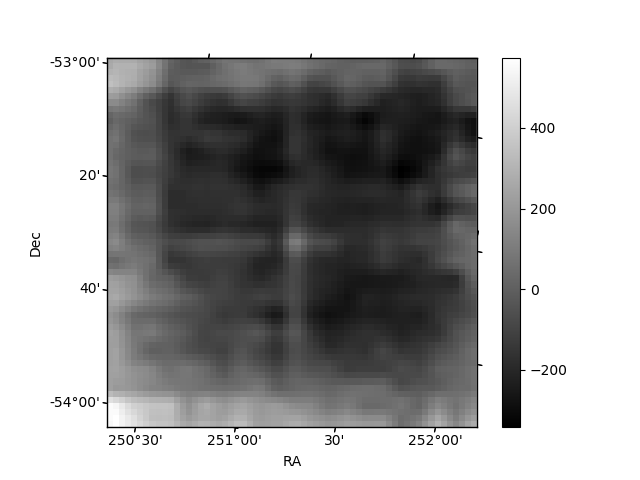
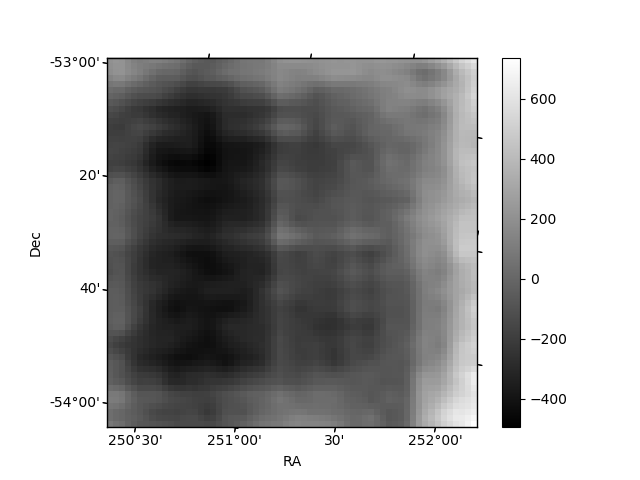
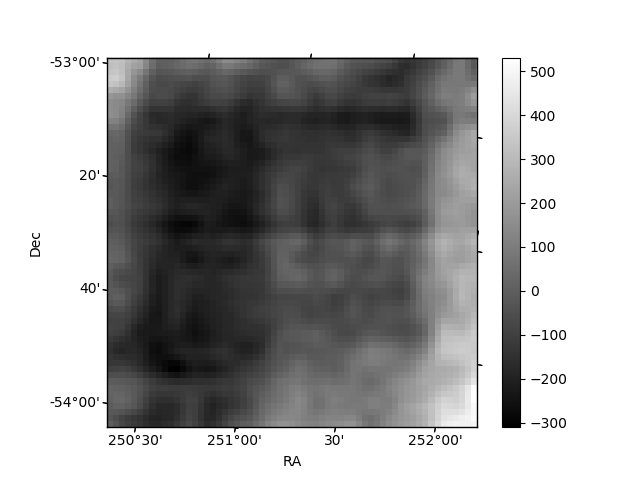
Histogram calculated using DETX and DETY for each event in the final _common_clean file
| Quadrant A | 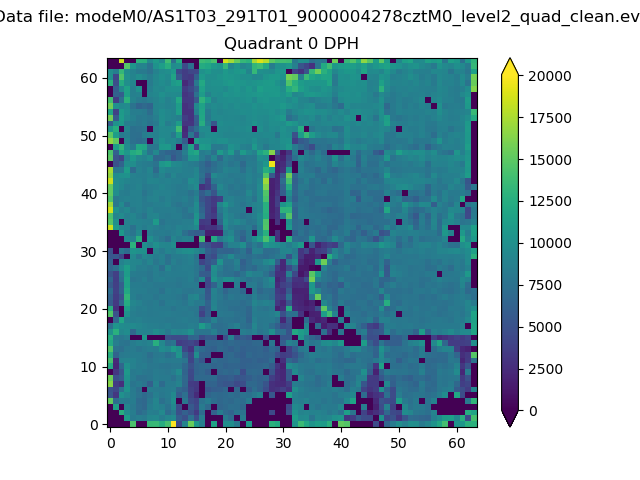 |
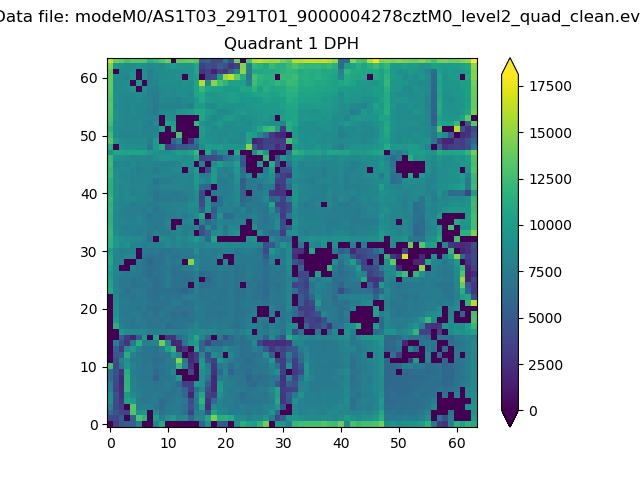 |
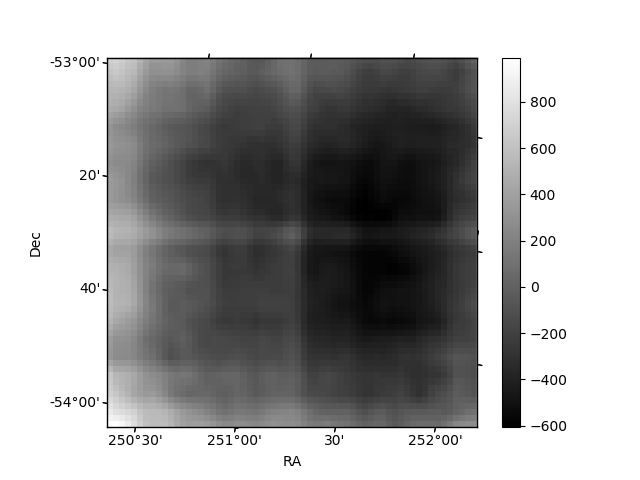
Quadrant B |
|---|---|---|---|
| Quadrant D | 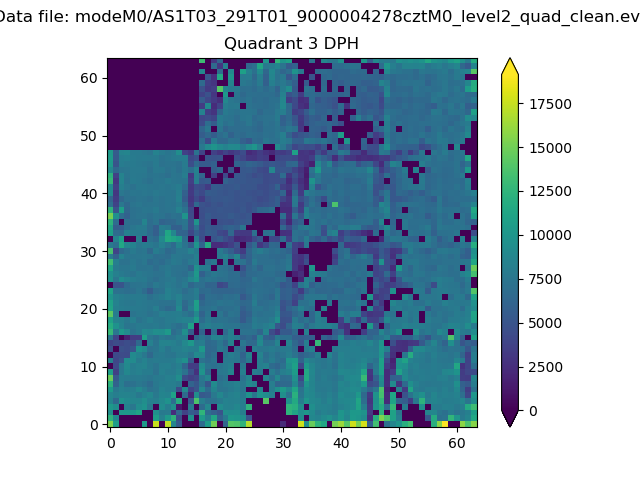 |
 |
Quadrant C |
| Plot type | Count rate plots | Images |
|---|---|---|
| Comparison with Poisson distribution Blue bars denote a histogram of data divided into 1 sec bins. Red curve is a Poisson curve with rate = median count rate of data. |
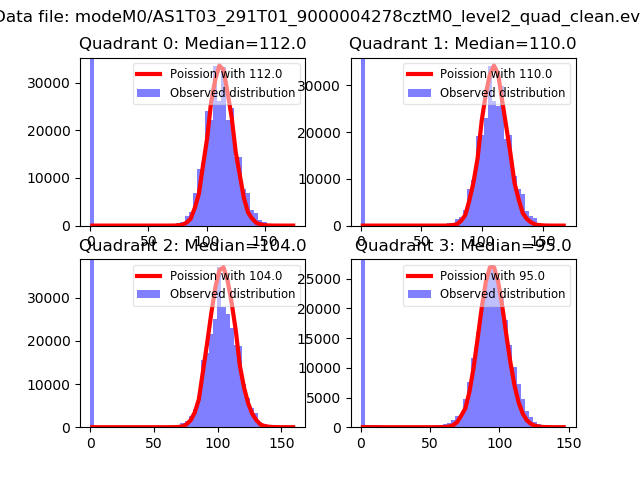 |
 |
| Quadrant-wise count rates Data is divided into 100 sec bins |
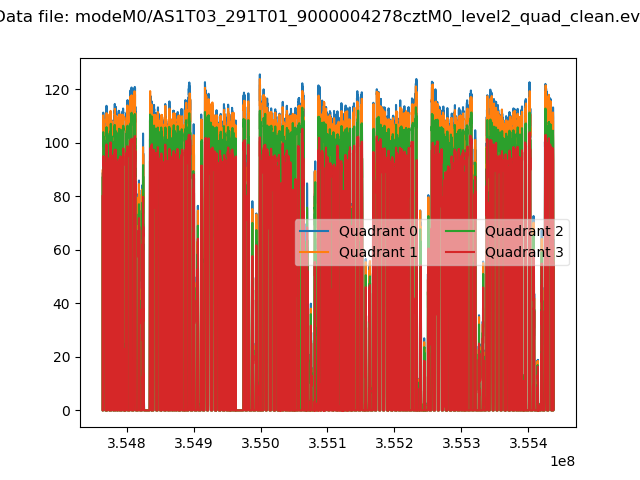 |
|
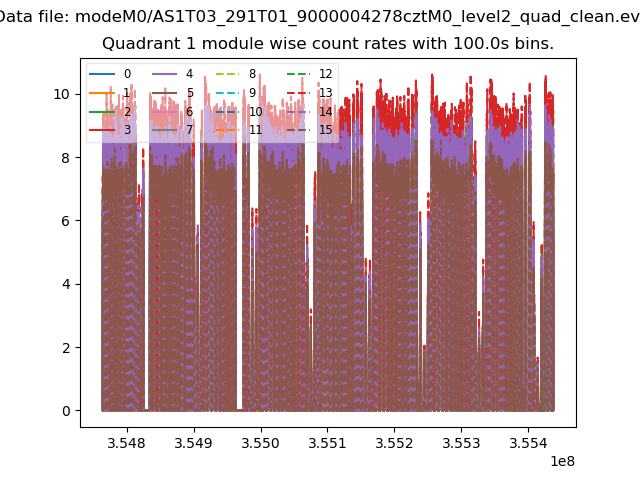
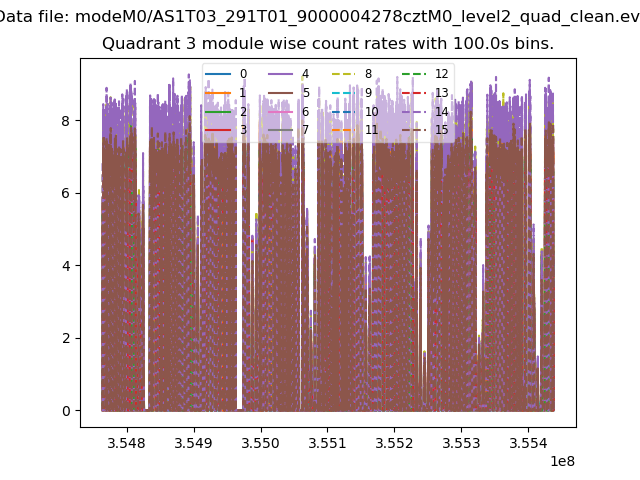
| Module-wise count rates for Quadrant A Data is divided into 100 sec bins |
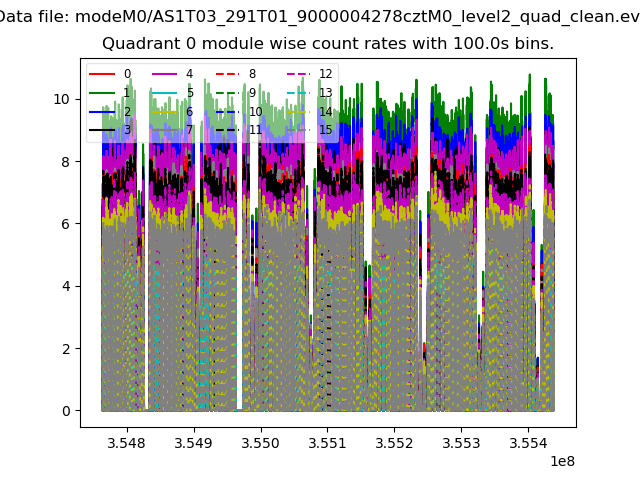 |
 |
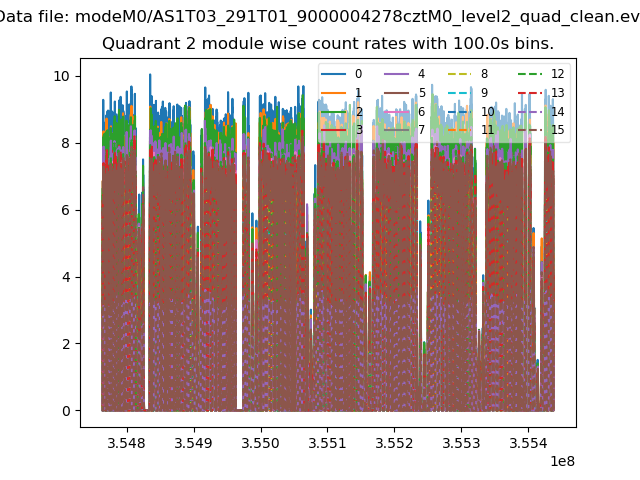
| Module-wise count rates for Quadrant B Data is divided into 100 sec bins |
 |
 |
| Module-wise count rates for Quadrant C Data is divided into 100 sec bins |
 |
 |
| Module-wise count rates for Quadrant D Data is divided into 100 sec bins |
 |
 |
| Parameter | Plot |
|---|---|
| CZT HV Monitor | 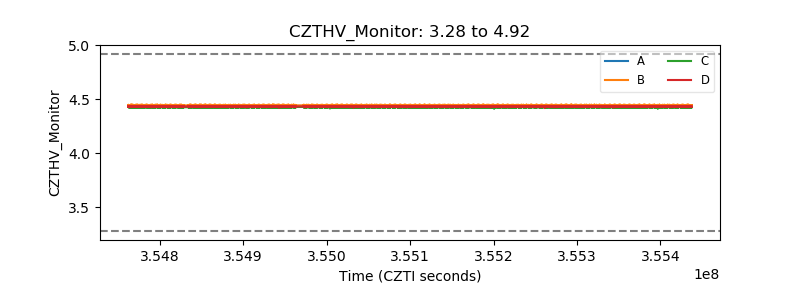 |
| D_VDD | 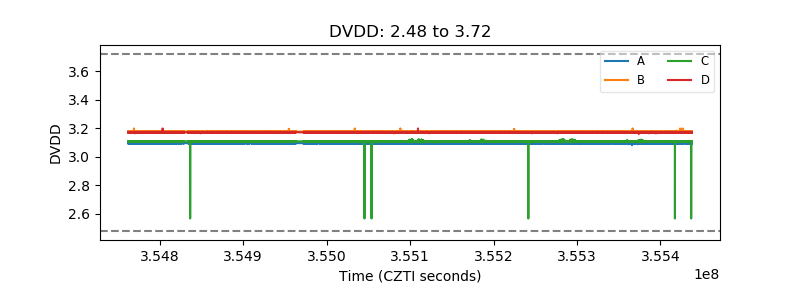 |
| Temperature 1 | 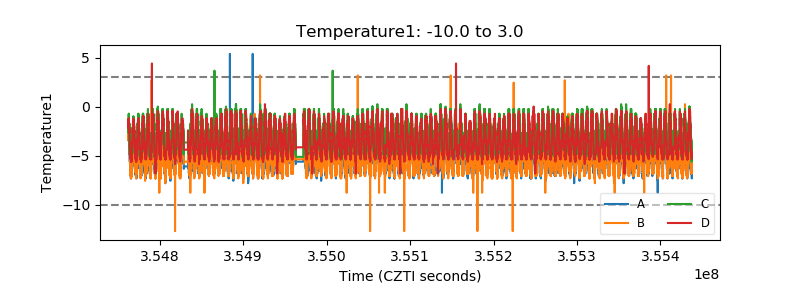 |
| Veto HV Monitor | 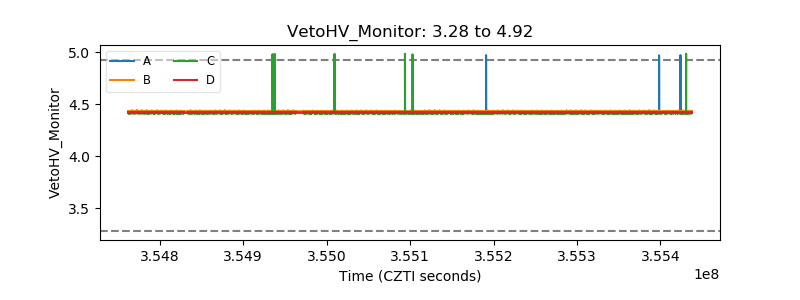 |
| Veto LLD | 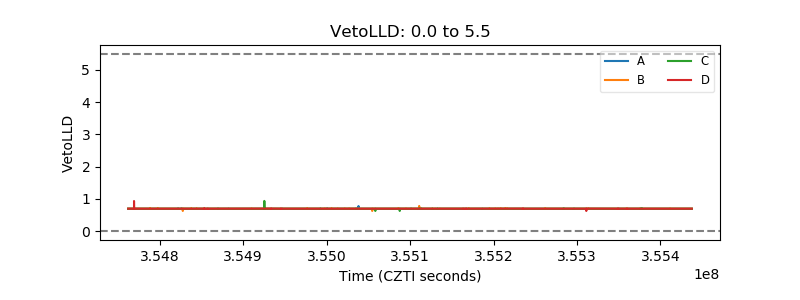 |
| Alpha Counter | 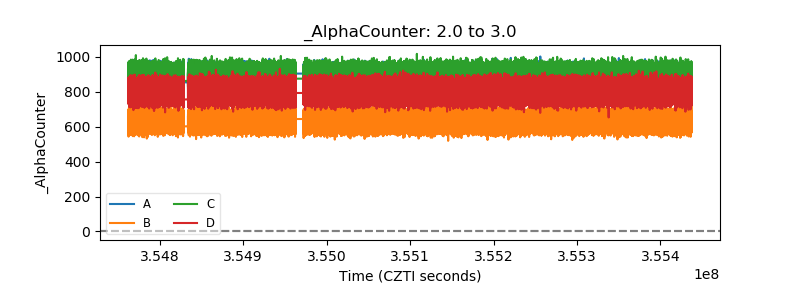 |
| _CPM_Rate | 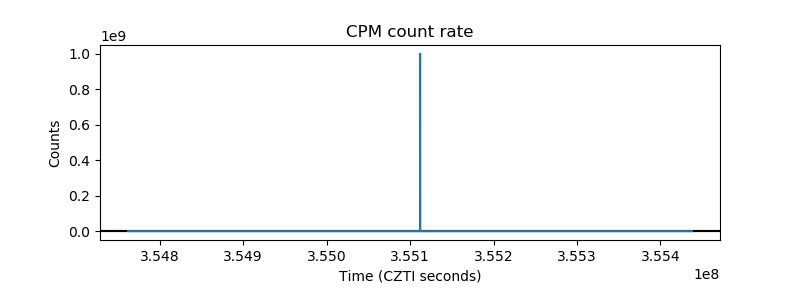 |
| CZT Counter | 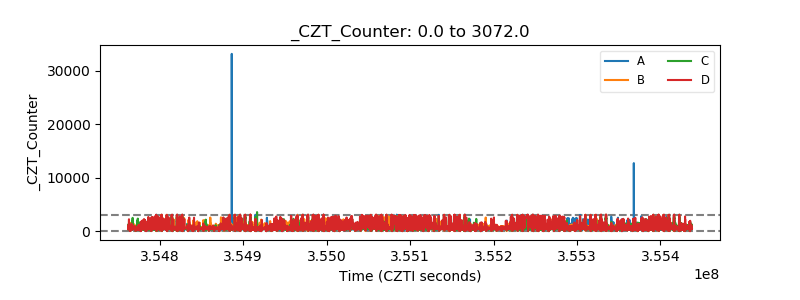 |
| +2.5 Volts monitor | 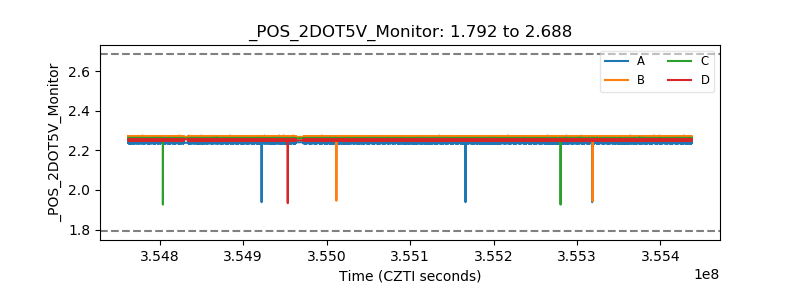 |
| +5 Volts monitor | 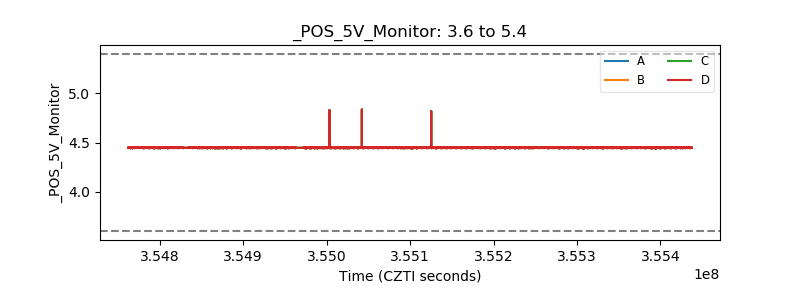 |
| _ROLL_ROT | 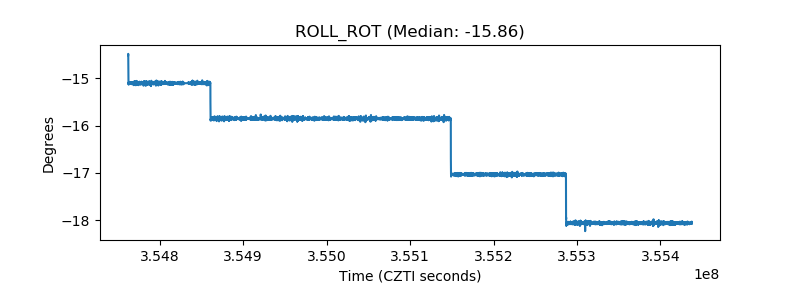 |
| _Roll_DEC | 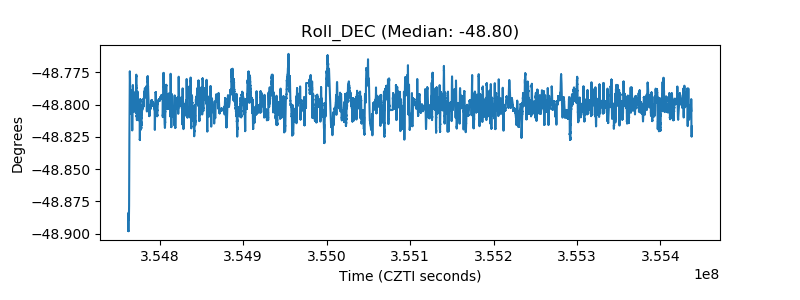 |
| _Roll_RA | 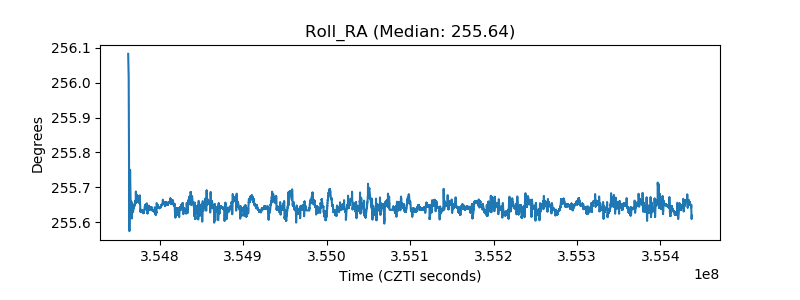 |
| Veto Counter | 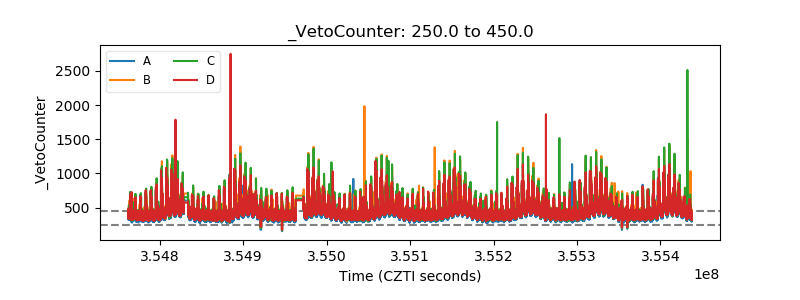 |