| Param | Original file | Final file |
|---|---|---|
| Filename | modeM0/AS1T03_291T01_9000004278_29750cztM0_level2.evt | modeM0/AS1T03_291T01_9000004278_29750cztM0_level2_quad_clean.evt |
| Size (bytes) | 324,984,960 | 44,484,480 |
| Size | 309.9 MB | 42.4 MB |
| Events in quadrant A | 1,895,751 | 276,379 |
| Events in quadrant B | 3,091,359 | 274,981 |
| Events in quadrant C | 2,031,678 | 263,684 |
| Events in quadrant D | 2,559,831 | 258,241 |
| Mode SS | |||
|---|---|---|---|
| Quadrant | BADHDUFLAG | Total packets | Discarded packets |
| A | 0 | 80 | 0 |
| B | 0 | 80 | 0 |
| C | 0 | 80 | 0 |
| D | 0 | 80 | 0 |
| Mode M0 | |||
|---|---|---|---|
| Quadrant | BADHDUFLAG | Total packets | Discarded packets |
| A | 0 | 8022 | 1 |
| B | 0 | 11899 | 1 |
| C | 0 | 8317 | 1 |
| D | 0 | 10237 | 1 |
| Mode M9 | |||
|---|---|---|---|
| Quadrant | BADHDUFLAG | Total packets | Discarded packets |
| A | 0 | 3 | 0 |
| B | 0 | 3 | 0 |
| C | 0 | 3 | 0 |
| D | 0 | 3 | 0 |
| Quadrant | Total seconds | Saturated seconds | Saturation percentage |
|---|---|---|---|
| A | 3867 | 27 | 0.698216% |
| B | 3867 | 119 | 3.077321% |
| C | 3867 | 119 | 3.077321% |
| D | 3867 | 71 | 1.836049% |
Noise dominated data is calculated using 1-second bins in cleaned event files. If a bin has >2000 counts, and if more than 50% of those come from <1% of pixels, then it is considered to be noise-dominated and hence unusable.
| Quadrant | # 1 sec bins | Bins with >0 counts | Bins with >2000 counts | High rate bins dominated by noise | Noise dominated (total time) | Noise dominated (detector-on time) | Marked lightcurve |
|---|---|---|---|---|---|---|---|
| A | 4157 | 3869 | 0 | 0 | 0.00% | 0.00% |  |
| B | 4157 | 3867 | 6 | 6 | 0.14% | 0.16% | 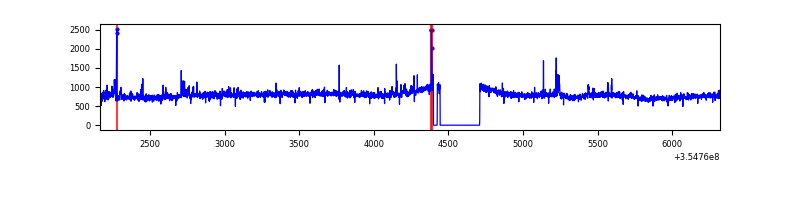 |
| C | 4157 | 3867 | 3 | 3 | 0.07% | 0.08% | 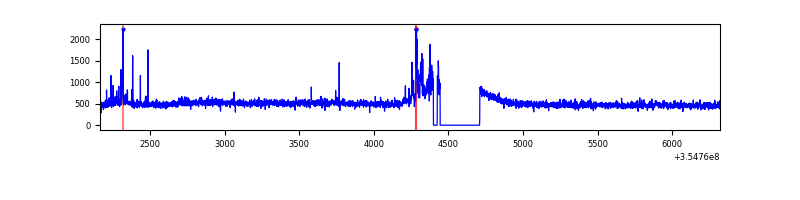 |
| D | 4157 | 3869 | 39 | 39 | 0.94% | 1.01% |  |
Top three noisy pixels from each quadrant. If the there are fewer than three noisy pixels in the level2.evt file, extra rows are filled as -1
| Pixel properties | Quadrant properties | ||||||
|---|---|---|---|---|---|---|---|
| Quadrant | DetID | PixID | Counts | Sigma | Mean | Median | Sigma |
| A | 13 | 254 | 7408 | 69.7 | 491 | 480 | 99.4 |
| A | 3 | 137 | 5088 | 46.36 | 491 | 480 | 99.4 |
| A | 0 | 226 | 4221 | 37.64 | 491 | 480 | 99.4 |
| B | 6 | 159 | 1094416 | 11535.38 | 485 | 473 | 94.8 |
| B | 0 | 229 | 39992 | 416.72 | 485 | 473 | 94.8 |
| B | 5 | 172 | 13769 | 140.2 | 485 | 473 | 94.8 |
| C | 10 | 22 | 85431 | 761.05 | 471 | 472 | 111.6 |
| C | 14 | 238 | 75307 | 670.36 | 471 | 472 | 111.6 |
| C | 3 | 233 | 22098 | 193.72 | 471 | 472 | 111.6 |
| D | 8 | 195 | 570831 | 4946.84 | 473 | 460 | 115.3 |
| D | 13 | 104 | 78638 | 678.04 | 473 | 460 | 115.3 |
| D | 2 | 250 | 48116 | 413.32 | 473 | 460 | 115.3 |
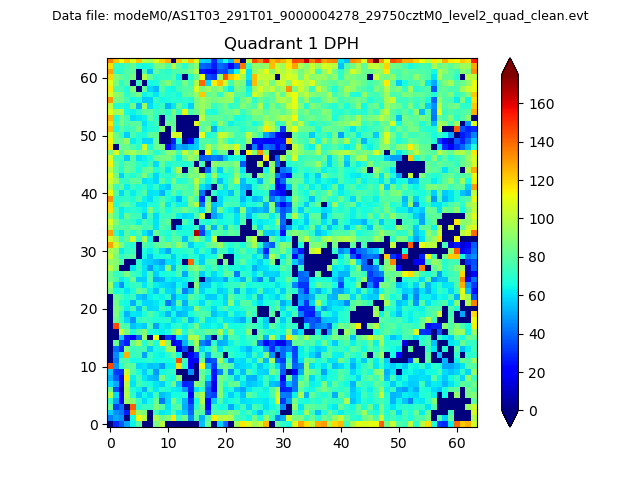
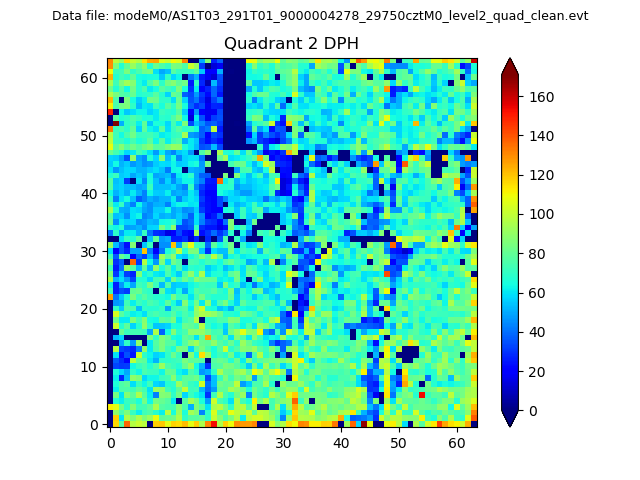
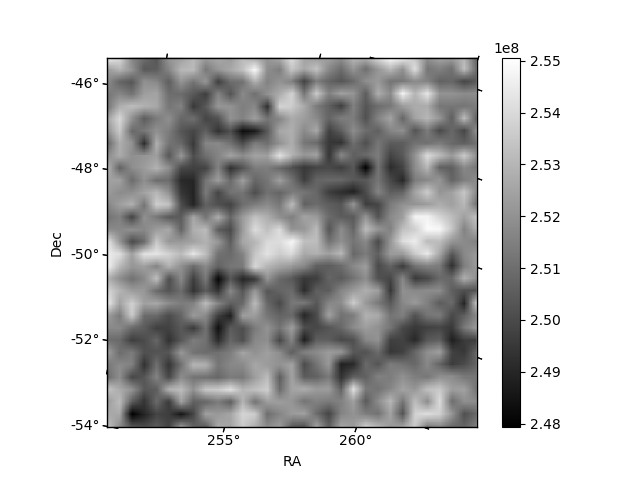
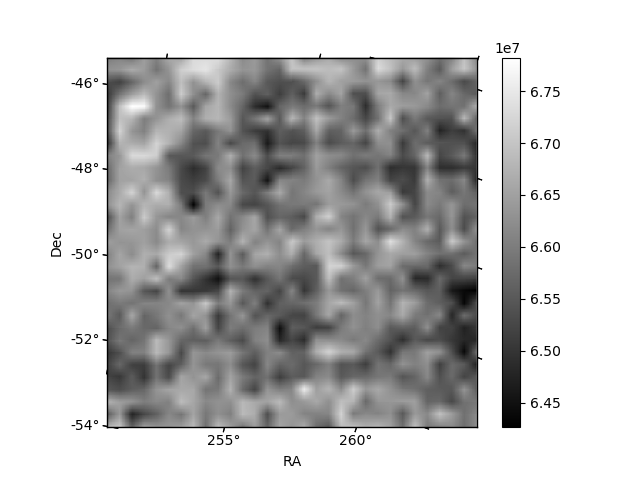
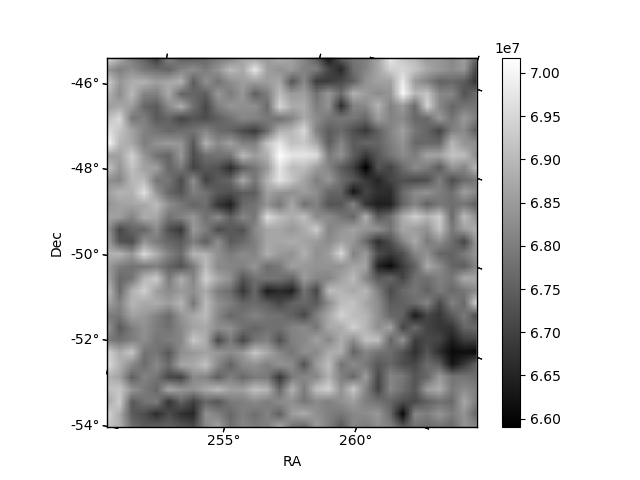
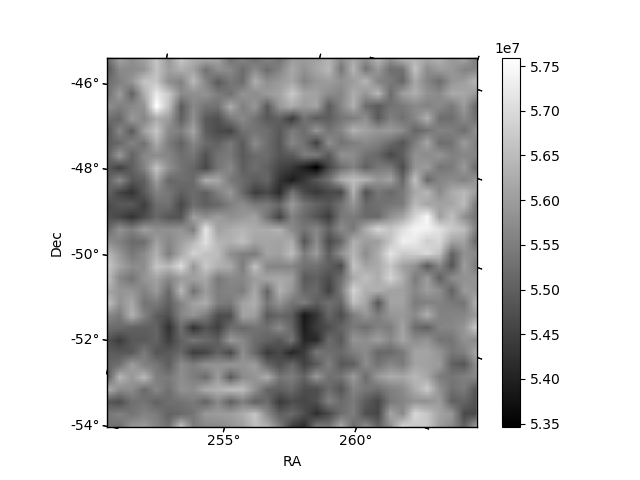
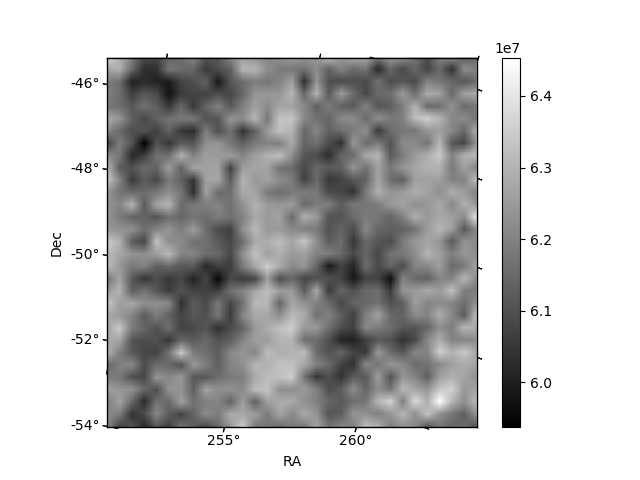
Histogram calculated using DETX and DETY for each event in the final _common_clean file
| Quadrant A | 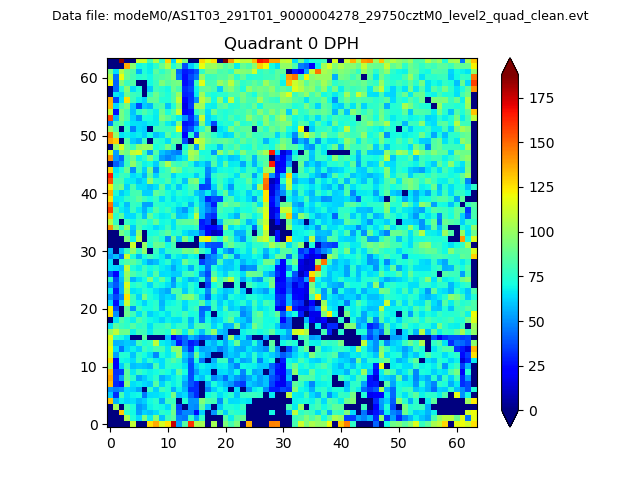 |
 |
Quadrant B |
|---|---|---|---|
| Quadrant D | 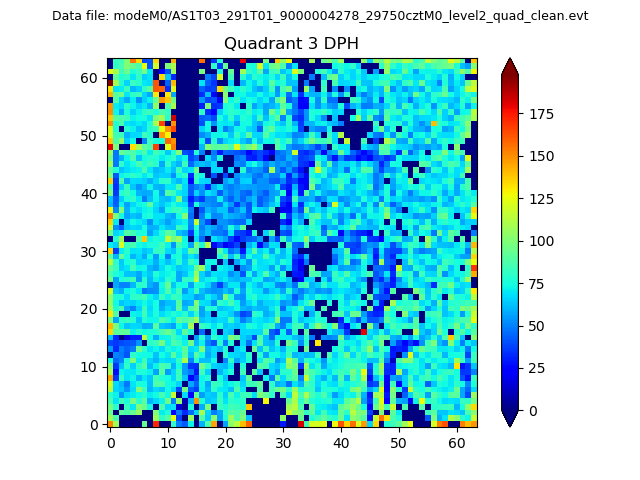 |
 |
Quadrant C |
| Plot type | Count rate plots | Images |
|---|---|---|
| Comparison with Poisson distribution Blue bars denote a histogram of data divided into 1 sec bins. Red curve is a Poisson curve with rate = median count rate of data. |
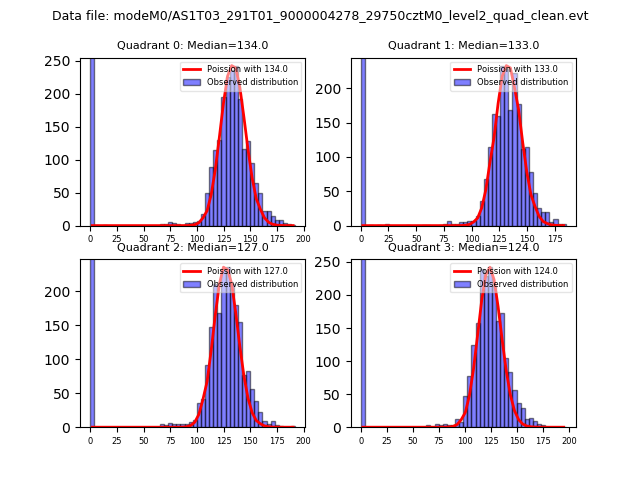 |
 |
| Quadrant-wise count rates Data is divided into 100 sec bins |
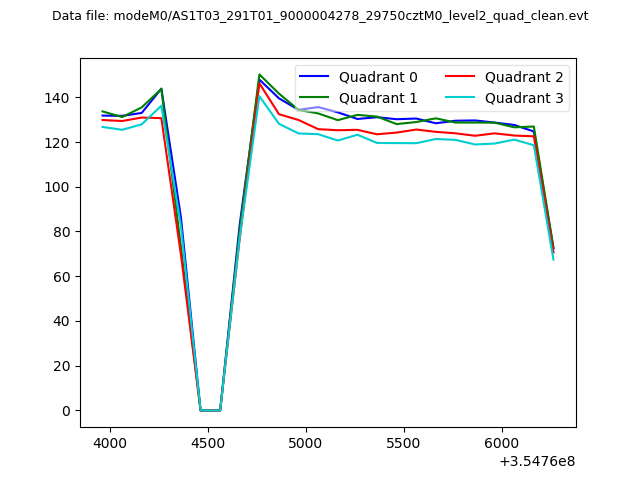 |
|
| Module-wise count rates for Quadrant A Data is divided into 100 sec bins |
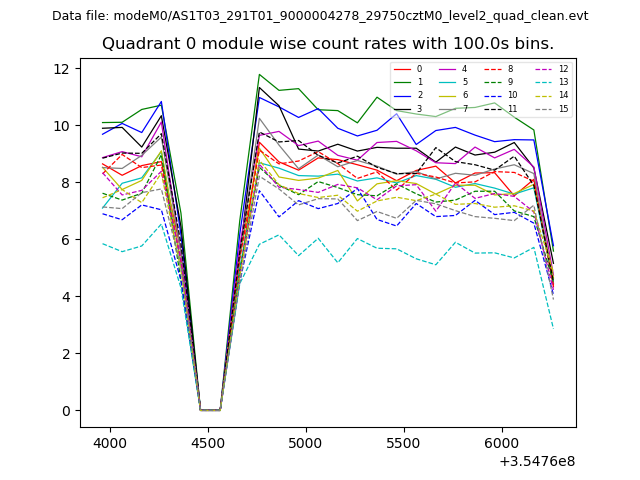 |
 |
| Module-wise count rates for Quadrant B Data is divided into 100 sec bins |
 |
 |
| Module-wise count rates for Quadrant C Data is divided into 100 sec bins |
 |
 |
| Module-wise count rates for Quadrant D Data is divided into 100 sec bins |
 |
 |
| Parameter | Plot |
|---|---|
| CZT HV Monitor | 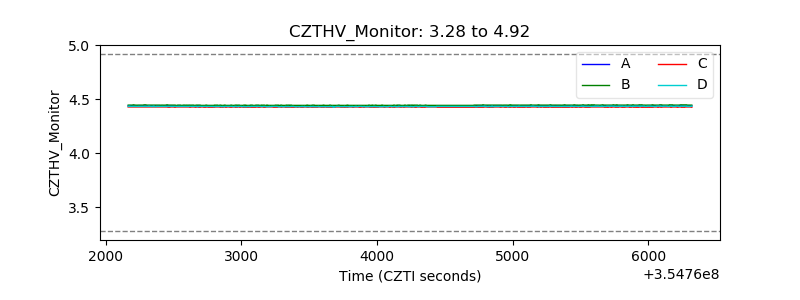 |
| D_VDD | 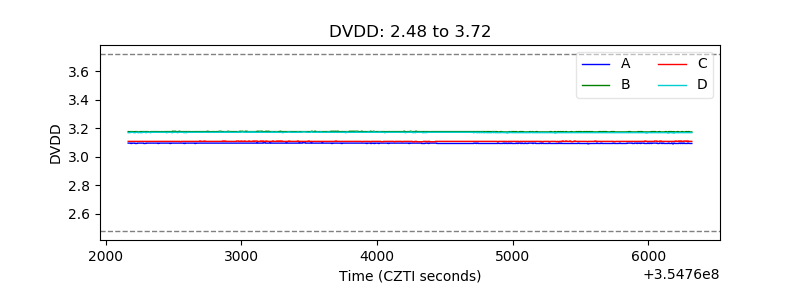 |
| Temperature 1 | 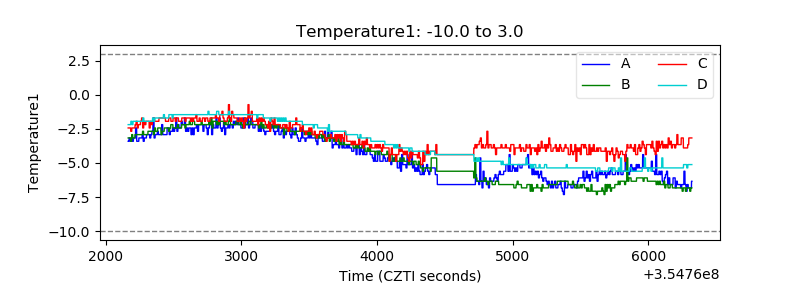 |
| Veto HV Monitor |  |
| Veto LLD | 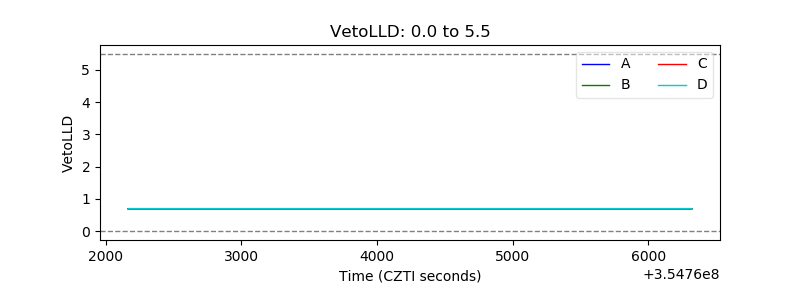 |
| Alpha Counter | 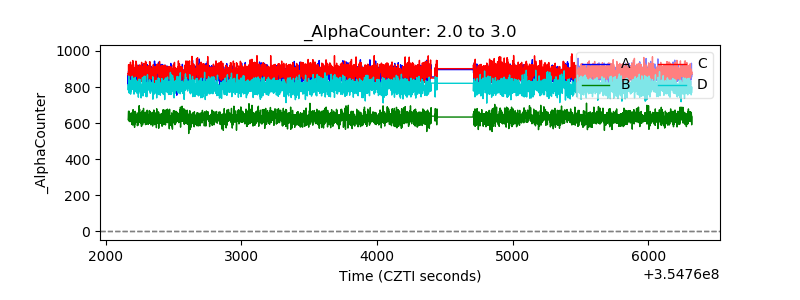 |
| _CPM_Rate | 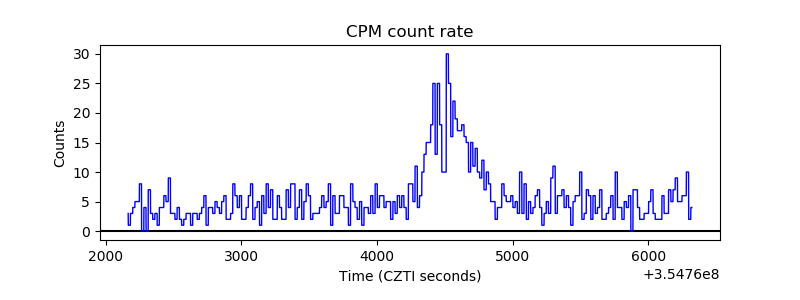 |
| CZT Counter | 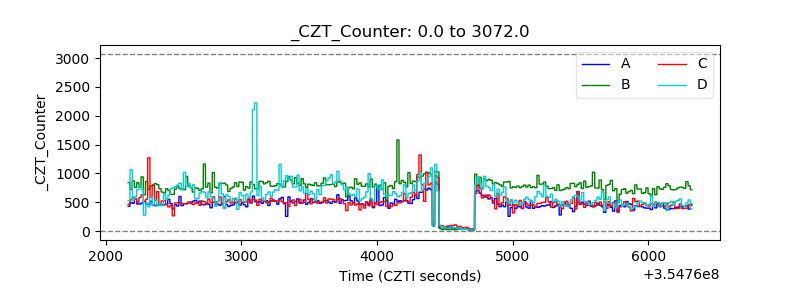 |
| +2.5 Volts monitor | 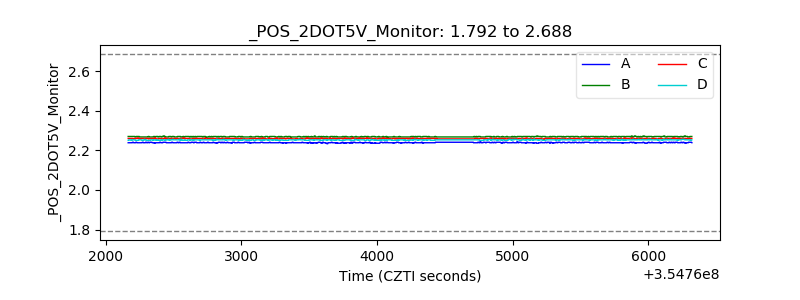 |
| +5 Volts monitor |  |
| _ROLL_ROT |  |
| _Roll_DEC |  |
| _Roll_RA | 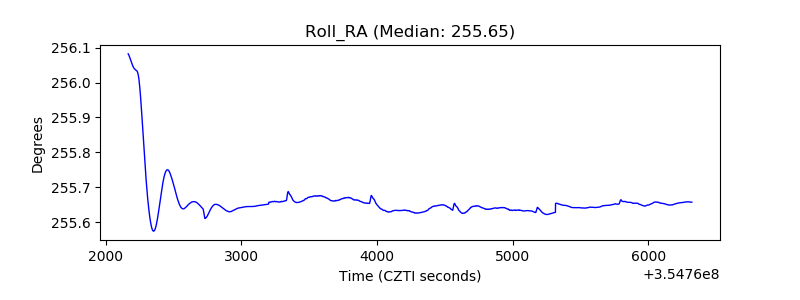 |
| Veto Counter | 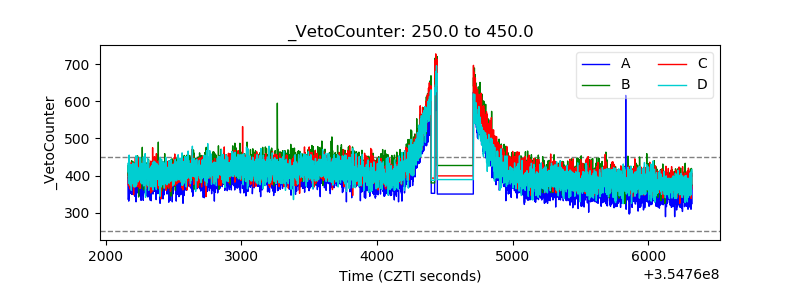 |