| Param | Original file | Final file |
|---|---|---|
| Filename | modeM0/AS1T03_291T01_9000004278_29758cztM0_level2.evt | modeM0/AS1T03_291T01_9000004278_29758cztM0_level2_quad_clean.evt |
| Size (bytes) | 572,503,680 | 64,987,200 |
| Size | 546.0 MB | 62.0 MB |
| Events in quadrant A | 3,205,457 | 400,437 |
| Events in quadrant B | 5,427,224 | 393,449 |
| Events in quadrant C | 3,589,849 | 373,272 |
| Events in quadrant D | 4,695,588 | 366,725 |
| Mode SS | |||
|---|---|---|---|
| Quadrant | BADHDUFLAG | Total packets | Discarded packets |
| A | 0 | 128 | 0 |
| B | 0 | 128 | 0 |
| C | 0 | 128 | 0 |
| D | 0 | 128 | 0 |
| Mode M0 | |||
|---|---|---|---|
| Quadrant | BADHDUFLAG | Total packets | Discarded packets |
| A | 0 | 13470 | 1 |
| B | 0 | 20101 | 1 |
| C | 0 | 14626 | 1 |
| D | 0 | 18158 | 1 |
| Mode M9 | |||
|---|---|---|---|
| Quadrant | BADHDUFLAG | Total packets | Discarded packets |
| A | 0 | 11 | 0 |
| B | 0 | 11 | 0 |
| C | 0 | 11 | 0 |
| D | 0 | 11 | 0 |
| Quadrant | Total seconds | Saturated seconds | Saturation percentage |
|---|---|---|---|
| A | 6203 | 67 | 1.080123% |
| B | 6204 | 185 | 2.981947% |
| C | 6204 | 124 | 1.998711% |
| D | 6204 | 355 | 5.722115% |
Noise dominated data is calculated using 1-second bins in cleaned event files. If a bin has >2000 counts, and if more than 50% of those come from <1% of pixels, then it is considered to be noise-dominated and hence unusable.
| Quadrant | # 1 sec bins | Bins with >0 counts | Bins with >2000 counts | High rate bins dominated by noise | Noise dominated (total time) | Noise dominated (detector-on time) | Marked lightcurve |
|---|---|---|---|---|---|---|---|
| A | 7373 | 6203 | 0 | 0 | 0.00% | 0.00% | 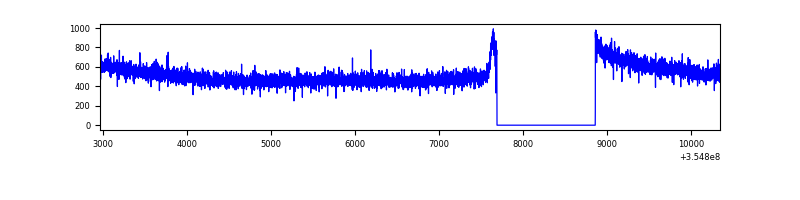 |
| B | 7374 | 6204 | 39 | 39 | 0.53% | 0.63% | 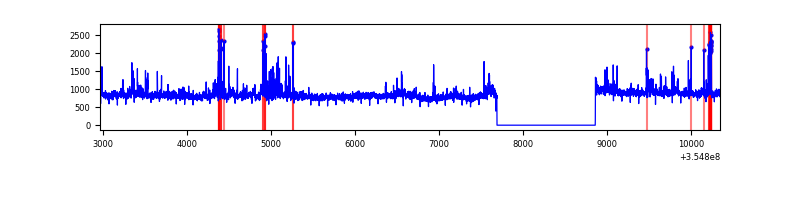 |
| C | 7374 | 6204 | 10 | 10 | 0.14% | 0.16% | 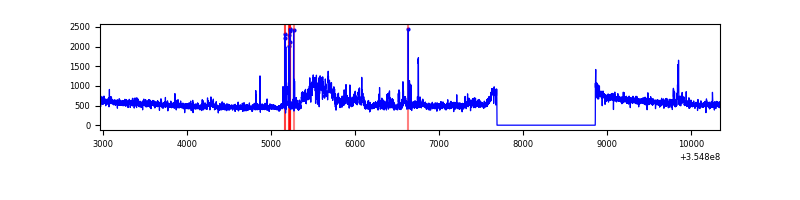 |
| D | 7373 | 6203 | 253 | 253 | 3.43% | 4.08% | 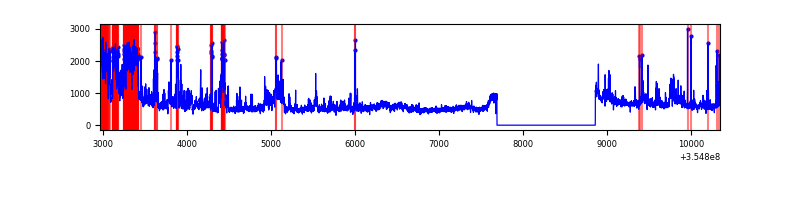 |
Top three noisy pixels from each quadrant. If the there are fewer than three noisy pixels in the level2.evt file, extra rows are filled as -1
| Pixel properties | Quadrant properties | ||||||
|---|---|---|---|---|---|---|---|
| Quadrant | DetID | PixID | Counts | Sigma | Mean | Median | Sigma |
| A | 13 | 254 | 11821 | 67.23 | 830 | 815 | 163.7 |
| A | 3 | 137 | 7544 | 41.11 | 830 | 815 | 163.7 |
| A | 0 | 226 | 7050 | 38.09 | 830 | 815 | 163.7 |
| B | 6 | 159 | 1800224 | 11751.17 | 814 | 794 | 153.1 |
| B | 5 | 255 | 201330 | 1309.6 | 814 | 794 | 153.1 |
| B | 0 | 229 | 190920 | 1241.62 | 814 | 794 | 153.1 |
| C | 3 | 233 | 382606 | 2135.94 | 778 | 784 | 178.8 |
| C | 14 | 238 | 127585 | 709.33 | 778 | 784 | 178.8 |
| C | 7 | 247 | 30627 | 166.94 | 778 | 784 | 178.8 |
| D | 7 | 80 | 889441 | 4846.42 | 783 | 763 | 183.4 |
| D | 8 | 195 | 723496 | 3941.44 | 783 | 763 | 183.4 |
| D | 2 | 250 | 55283 | 297.33 | 783 | 763 | 183.4 |
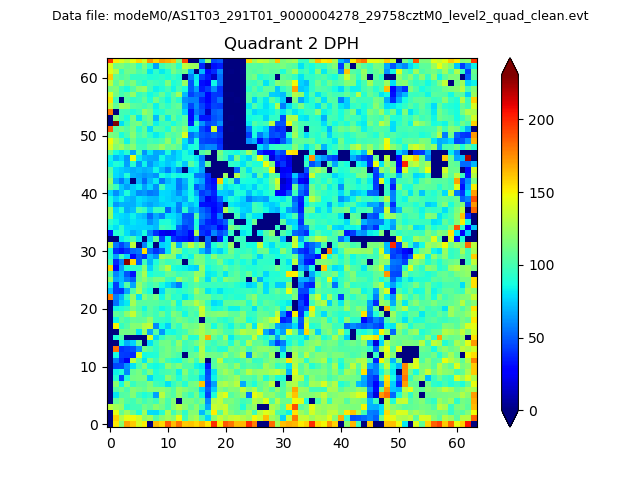
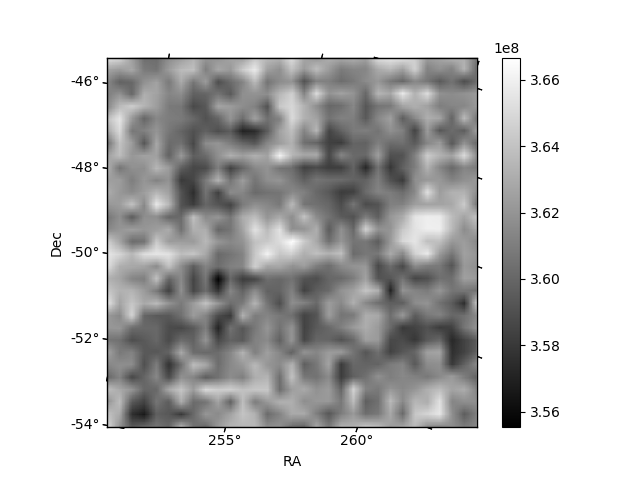
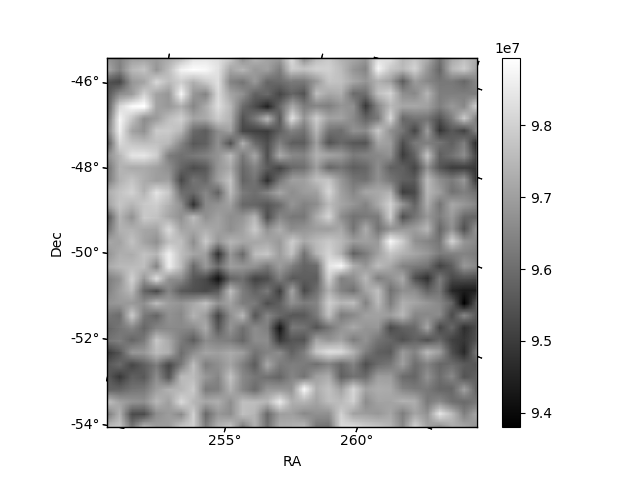
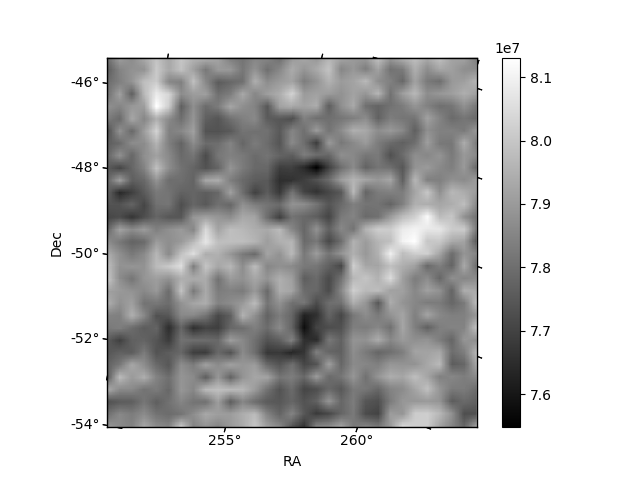
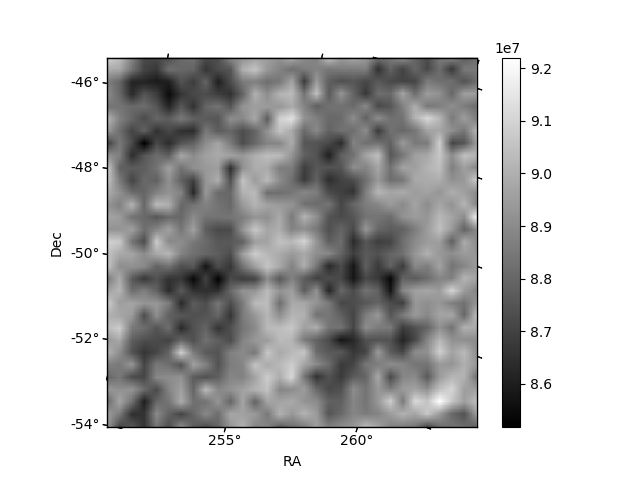
Histogram calculated using DETX and DETY for each event in the final _common_clean file
| Quadrant A | 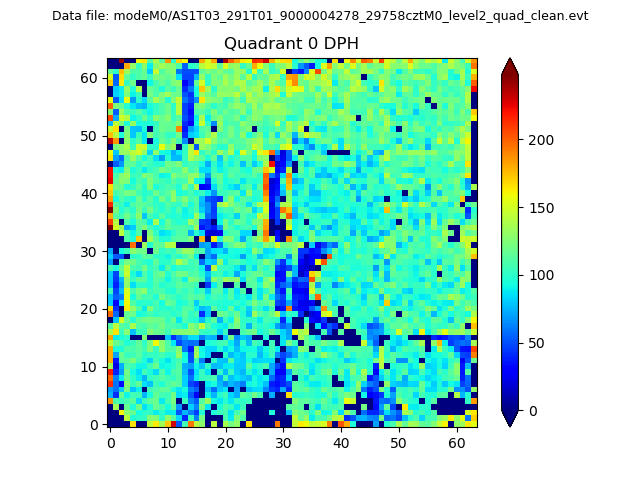 |
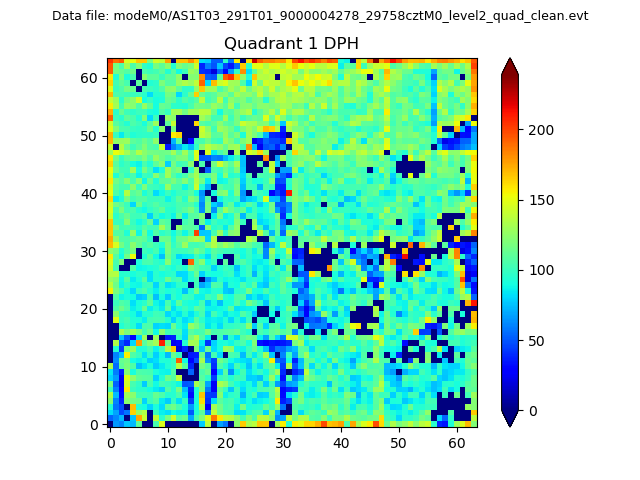 |
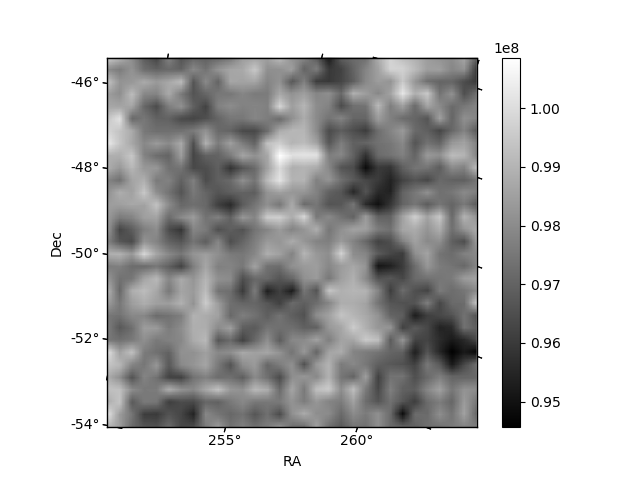
Quadrant B |
|---|---|---|---|
| Quadrant D | 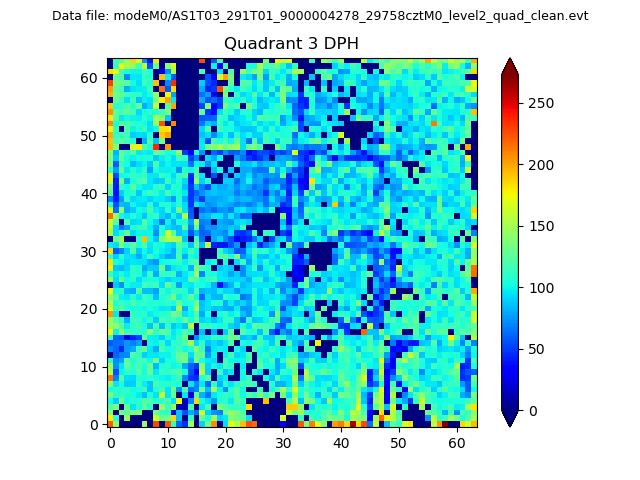 |
 |
Quadrant C |
| Plot type | Count rate plots | Images |
|---|---|---|
| Comparison with Poisson distribution Blue bars denote a histogram of data divided into 1 sec bins. Red curve is a Poisson curve with rate = median count rate of data. |
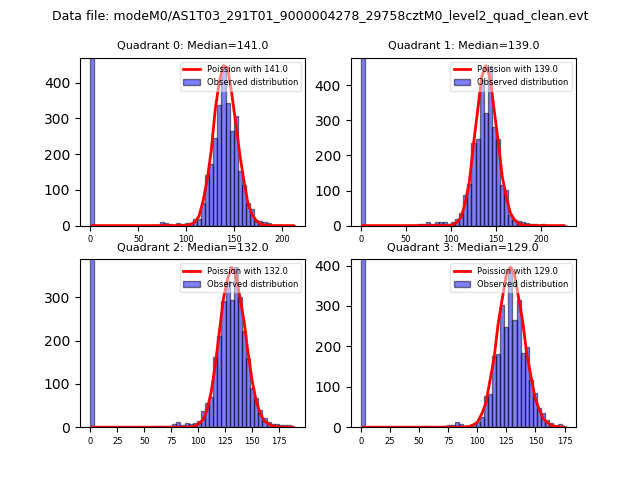 |
 |
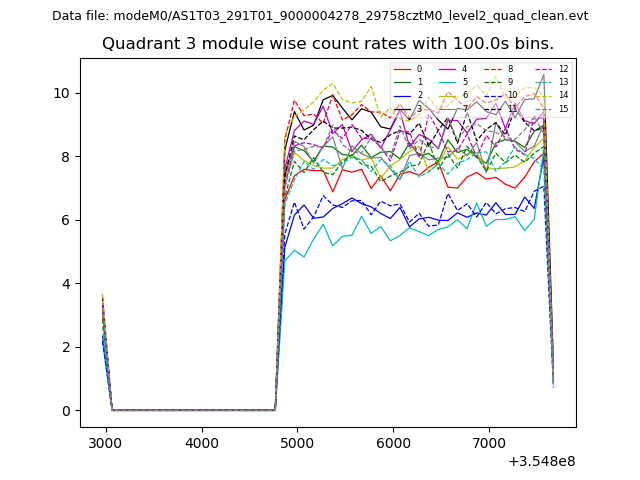
| Quadrant-wise count rates Data is divided into 100 sec bins |
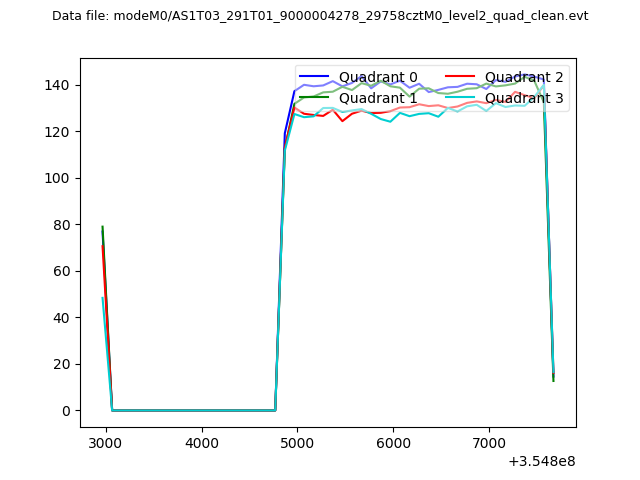 |
|
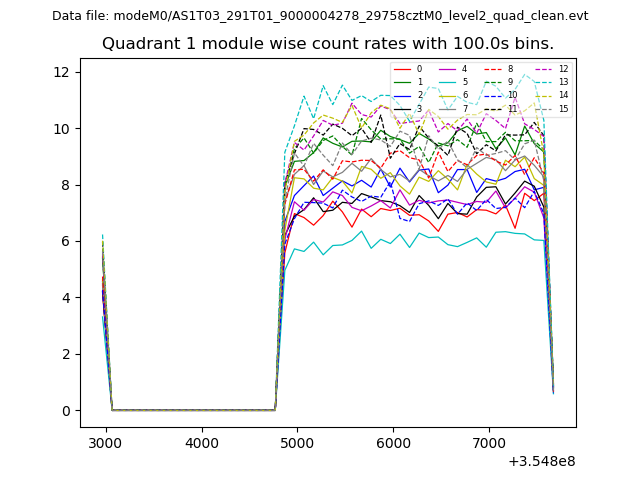
| Module-wise count rates for Quadrant A Data is divided into 100 sec bins |
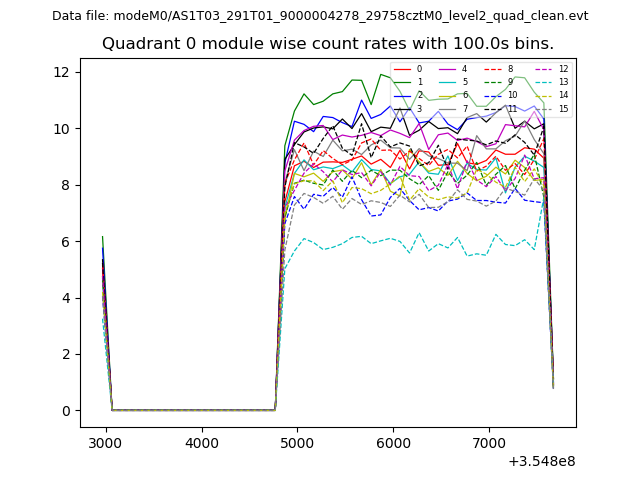 |
 |
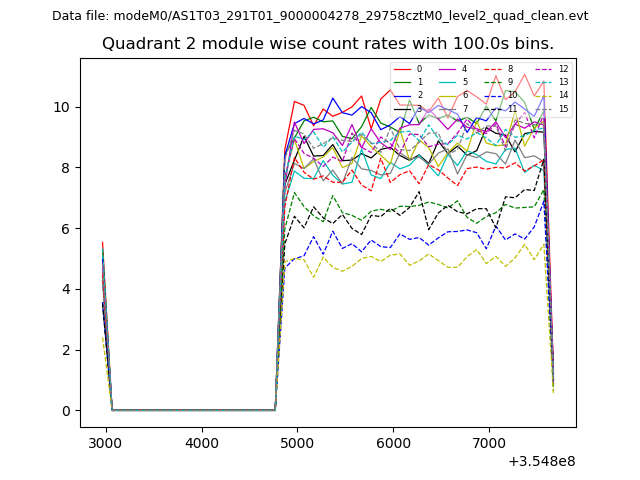
| Module-wise count rates for Quadrant B Data is divided into 100 sec bins |
 |
 |
| Module-wise count rates for Quadrant C Data is divided into 100 sec bins |
 |
 |
| Module-wise count rates for Quadrant D Data is divided into 100 sec bins |
 |
 |
| Parameter | Plot |
|---|---|
| CZT HV Monitor | 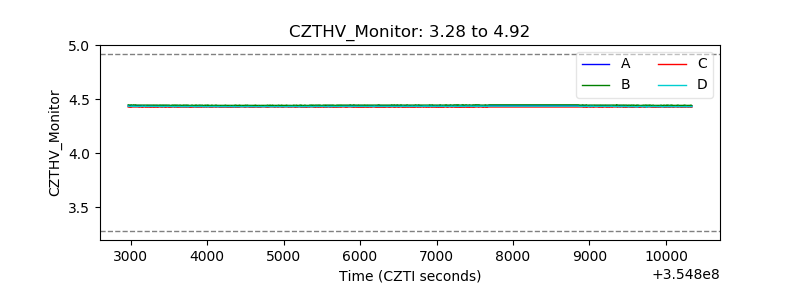 |
| D_VDD | 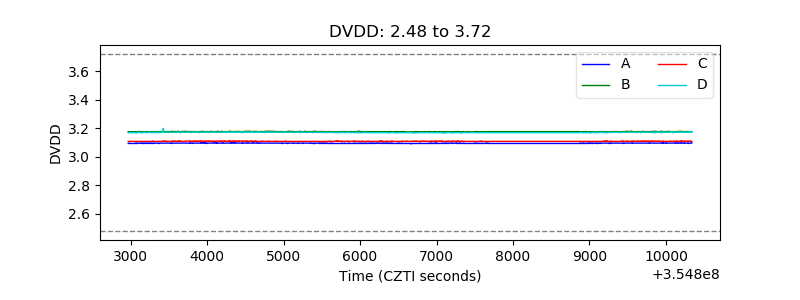 |
| Temperature 1 | 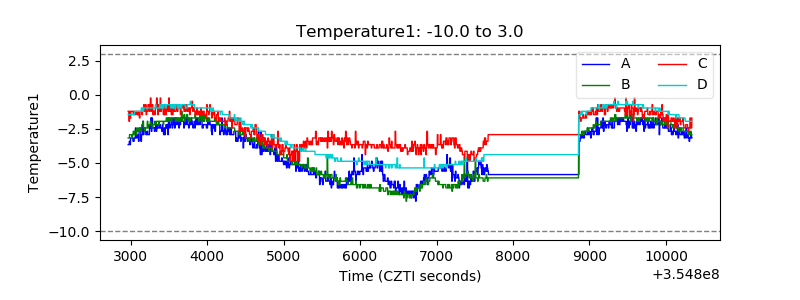 |
| Veto HV Monitor | 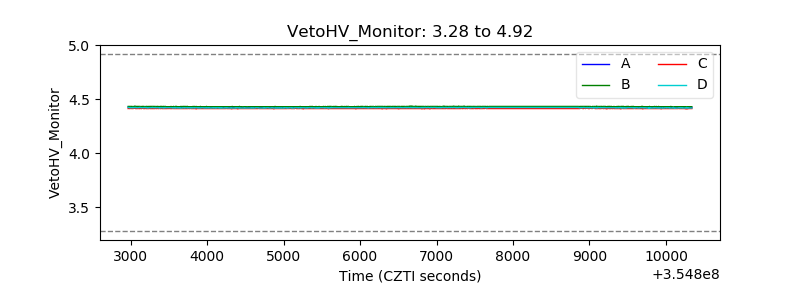 |
| Veto LLD | 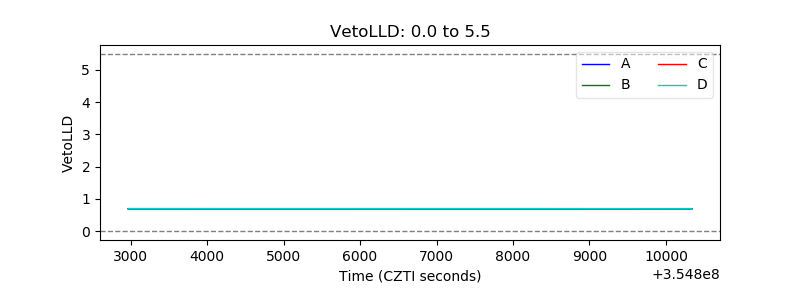 |
| Alpha Counter | 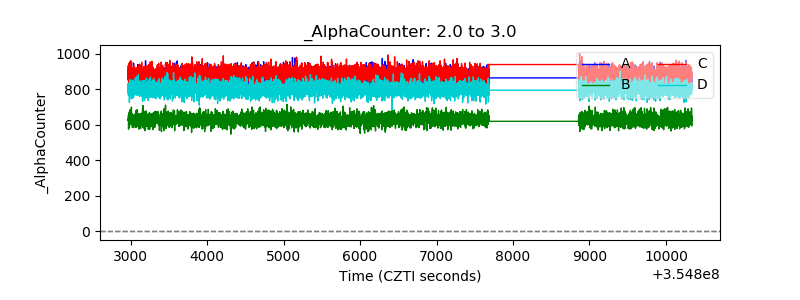 |
| _CPM_Rate | 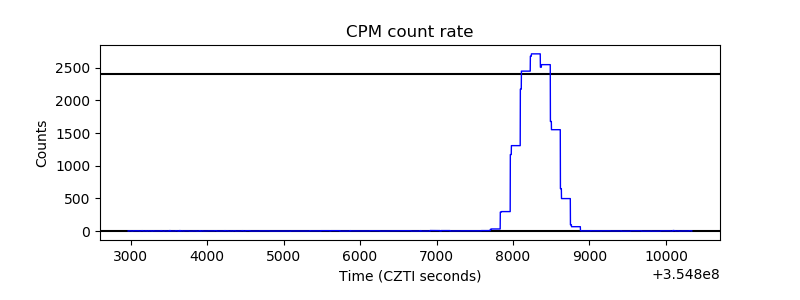 |
| CZT Counter | 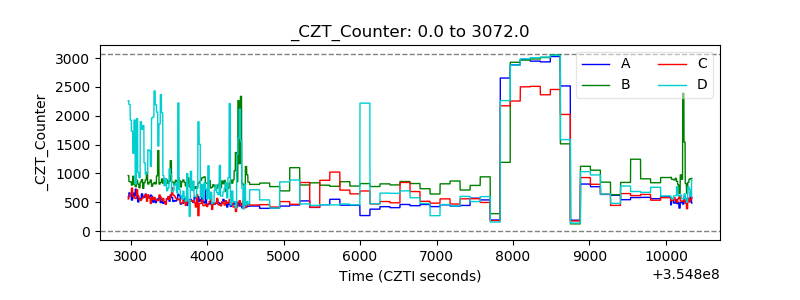 |
| +2.5 Volts monitor |  |
| +5 Volts monitor | 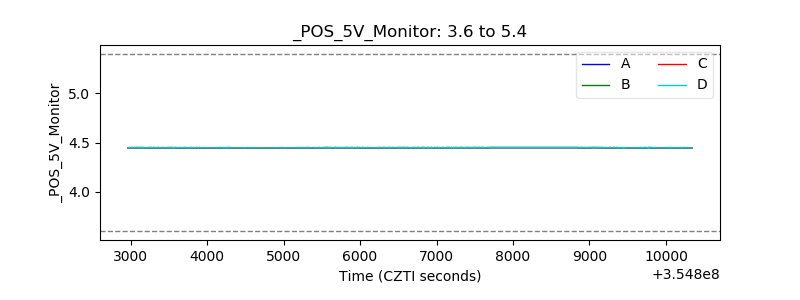 |
| _ROLL_ROT |  |
| _Roll_DEC | 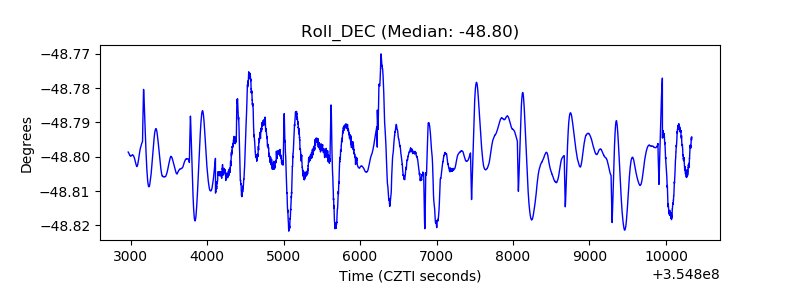 |
| _Roll_RA |  |
| Veto Counter |  |