| Param | Original file | Final file |
|---|---|---|
| Filename | modeM0/AS1T03_291T01_9000004278_29759cztM0_level2.evt | modeM0/AS1T03_291T01_9000004278_29759cztM0_level2_quad_clean.evt |
| Size (bytes) | 541,080,000 | 72,400,320 |
| Size | 516.0 MB | 69.0 MB |
| Events in quadrant A | 3,204,716 | 462,025 |
| Events in quadrant B | 5,317,793 | 457,483 |
| Events in quadrant C | 3,328,258 | 431,938 |
| Events in quadrant D | 4,133,245 | 425,258 |
| Mode SS | |||
|---|---|---|---|
| Quadrant | BADHDUFLAG | Total packets | Discarded packets |
| A | 0 | 120 | 0 |
| B | 0 | 120 | 0 |
| C | 0 | 120 | 0 |
| D | 0 | 120 | 0 |
| Mode M0 | |||
|---|---|---|---|
| Quadrant | BADHDUFLAG | Total packets | Discarded packets |
| A | 0 | 13261 | 1 |
| B | 0 | 19716 | 1 |
| C | 0 | 13591 | 1 |
| D | 0 | 16403 | 2 |
| Mode M9 | |||
|---|---|---|---|
| Quadrant | BADHDUFLAG | Total packets | Discarded packets |
| A | 0 | 13 | 0 |
| B | 0 | 13 | 0 |
| C | 0 | 13 | 0 |
| D | 0 | 13 | 0 |
| Quadrant | Total seconds | Saturated seconds | Saturation percentage |
|---|---|---|---|
| A | 5951 | 88 | 1.478743% |
| B | 5952 | 251 | 4.217070% |
| C | 5952 | 131 | 2.200941% |
| D | 5951 | 160 | 2.688624% |
Noise dominated data is calculated using 1-second bins in cleaned event files. If a bin has >2000 counts, and if more than 50% of those come from <1% of pixels, then it is considered to be noise-dominated and hence unusable.
| Quadrant | # 1 sec bins | Bins with >0 counts | Bins with >2000 counts | High rate bins dominated by noise | Noise dominated (total time) | Noise dominated (detector-on time) | Marked lightcurve |
|---|---|---|---|---|---|---|---|
| A | 7196 | 5951 | 0 | 0 | 0.00% | 0.00% | 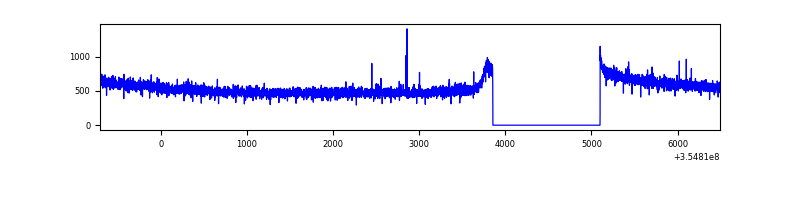 |
| B | 7197 | 5952 | 53 | 53 | 0.74% | 0.89% | 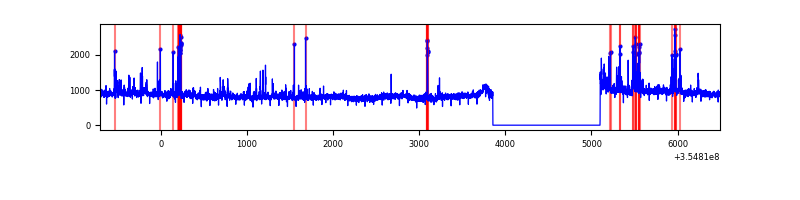 |
| C | 7197 | 5952 | 1 | 1 | 0.01% | 0.02% | 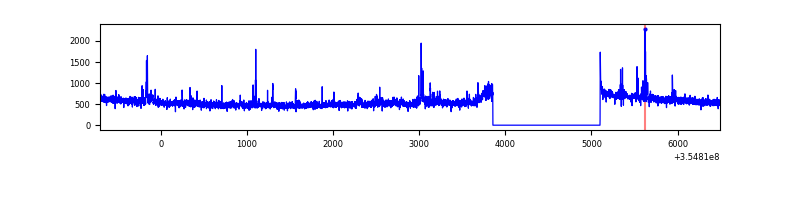 |
| D | 7196 | 5951 | 87 | 87 | 1.21% | 1.46% | 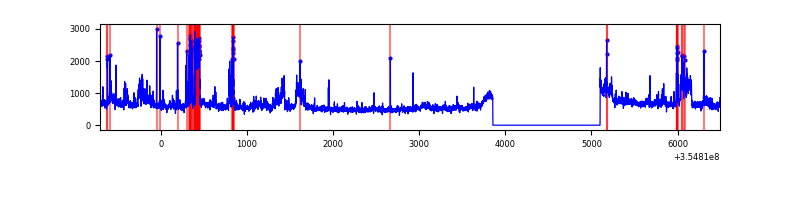 |
Top three noisy pixels from each quadrant. If the there are fewer than three noisy pixels in the level2.evt file, extra rows are filled as -1
| Pixel properties | Quadrant properties | ||||||
|---|---|---|---|---|---|---|---|
| Quadrant | DetID | PixID | Counts | Sigma | Mean | Median | Sigma |
| A | 13 | 254 | 12241 | 69.86 | 830 | 817 | 163.5 |
| A | 3 | 137 | 7302 | 39.66 | 830 | 817 | 163.5 |
| A | 0 | 226 | 6996 | 37.79 | 830 | 817 | 163.5 |
| B | 6 | 159 | 1789601 | 11763.89 | 815 | 798 | 152.1 |
| B | 0 | 229 | 282426 | 1852.1 | 815 | 798 | 152.1 |
| B | 0 | 156 | 23823 | 151.42 | 815 | 798 | 152.1 |
| C | 14 | 238 | 128050 | 720.97 | 776 | 783 | 176.5 |
| C | 3 | 233 | 82589 | 463.43 | 776 | 783 | 176.5 |
| C | 7 | 247 | 72586 | 406.76 | 776 | 783 | 176.5 |
| D | 8 | 195 | 789881 | 4328.69 | 783 | 763 | 182.3 |
| D | 7 | 80 | 211199 | 1154.34 | 783 | 763 | 182.3 |
| D | 13 | 153 | 67575 | 366.5 | 783 | 763 | 182.3 |
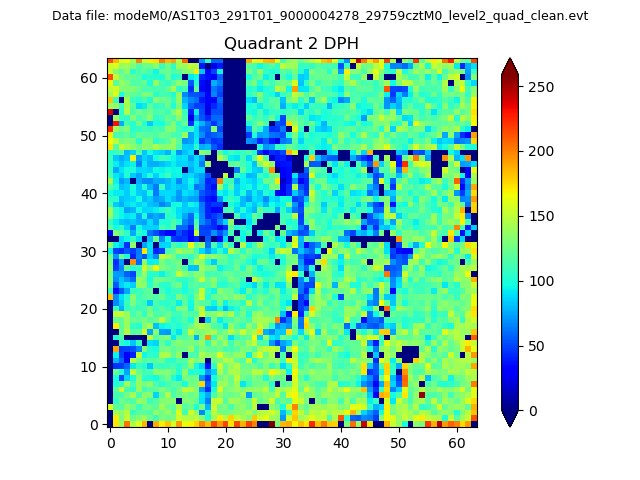
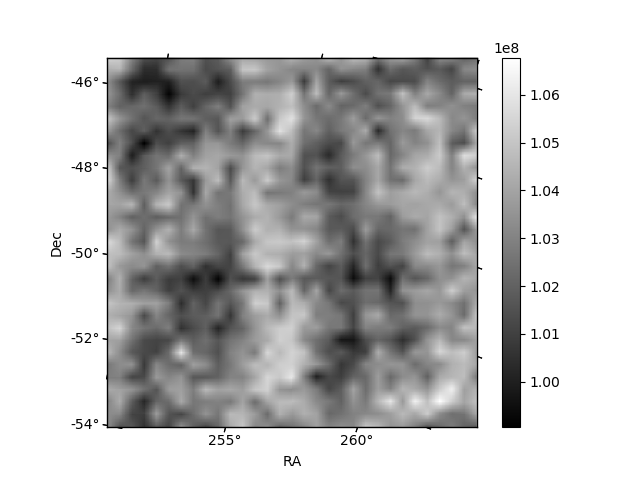
Histogram calculated using DETX and DETY for each event in the final _common_clean file
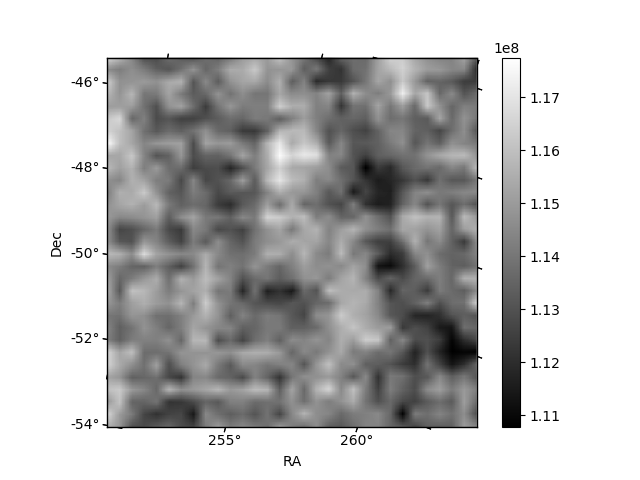
| Quadrant A | 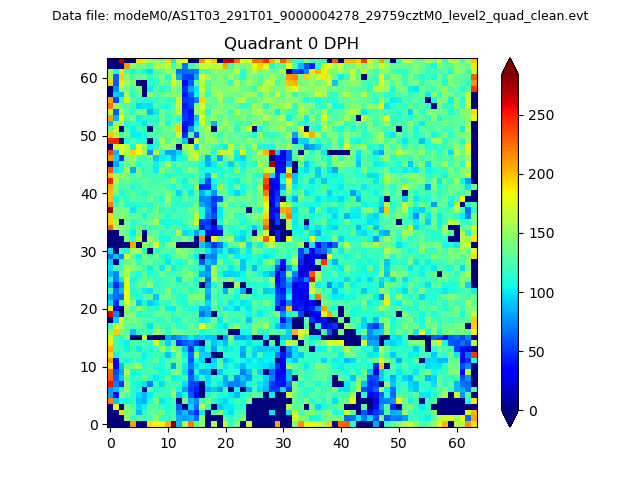 |
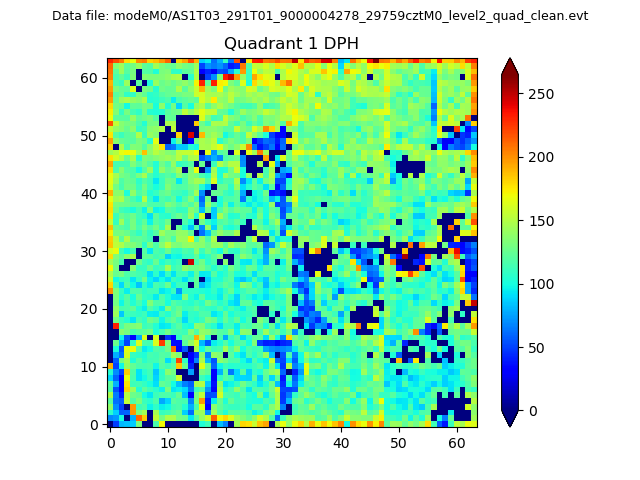 |
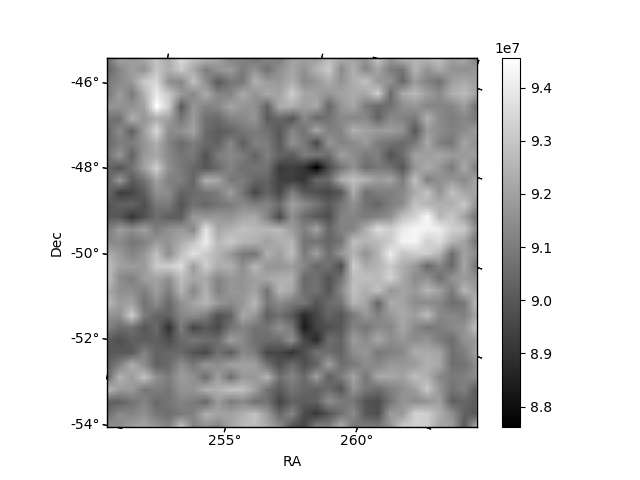
Quadrant B |
|---|---|---|---|
| Quadrant D | 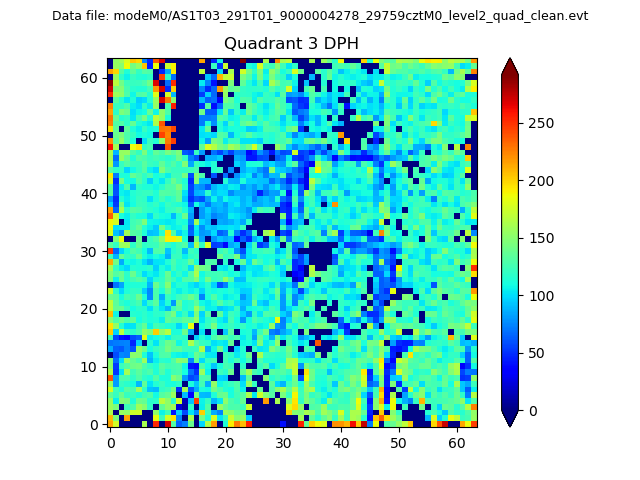 |
 |
Quadrant C |
| Plot type | Count rate plots | Images |
|---|---|---|
| Comparison with Poisson distribution Blue bars denote a histogram of data divided into 1 sec bins. Red curve is a Poisson curve with rate = median count rate of data. |
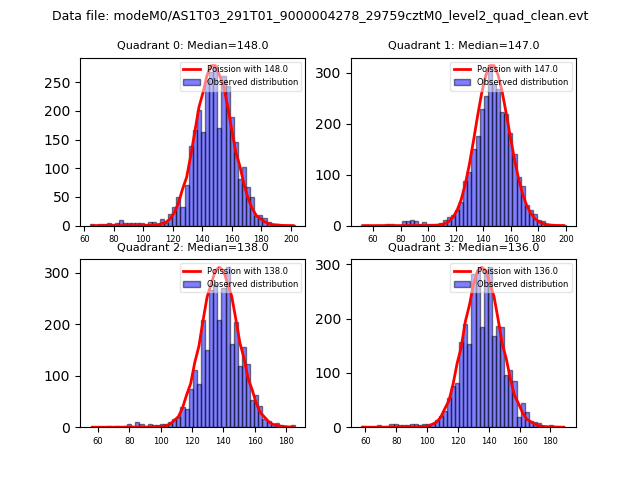 |
 |
| Quadrant-wise count rates Data is divided into 100 sec bins |
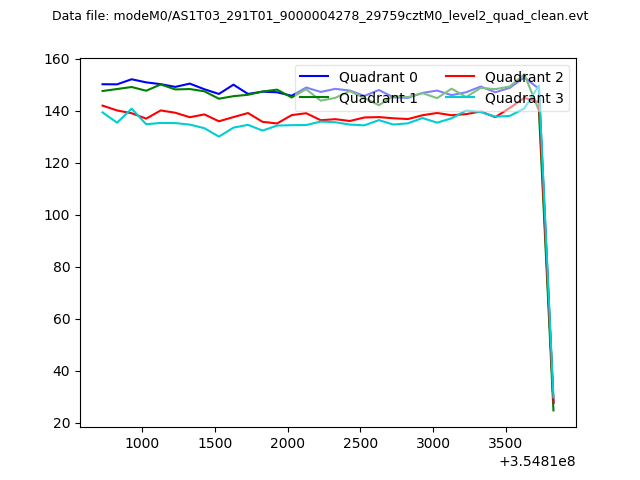 |
|
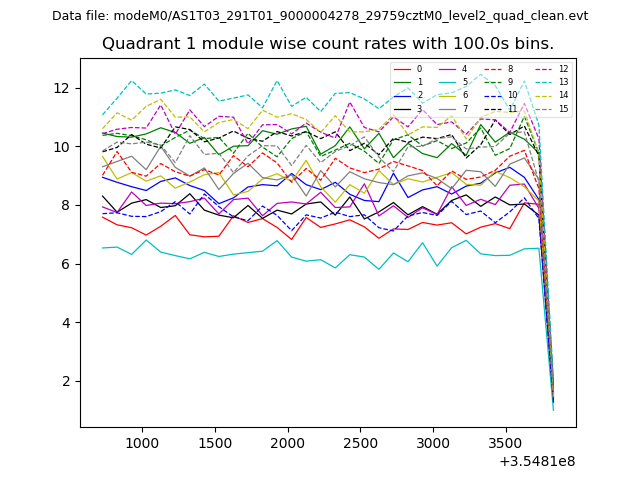
| Module-wise count rates for Quadrant A Data is divided into 100 sec bins |
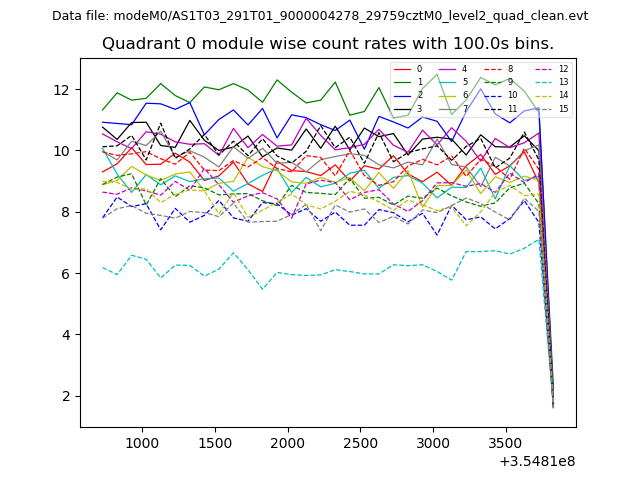 |
 |
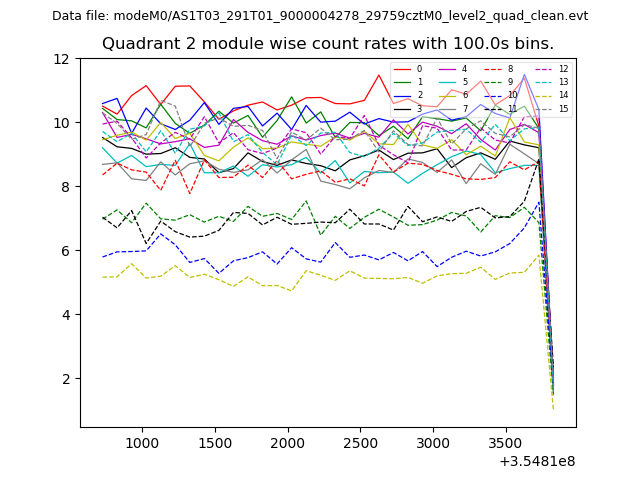
| Module-wise count rates for Quadrant B Data is divided into 100 sec bins |
 |
 |
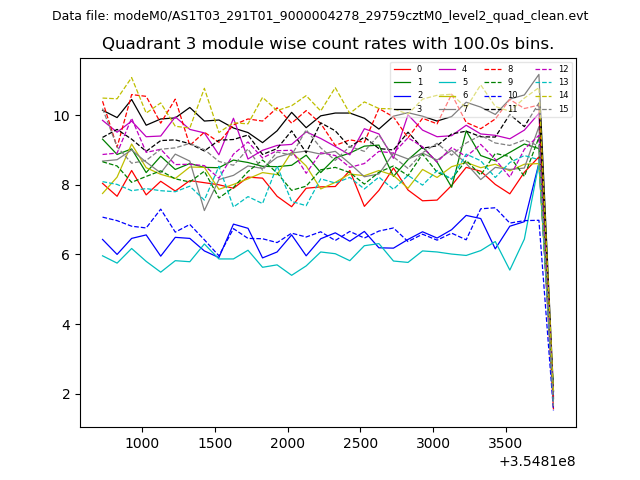
| Module-wise count rates for Quadrant C Data is divided into 100 sec bins |
 |
 |
| Module-wise count rates for Quadrant D Data is divided into 100 sec bins |
 |
 |
| Parameter | Plot |
|---|---|
| CZT HV Monitor | 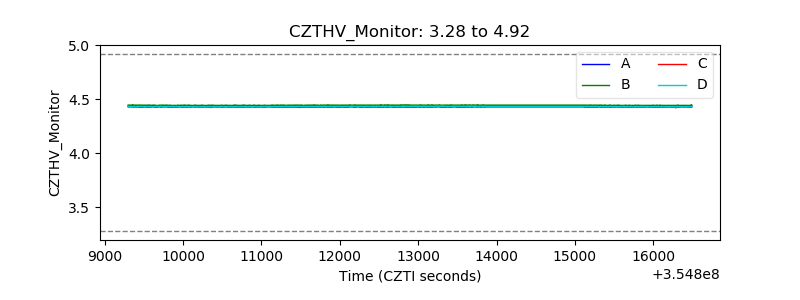 |
| D_VDD | 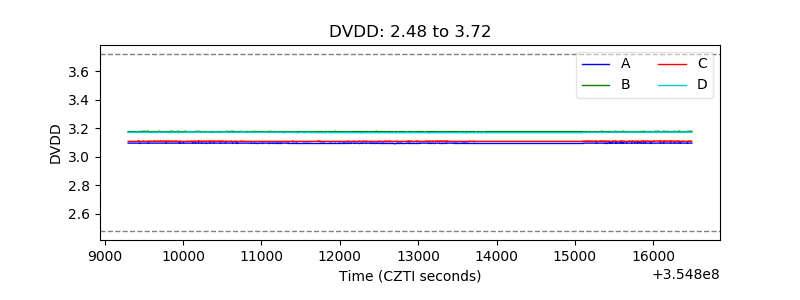 |
| Temperature 1 | 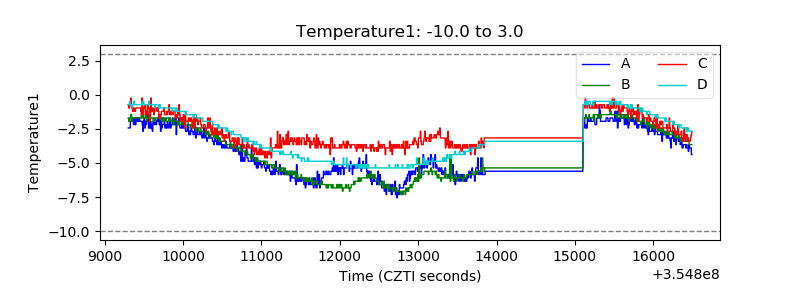 |
| Veto HV Monitor | 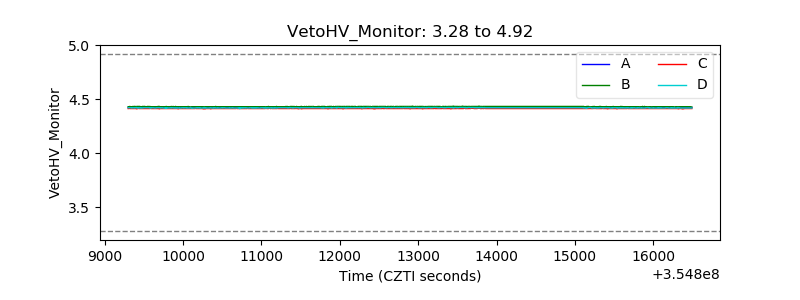 |
| Veto LLD | 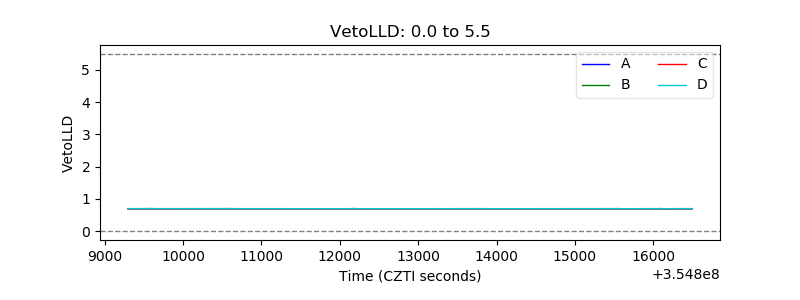 |
| Alpha Counter | 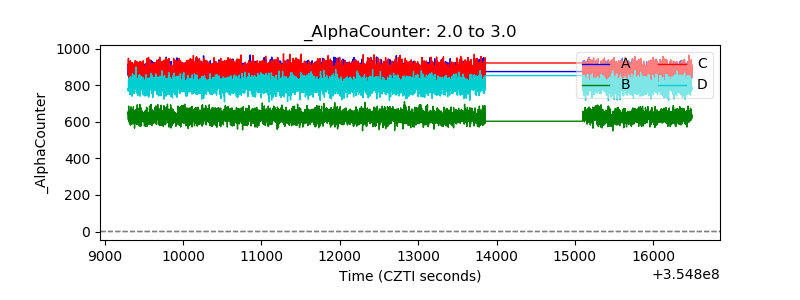 |
| _CPM_Rate | 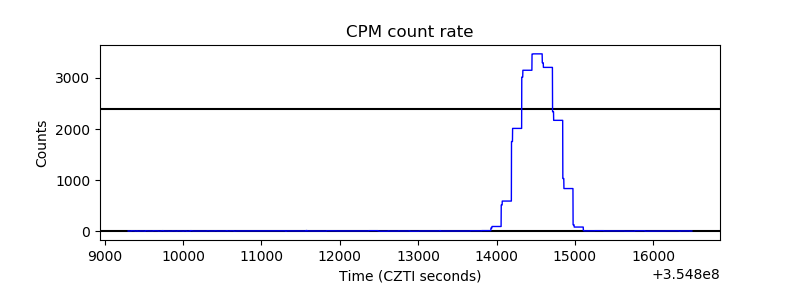 |
| CZT Counter |  |
| +2.5 Volts monitor |  |
| +5 Volts monitor |  |
| _ROLL_ROT | 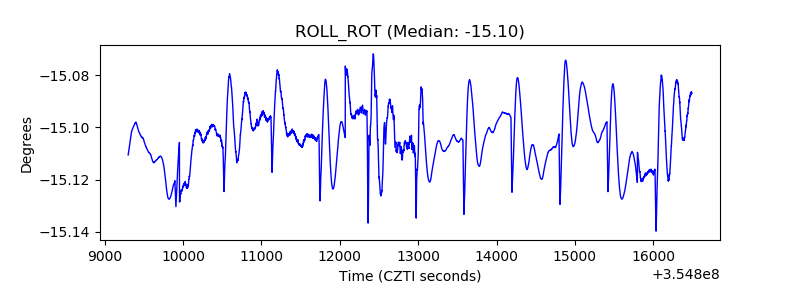 |
| _Roll_DEC | 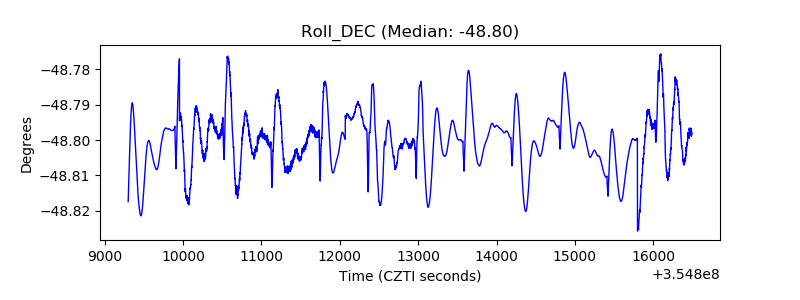 |
| _Roll_RA | 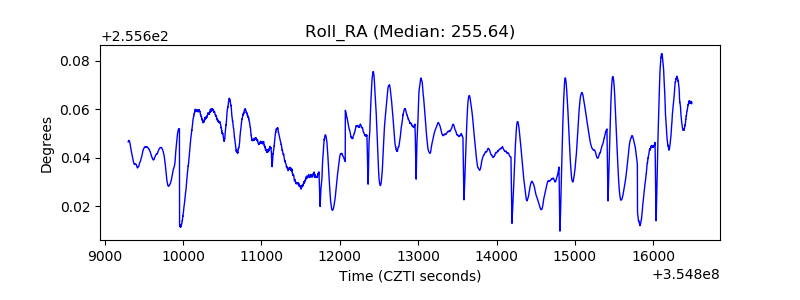 |
| Veto Counter |  |