| Param | Original file | Final file |
|---|---|---|
| Filename | modeM0/AS1T03_291T01_9000004278_29760cztM0_level2.evt | modeM0/AS1T03_291T01_9000004278_29760cztM0_level2_quad_clean.evt |
| Size (bytes) | 571,737,600 | 84,888,000 |
| Size | 545.3 MB | 81.0 MB |
| Events in quadrant A | 3,433,081 | 560,093 |
| Events in quadrant B | 5,688,550 | 554,996 |
| Events in quadrant C | 3,518,345 | 519,018 |
| Events in quadrant D | 4,259,422 | 507,239 |
| Mode SS | |||
|---|---|---|---|
| Quadrant | BADHDUFLAG | Total packets | Discarded packets |
| A | 0 | 124 | 0 |
| B | 0 | 124 | 0 |
| C | 0 | 124 | 0 |
| D | 0 | 124 | 0 |
| Mode M0 | |||
|---|---|---|---|
| Quadrant | BADHDUFLAG | Total packets | Discarded packets |
| A | 0 | 14137 | 2 |
| B | 0 | 21041 | 2 |
| C | 0 | 14295 | 2 |
| D | 0 | 16849 | 2 |
| Mode M9 | |||
|---|---|---|---|
| Quadrant | BADHDUFLAG | Total packets | Discarded packets |
| A | 0 | 19 | 0 |
| B | 0 | 20 | 0 |
| C | 0 | 20 | 0 |
| D | 0 | 20 | 0 |
| Quadrant | Total seconds | Saturated seconds | Saturation percentage |
|---|---|---|---|
| A | 6151 | 82 | 1.333117% |
| B | 6151 | 274 | 4.454560% |
| C | 6151 | 142 | 2.308568% |
| D | 6151 | 141 | 2.292310% |
Noise dominated data is calculated using 1-second bins in cleaned event files. If a bin has >2000 counts, and if more than 50% of those come from <1% of pixels, then it is considered to be noise-dominated and hence unusable.
| Quadrant | # 1 sec bins | Bins with >0 counts | Bins with >2000 counts | High rate bins dominated by noise | Noise dominated (total time) | Noise dominated (detector-on time) | Marked lightcurve |
|---|---|---|---|---|---|---|---|
| A | 7466 | 6151 | 0 | 0 | 0.00% | 0.00% | 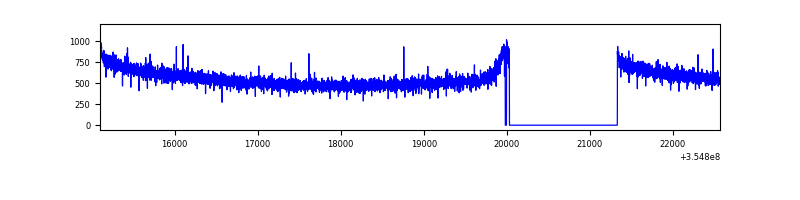 |
| B | 7466 | 6151 | 49 | 49 | 0.66% | 0.80% | 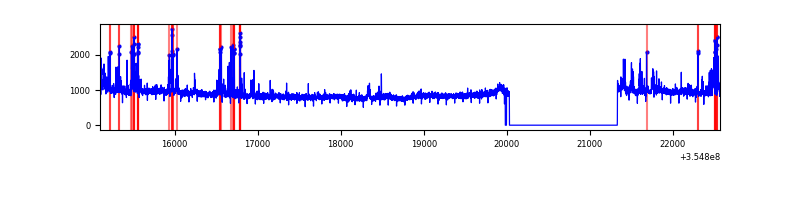 |
| C | 7466 | 6151 | 3 | 3 | 0.04% | 0.05% | 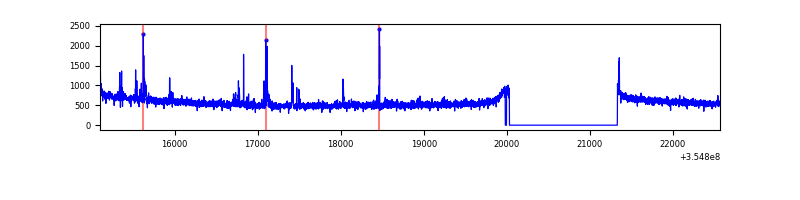 |
| D | 7466 | 6152 | 83 | 83 | 1.11% | 1.35% | 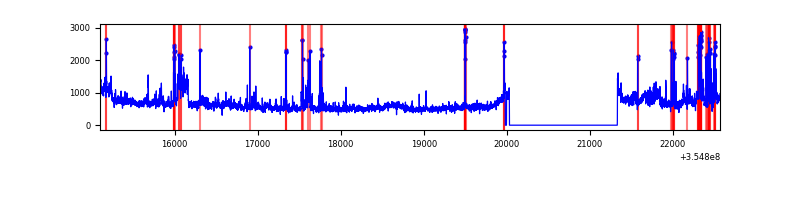 |
Top three noisy pixels from each quadrant. If the there are fewer than three noisy pixels in the level2.evt file, extra rows are filled as -1
| Pixel properties | Quadrant properties | ||||||
|---|---|---|---|---|---|---|---|
| Quadrant | DetID | PixID | Counts | Sigma | Mean | Median | Sigma |
| A | 13 | 254 | 12529 | 66.79 | 889 | 876 | 174.5 |
| A | 3 | 137 | 7686 | 39.03 | 889 | 876 | 174.5 |
| A | 0 | 226 | 7473 | 37.81 | 889 | 876 | 174.5 |
| B | 6 | 159 | 1882625 | 11777.47 | 876 | 858 | 159.8 |
| B | 0 | 229 | 354528 | 2213.53 | 876 | 858 | 159.8 |
| B | 12 | 111 | 18199 | 108.53 | 876 | 858 | 159.8 |
| C | 14 | 238 | 139541 | 736.96 | 827 | 835 | 188.2 |
| C | 3 | 233 | 95768 | 504.39 | 827 | 835 | 188.2 |
| C | 7 | 247 | 28538 | 147.19 | 827 | 835 | 188.2 |
| D | 8 | 195 | 667670 | 3469.06 | 830 | 812 | 192.2 |
| D | 7 | 80 | 81328 | 418.85 | 830 | 812 | 192.2 |
| D | 13 | 104 | 76232 | 392.34 | 830 | 812 | 192.2 |
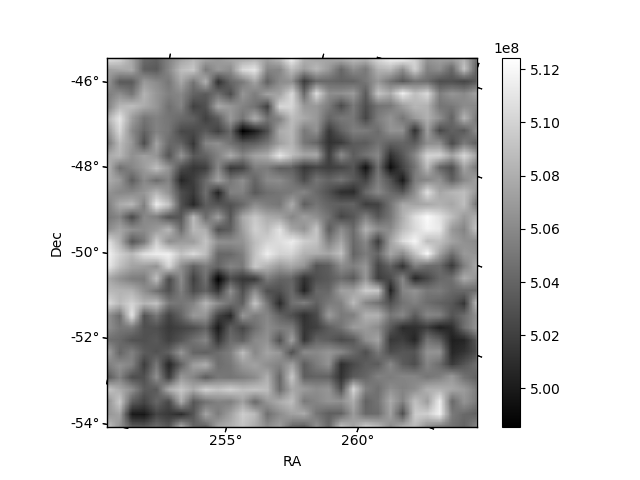
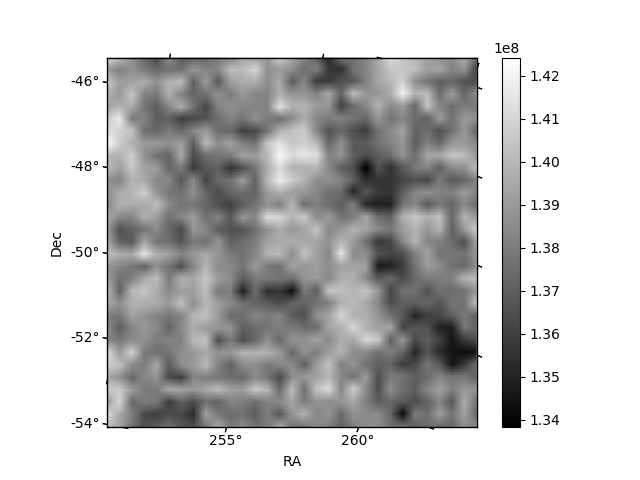
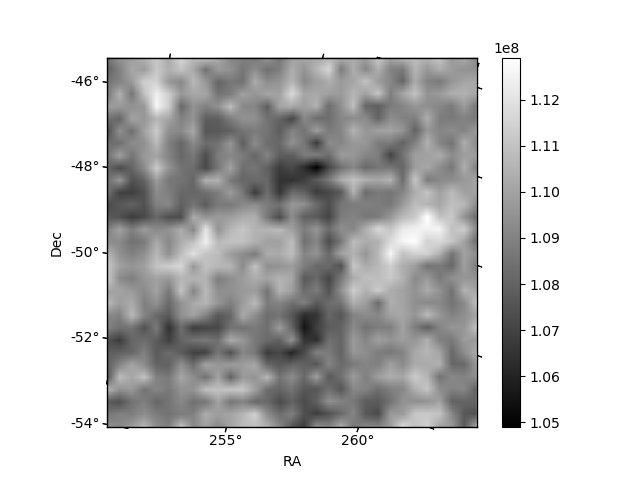
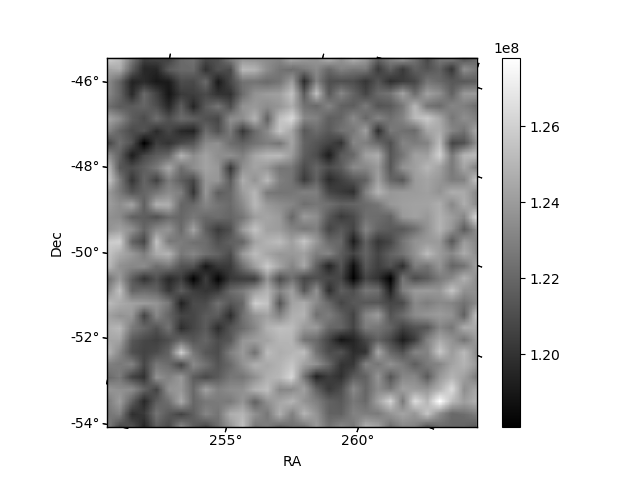
Histogram calculated using DETX and DETY for each event in the final _common_clean file
| Quadrant A | 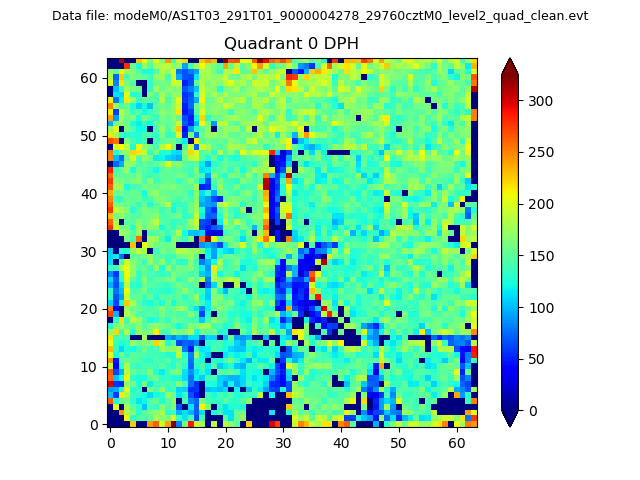 |
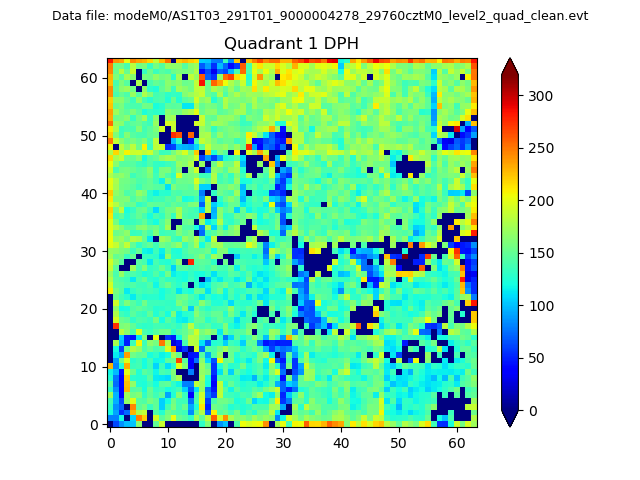 |
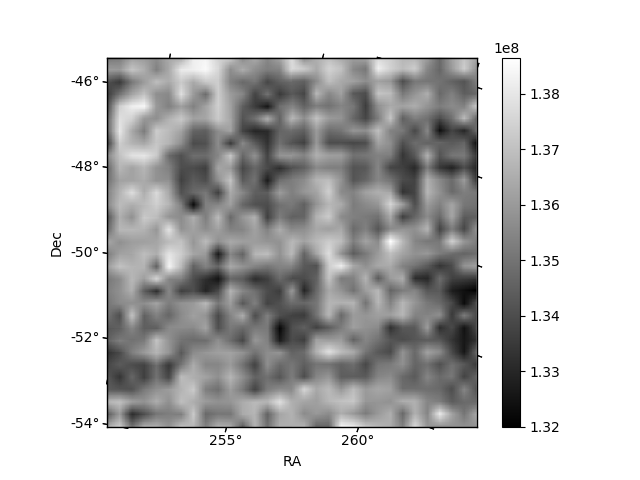
Quadrant B |
|---|---|---|---|
| Quadrant D | 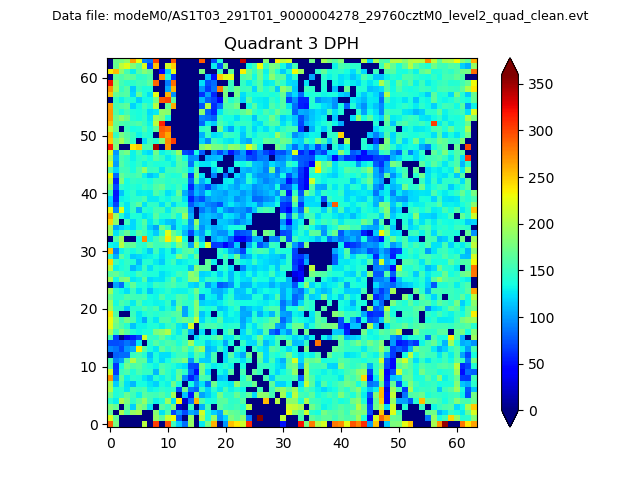 |
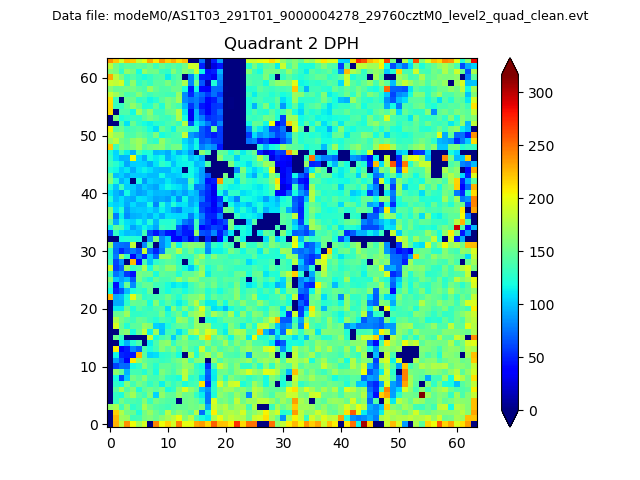 |
Quadrant C |
| Plot type | Count rate plots | Images |
|---|---|---|
| Comparison with Poisson distribution Blue bars denote a histogram of data divided into 1 sec bins. Red curve is a Poisson curve with rate = median count rate of data. |
 |
 |
| Quadrant-wise count rates Data is divided into 100 sec bins |
 |
|
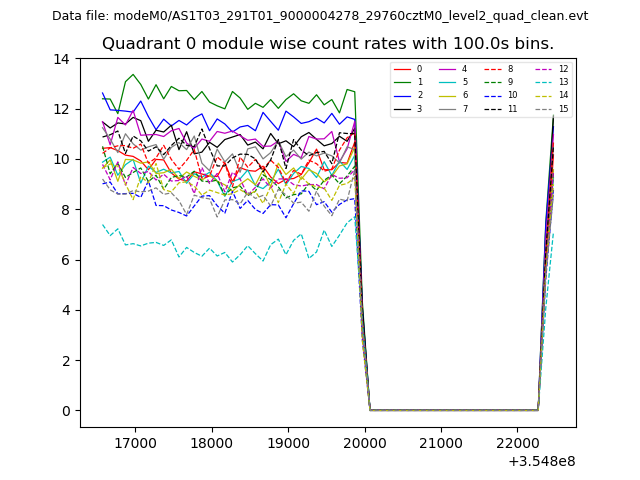
| Module-wise count rates for Quadrant A Data is divided into 100 sec bins |
 |
 |
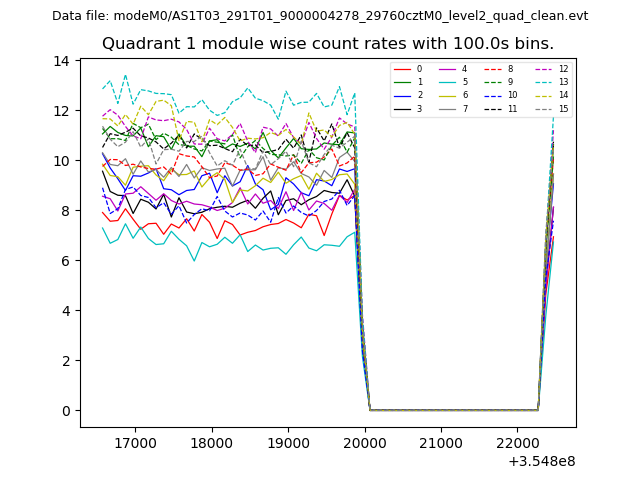
| Module-wise count rates for Quadrant B Data is divided into 100 sec bins |
 |
 |
| Module-wise count rates for Quadrant C Data is divided into 100 sec bins |
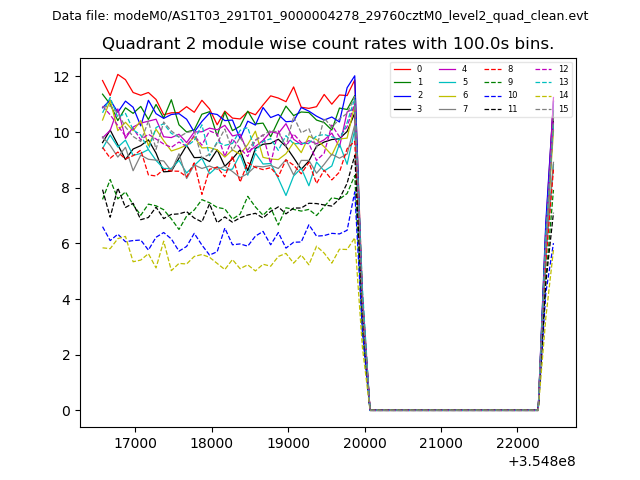 |
 |
| Module-wise count rates for Quadrant D Data is divided into 100 sec bins |
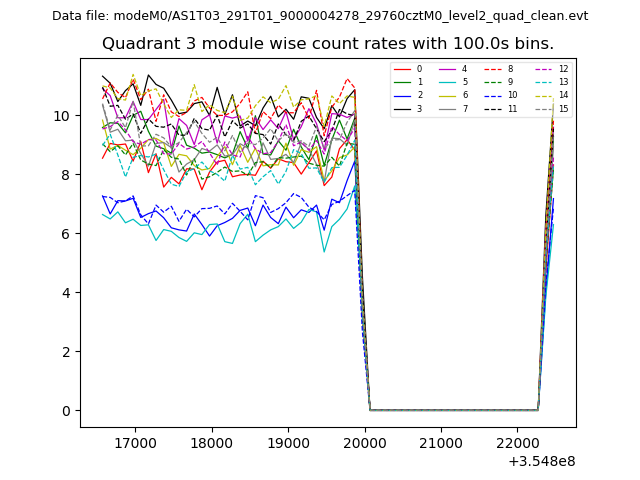 |
 |
| Parameter | Plot |
|---|---|
| CZT HV Monitor | 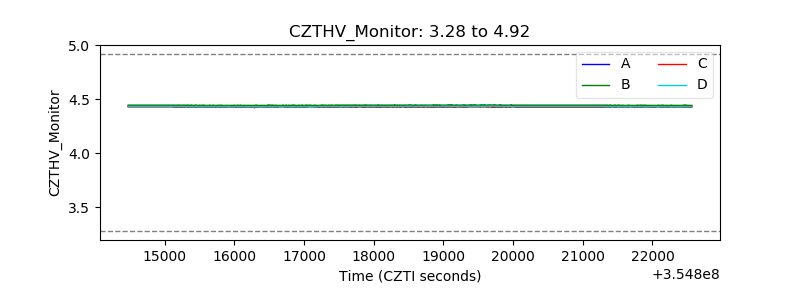 |
| D_VDD | 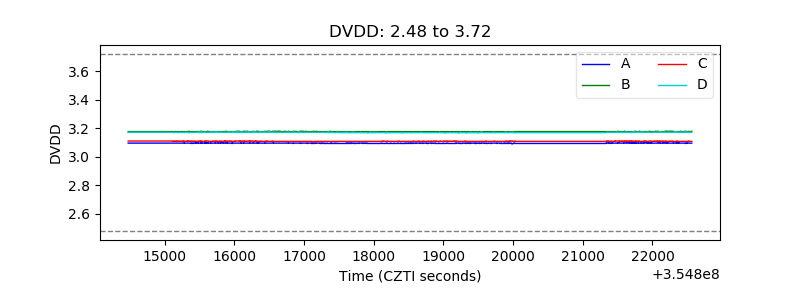 |
| Temperature 1 | 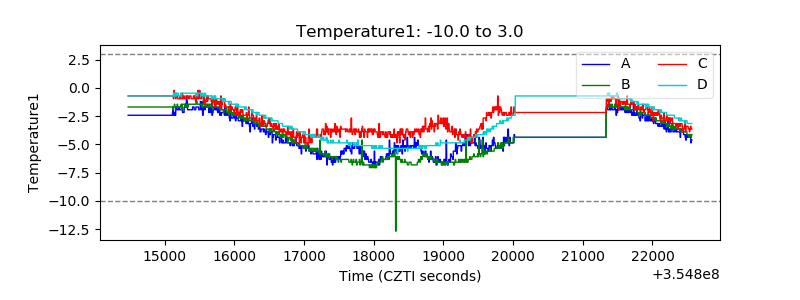 |
| Veto HV Monitor | 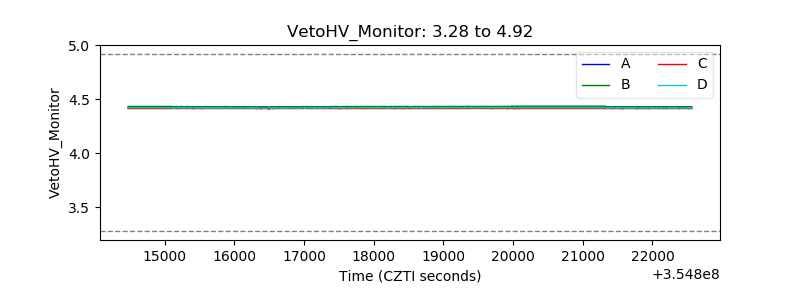 |
| Veto LLD | 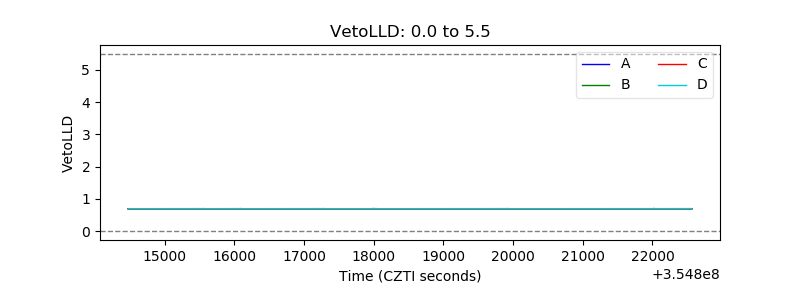 |
| Alpha Counter | 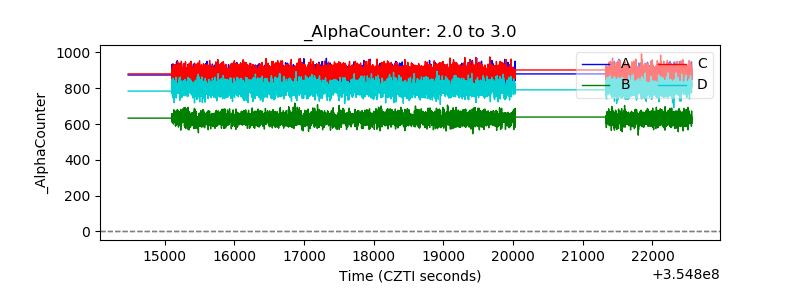 |
| _CPM_Rate |  |
| CZT Counter | 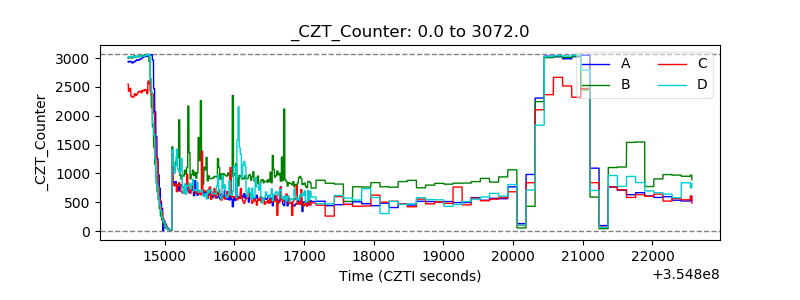 |
| +2.5 Volts monitor |  |
| +5 Volts monitor | 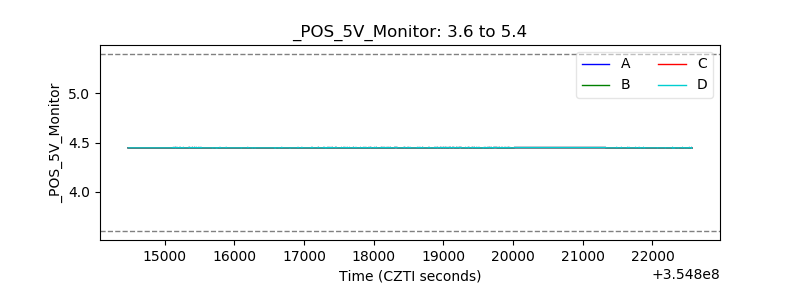 |
| _ROLL_ROT | 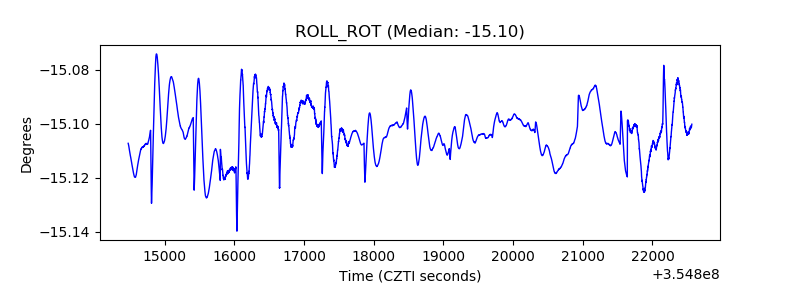 |
| _Roll_DEC | 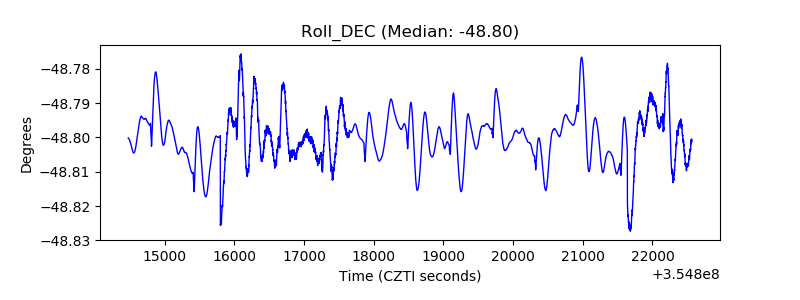 |
| _Roll_RA | 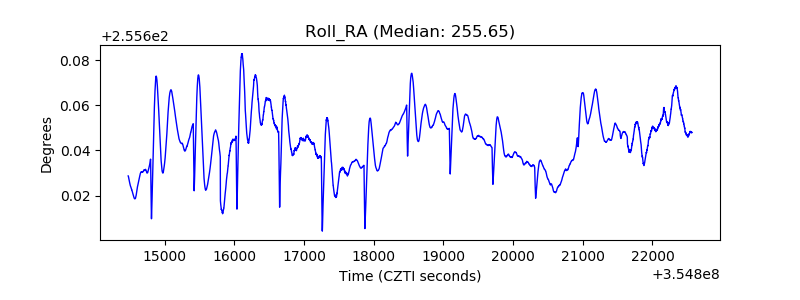 |
| Veto Counter | 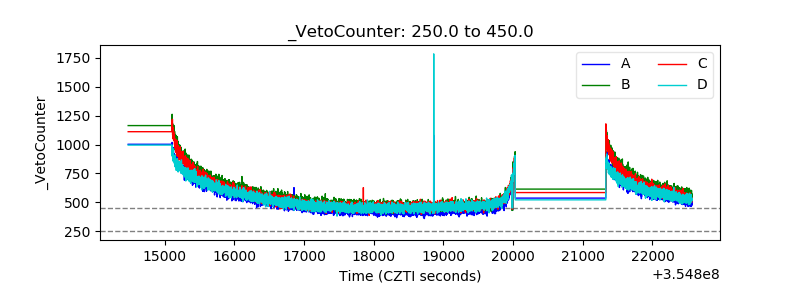 |