| Param | Original file | Final file |
|---|---|---|
| Filename | modeM0/AS1T03_291T01_9000004278_29761cztM0_level2.evt | modeM0/AS1T03_291T01_9000004278_29761cztM0_level2_quad_clean.evt |
| Size (bytes) | 616,043,520 | 102,291,840 |
| Size | 587.5 MB | 97.6 MB |
| Events in quadrant A | 3,406,042 | 700,601 |
| Events in quadrant B | 6,243,370 | 681,125 |
| Events in quadrant C | 3,463,140 | 656,618 |
| Events in quadrant D | 5,119,874 | 621,103 |
| Mode SS | |||
|---|---|---|---|
| Quadrant | BADHDUFLAG | Total packets | Discarded packets |
| A | 0 | 130 | 0 |
| B | 0 | 130 | 0 |
| C | 0 | 130 | 0 |
| D | 0 | 130 | 0 |
| Mode M0 | |||
|---|---|---|---|
| Quadrant | BADHDUFLAG | Total packets | Discarded packets |
| A | 0 | 14015 | 2 |
| B | 0 | 22613 | 2 |
| C | 0 | 14037 | 2 |
| D | 0 | 19526 | 2 |
| Mode M9 | |||
|---|---|---|---|
| Quadrant | BADHDUFLAG | Total packets | Discarded packets |
| A | 0 | 17 | 0 |
| B | 0 | 18 | 0 |
| C | 0 | 18 | 0 |
| D | 0 | 18 | 0 |
| Quadrant | Total seconds | Saturated seconds | Saturation percentage |
|---|---|---|---|
| A | 6273 | 105 | 1.673840% |
| B | 6273 | 536 | 8.544556% |
| C | 6273 | 165 | 2.630320% |
| D | 6272 | 341 | 5.436862% |
Noise dominated data is calculated using 1-second bins in cleaned event files. If a bin has >2000 counts, and if more than 50% of those come from <1% of pixels, then it is considered to be noise-dominated and hence unusable.
| Quadrant | # 1 sec bins | Bins with >0 counts | Bins with >2000 counts | High rate bins dominated by noise | Noise dominated (total time) | Noise dominated (detector-on time) | Marked lightcurve |
|---|---|---|---|---|---|---|---|
| A | 7558 | 6273 | 0 | 0 | 0.00% | 0.00% | 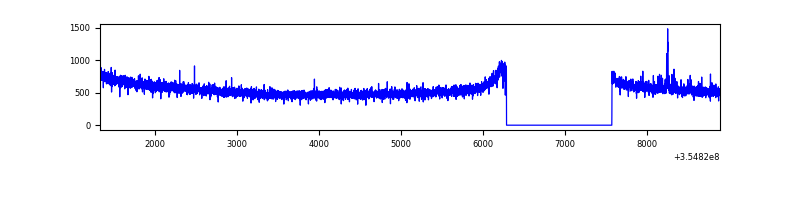 |
| B | 7558 | 6273 | 274 | 274 | 3.63% | 4.37% | 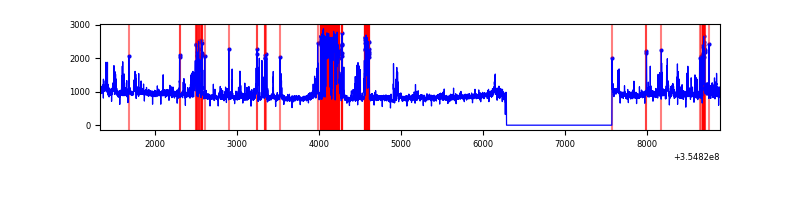 |
| C | 7558 | 6273 | 1 | 1 | 0.01% | 0.02% | 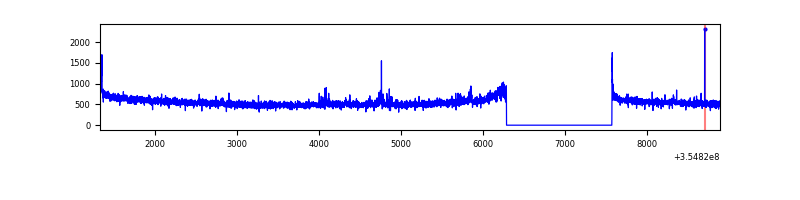 |
| D | 7557 | 6272 | 278 | 278 | 3.68% | 4.43% | 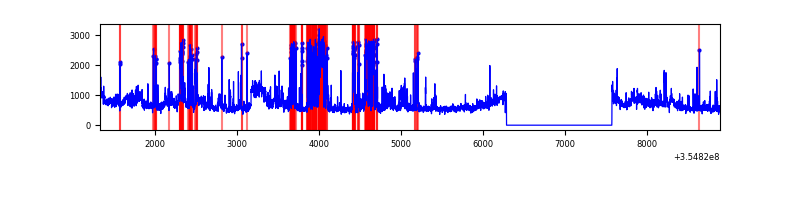 |
Top three noisy pixels from each quadrant. If the there are fewer than three noisy pixels in the level2.evt file, extra rows are filled as -1
| Pixel properties | Quadrant properties | ||||||
|---|---|---|---|---|---|---|---|
| Quadrant | DetID | PixID | Counts | Sigma | Mean | Median | Sigma |
| A | 12 | 16 | 12879 | 70.18 | 879 | 864 | 171.2 |
| A | 13 | 254 | 12652 | 68.85 | 879 | 864 | 171.2 |
| A | 3 | 137 | 7870 | 40.92 | 879 | 864 | 171.2 |
| B | 6 | 159 | 1889249 | 11950.85 | 857 | 840 | 158.0 |
| B | 0 | 229 | 899755 | 5688.81 | 857 | 840 | 158.0 |
| B | 5 | 255 | 71516 | 447.28 | 857 | 840 | 158.0 |
| C | 14 | 238 | 141458 | 745.58 | 825 | 832 | 188.6 |
| C | 7 | 247 | 62201 | 325.37 | 825 | 832 | 188.6 |
| C | 3 | 233 | 22086 | 112.69 | 825 | 832 | 188.6 |
| D | 7 | 80 | 814433 | 4233.24 | 817 | 794 | 192.2 |
| D | 8 | 195 | 704547 | 3661.52 | 817 | 794 | 192.2 |
| D | 7 | 223 | 198880 | 1030.61 | 817 | 794 | 192.2 |
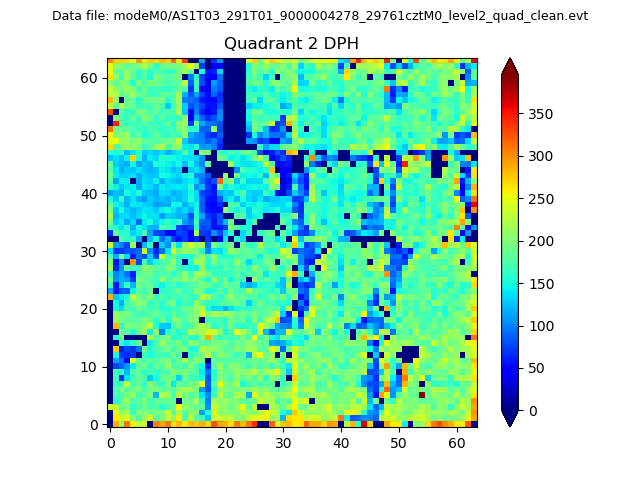
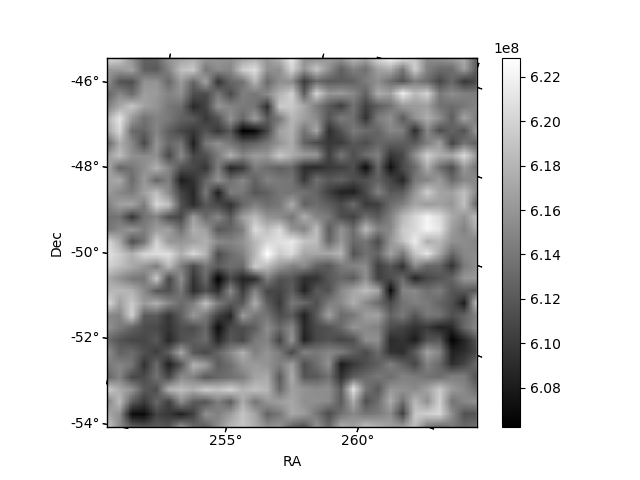
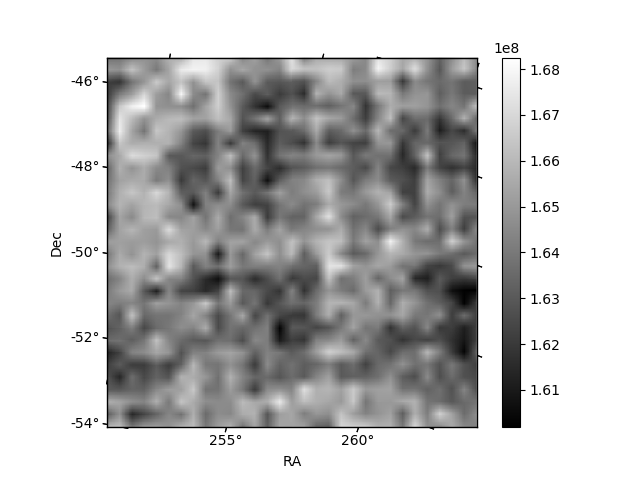
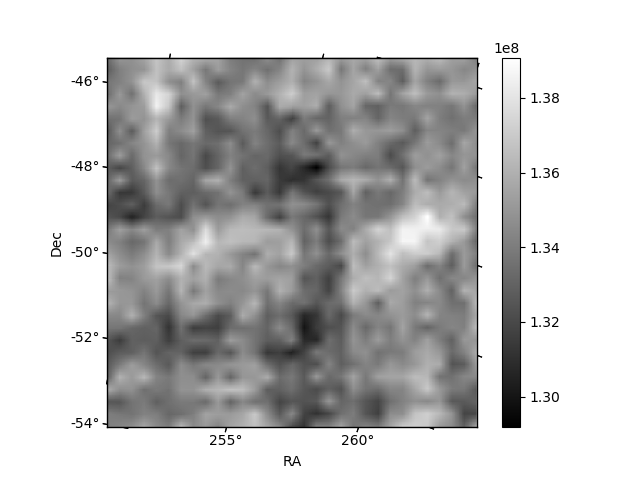
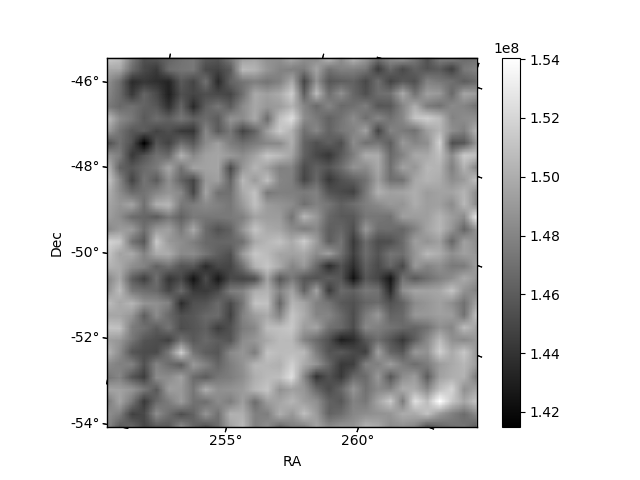
Histogram calculated using DETX and DETY for each event in the final _common_clean file
| Quadrant A | 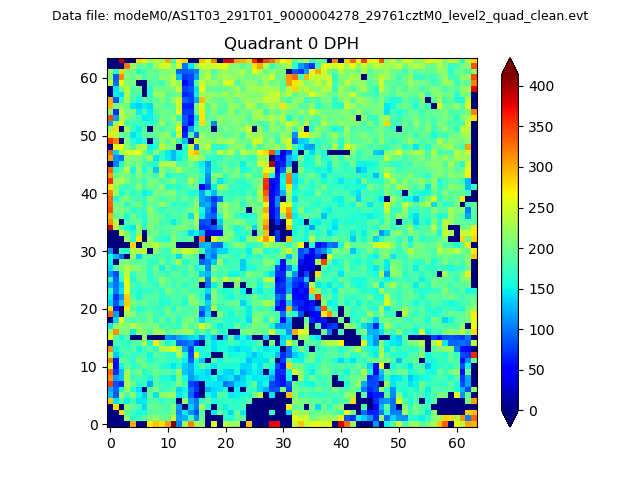 |
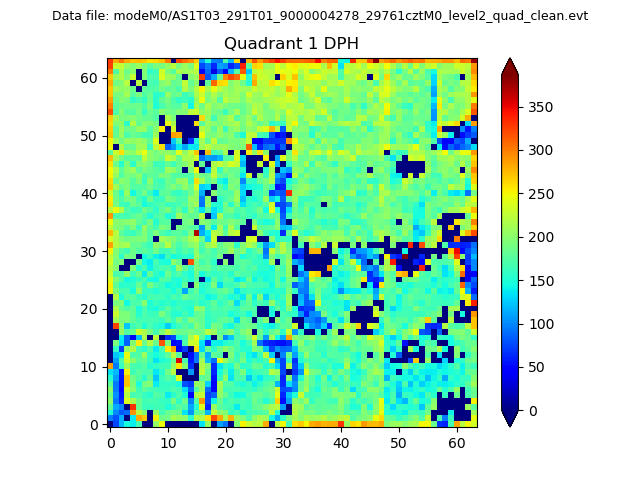 |
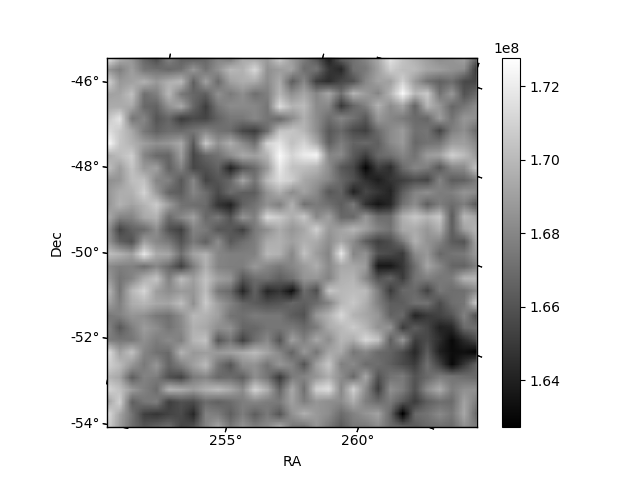
Quadrant B |
|---|---|---|---|
| Quadrant D | 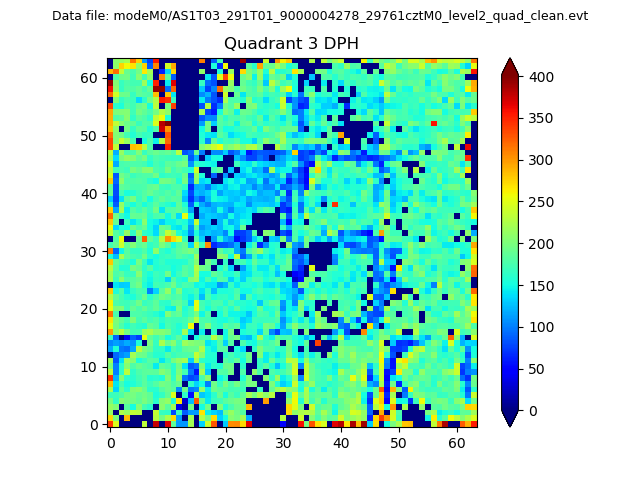 |
 |
Quadrant C |
| Plot type | Count rate plots | Images |
|---|---|---|
| Comparison with Poisson distribution Blue bars denote a histogram of data divided into 1 sec bins. Red curve is a Poisson curve with rate = median count rate of data. |
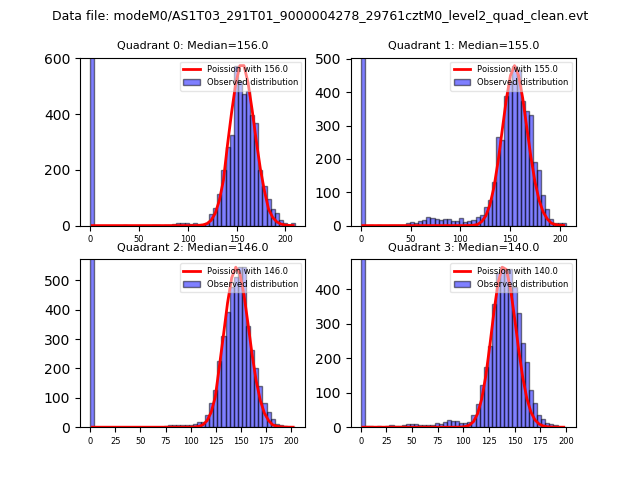 |
 |
| Quadrant-wise count rates Data is divided into 100 sec bins |
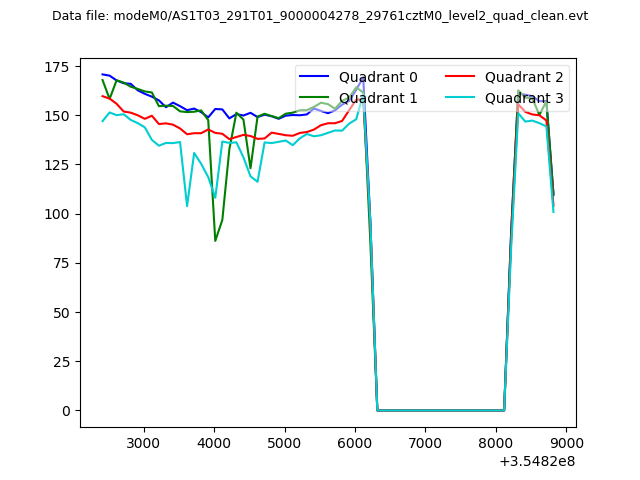 |
|
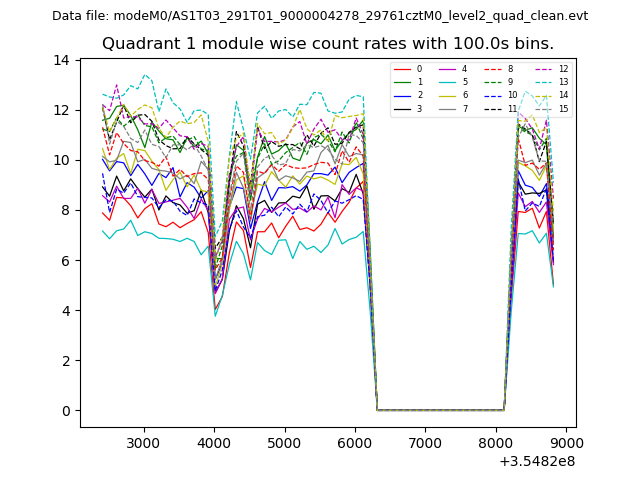
| Module-wise count rates for Quadrant A Data is divided into 100 sec bins |
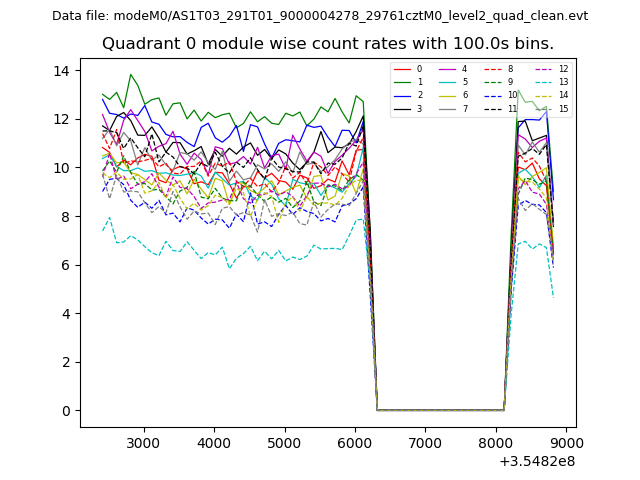 |
 |
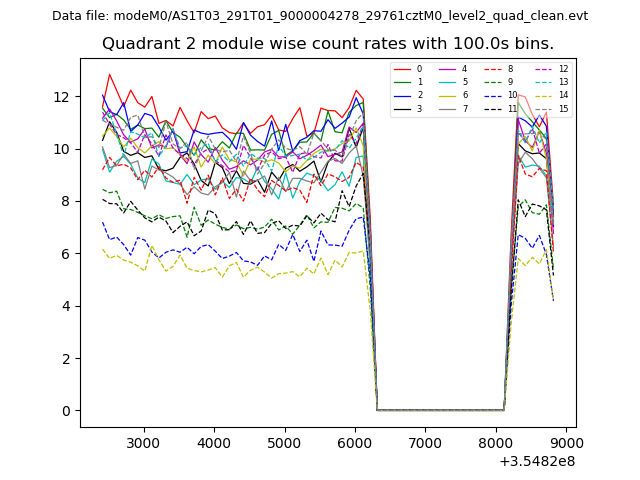
| Module-wise count rates for Quadrant B Data is divided into 100 sec bins |
 |
 |
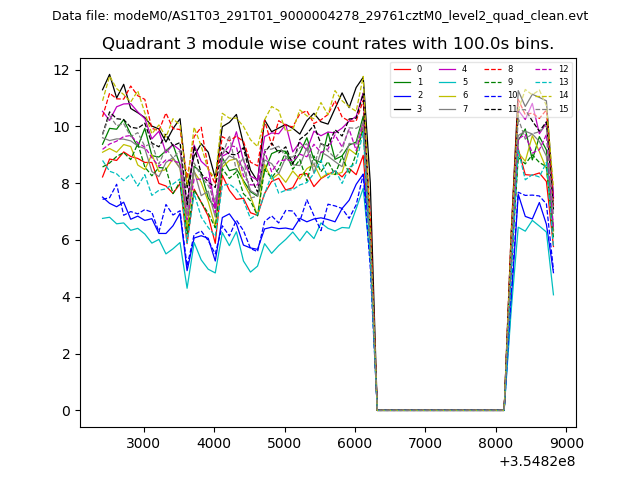
| Module-wise count rates for Quadrant C Data is divided into 100 sec bins |
 |
 |
| Module-wise count rates for Quadrant D Data is divided into 100 sec bins |
 |
 |
| Parameter | Plot |
|---|---|
| CZT HV Monitor | 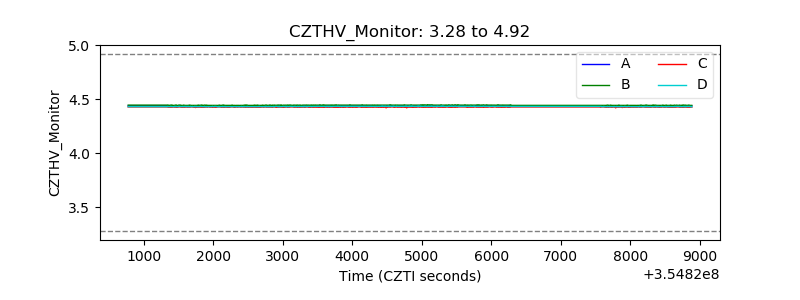 |
| D_VDD | 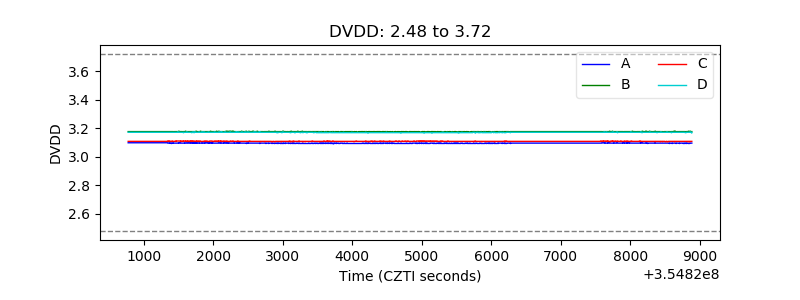 |
| Temperature 1 | 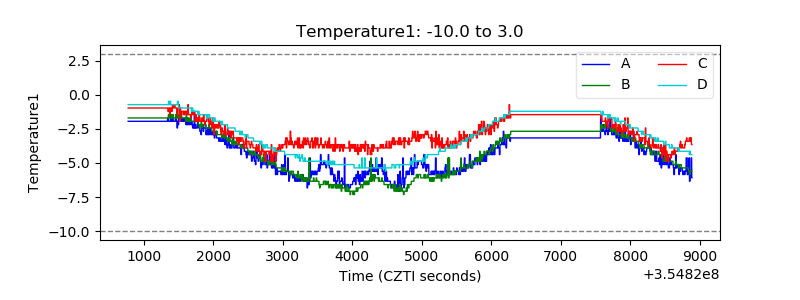 |
| Veto HV Monitor | 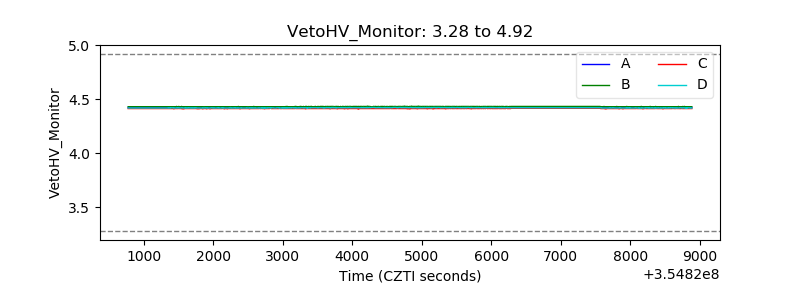 |
| Veto LLD | 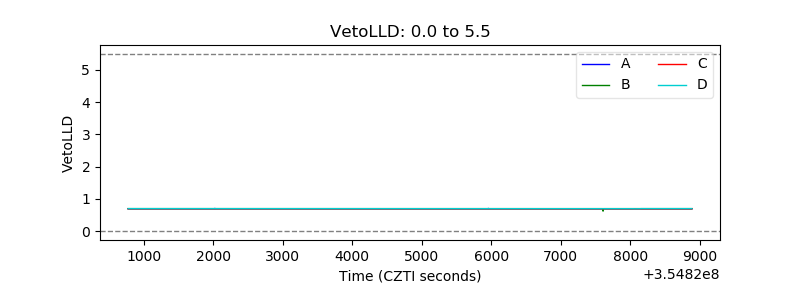 |
| Alpha Counter | 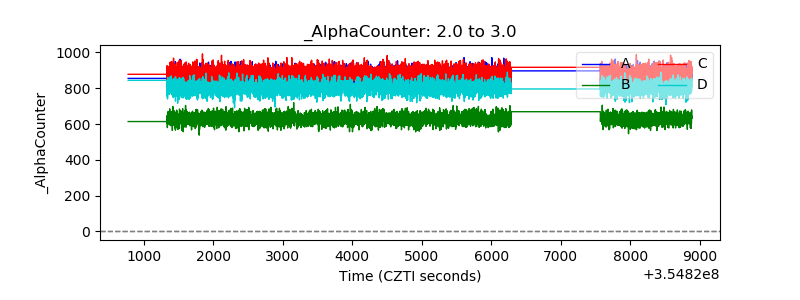 |
| _CPM_Rate | 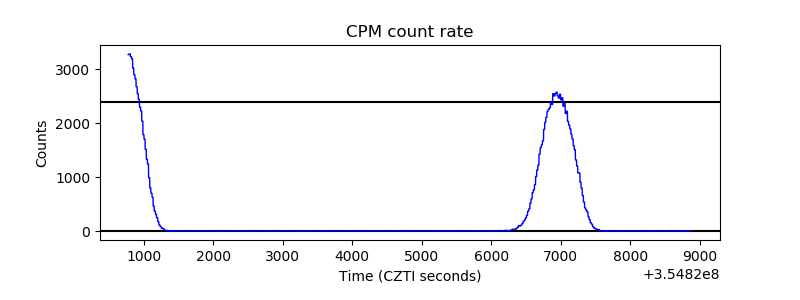 |
| CZT Counter | 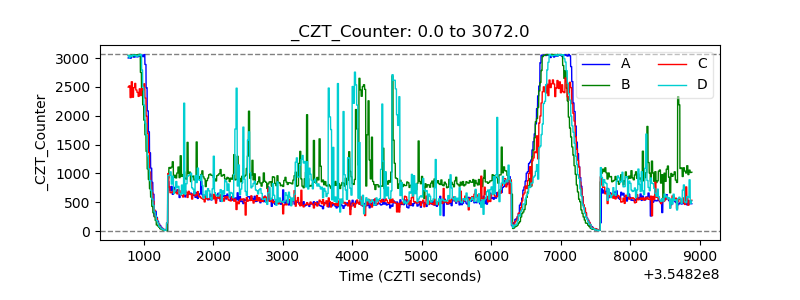 |
| +2.5 Volts monitor |  |
| +5 Volts monitor | 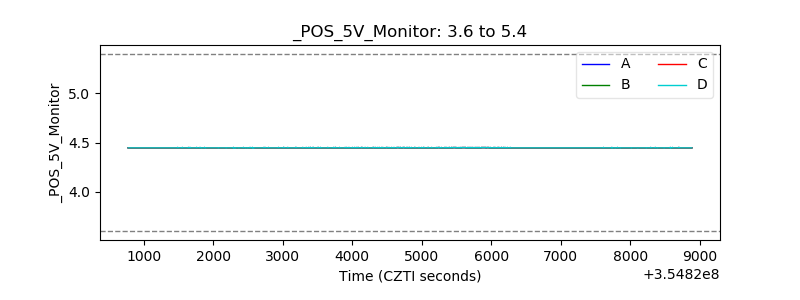 |
| _ROLL_ROT | 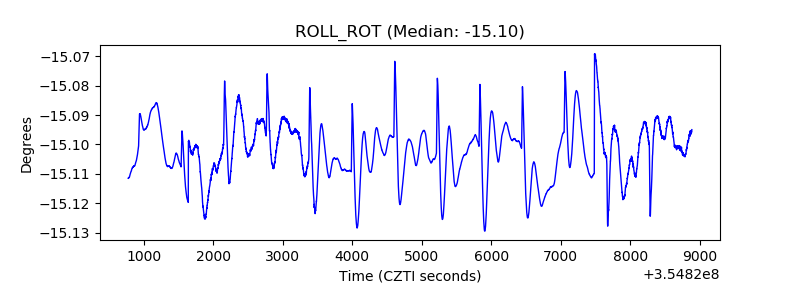 |
| _Roll_DEC | 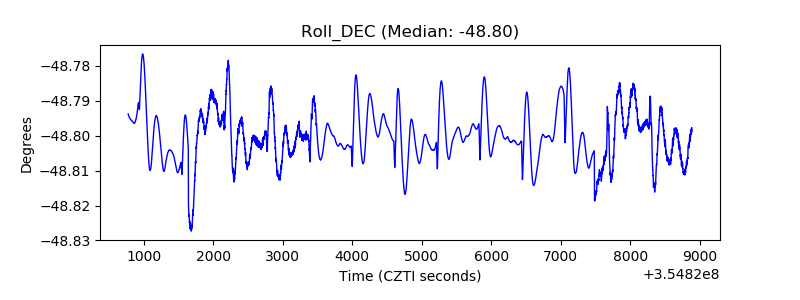 |
| _Roll_RA | 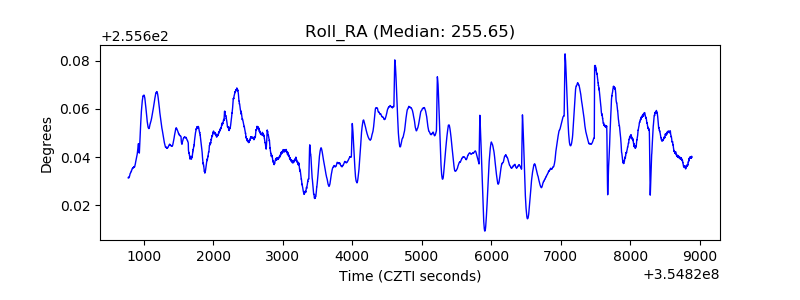 |
| Veto Counter | 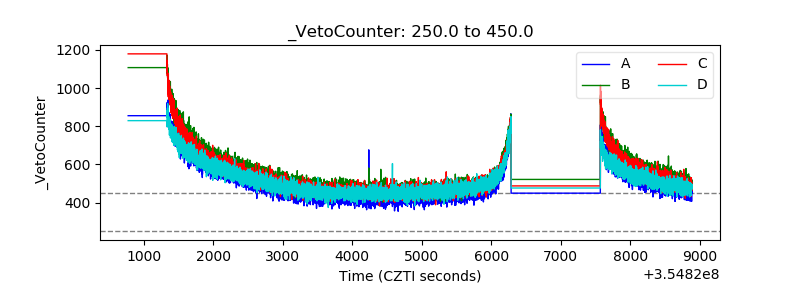 |