| Param | Original file | Final file |
|---|---|---|
| Filename | modeM0/AS1T03_291T01_9000004278_29763cztM0_level2.evt | modeM0/AS1T03_291T01_9000004278_29763cztM0_level2_quad_clean.evt |
| Size (bytes) | 575,971,200 | 111,588,480 |
| Size | 549.3 MB | 106.4 MB |
| Events in quadrant A | 3,274,873 | 750,843 |
| Events in quadrant B | 6,189,473 | 748,032 |
| Events in quadrant C | 3,362,267 | 718,716 |
| Events in quadrant D | 4,161,424 | 692,887 |
| Mode SS | |||
|---|---|---|---|
| Quadrant | BADHDUFLAG | Total packets | Discarded packets |
| A | 0 | 136 | 0 |
| B | 0 | 136 | 0 |
| C | 0 | 136 | 0 |
| D | 0 | 136 | 0 |
| Mode M0 | |||
|---|---|---|---|
| Quadrant | BADHDUFLAG | Total packets | Discarded packets |
| A | 0 | 13953 | 2 |
| B | 0 | 22896 | 2 |
| C | 0 | 14044 | 2 |
| D | 0 | 16633 | 2 |
| Mode M9 | |||
|---|---|---|---|
| Quadrant | BADHDUFLAG | Total packets | Discarded packets |
| A | 0 | 9 | 0 |
| B | 0 | 9 | 0 |
| C | 0 | 9 | 0 |
| D | 0 | 9 | 0 |
| Quadrant | Total seconds | Saturated seconds | Saturation percentage |
|---|---|---|---|
| A | 6731 | 34 | 0.505126% |
| B | 6732 | 271 | 4.025550% |
| C | 6732 | 93 | 1.381462% |
| D | 6732 | 113 | 1.678550% |
Noise dominated data is calculated using 1-second bins in cleaned event files. If a bin has >2000 counts, and if more than 50% of those come from <1% of pixels, then it is considered to be noise-dominated and hence unusable.
| Quadrant | # 1 sec bins | Bins with >0 counts | Bins with >2000 counts | High rate bins dominated by noise | Noise dominated (total time) | Noise dominated (detector-on time) | Marked lightcurve |
|---|---|---|---|---|---|---|---|
| A | 7591 | 6731 | 3 | 3 | 0.04% | 0.04% | 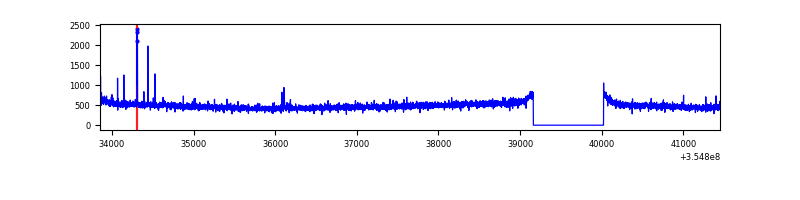 |
| B | 7592 | 6732 | 64 | 64 | 0.84% | 0.95% | 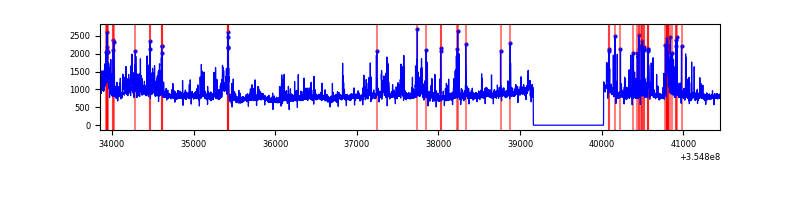 |
| C | 7592 | 6732 | 1 | 1 | 0.01% | 0.01% | 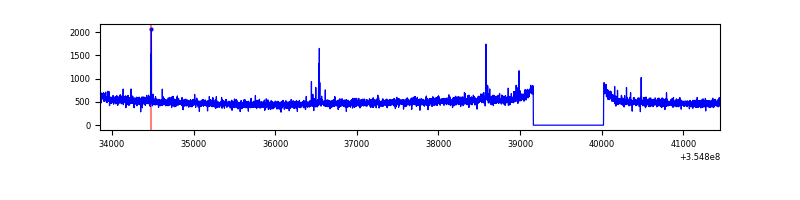 |
| D | 7592 | 6732 | 82 | 82 | 1.08% | 1.22% | 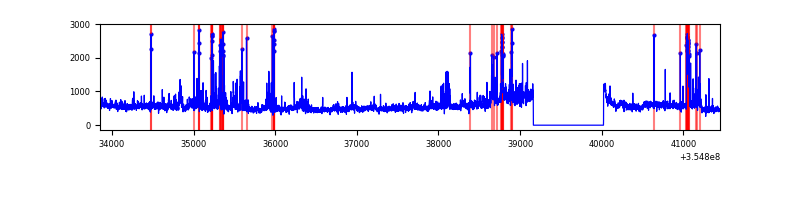 |
Top three noisy pixels from each quadrant. If the there are fewer than three noisy pixels in the level2.evt file, extra rows are filled as -1
| Pixel properties | Quadrant properties | ||||||
|---|---|---|---|---|---|---|---|
| Quadrant | DetID | PixID | Counts | Sigma | Mean | Median | Sigma |
| A | 0 | 167 | 26538 | 152.66 | 841 | 823 | 168.4 |
| A | 13 | 254 | 13239 | 73.71 | 841 | 823 | 168.4 |
| A | 0 | 226 | 8790 | 47.3 | 841 | 823 | 168.4 |
| B | 6 | 159 | 2035945 | 12898.86 | 835 | 815 | 157.8 |
| B | 5 | 255 | 494334 | 3127.97 | 835 | 815 | 157.8 |
| B | 0 | 229 | 356368 | 2253.53 | 835 | 815 | 157.8 |
| C | 14 | 238 | 132552 | 701.74 | 808 | 813 | 187.7 |
| C | 7 | 247 | 40277 | 210.21 | 808 | 813 | 187.7 |
| C | 2 | 114 | 16059 | 81.21 | 808 | 813 | 187.7 |
| D | 8 | 195 | 519297 | 2730.34 | 803 | 783 | 189.9 |
| D | 13 | 104 | 226860 | 1190.45 | 803 | 783 | 189.9 |
| D | 2 | 250 | 220938 | 1159.27 | 803 | 783 | 189.9 |
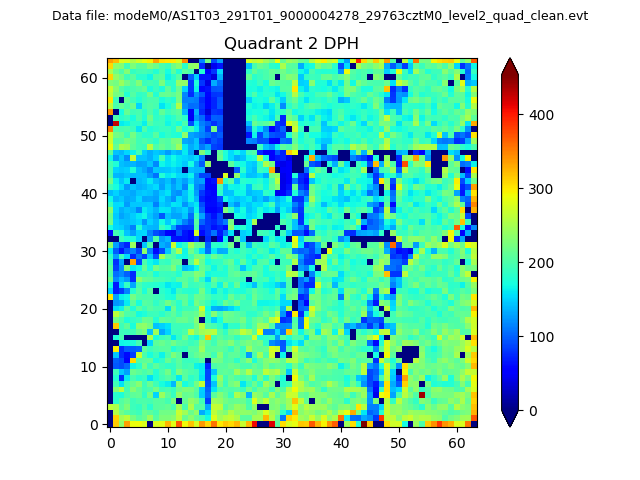
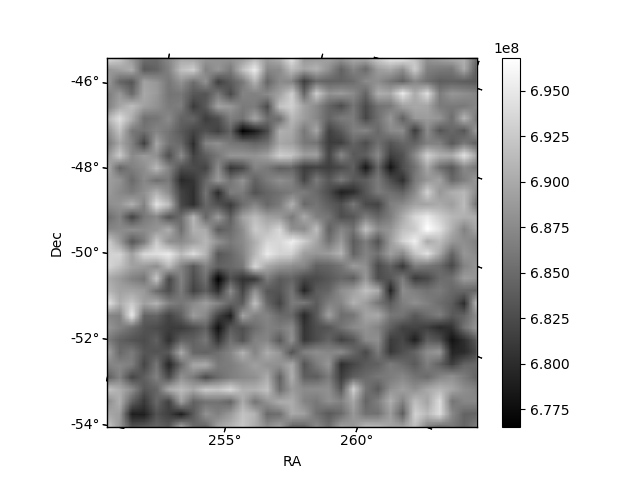
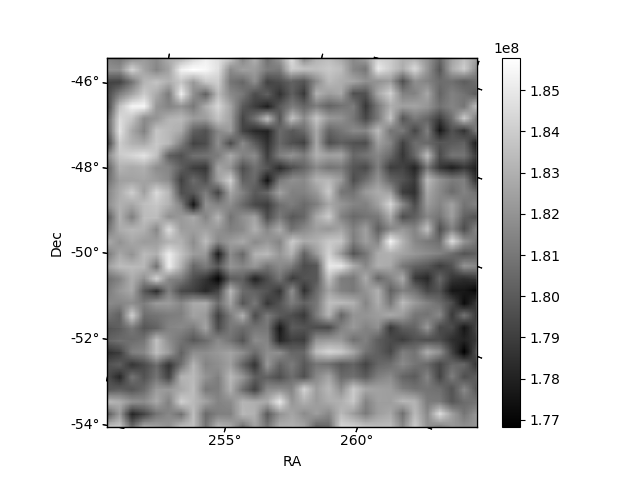
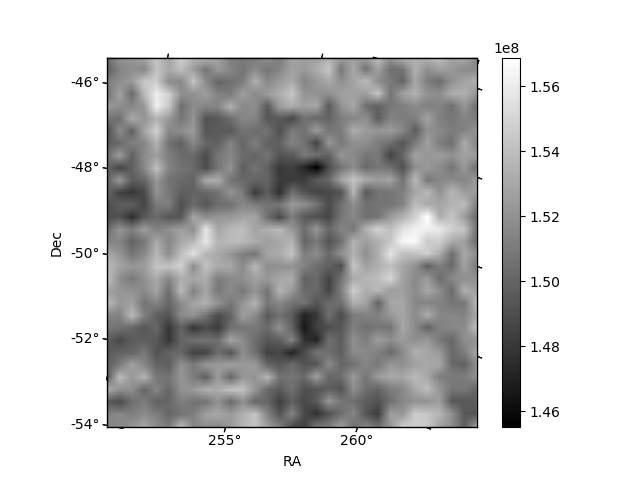
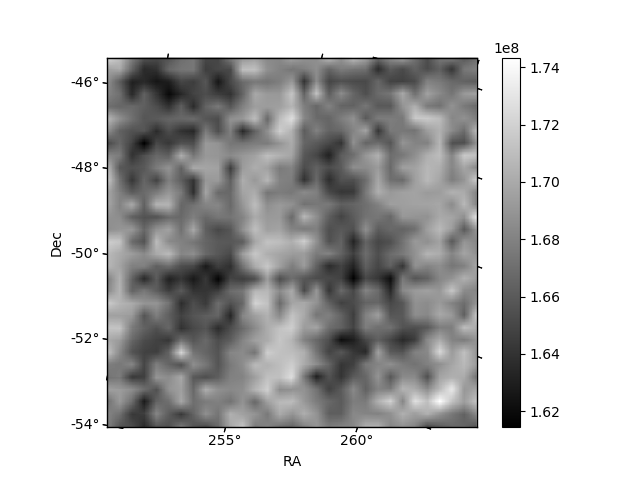
Histogram calculated using DETX and DETY for each event in the final _common_clean file
| Quadrant A | 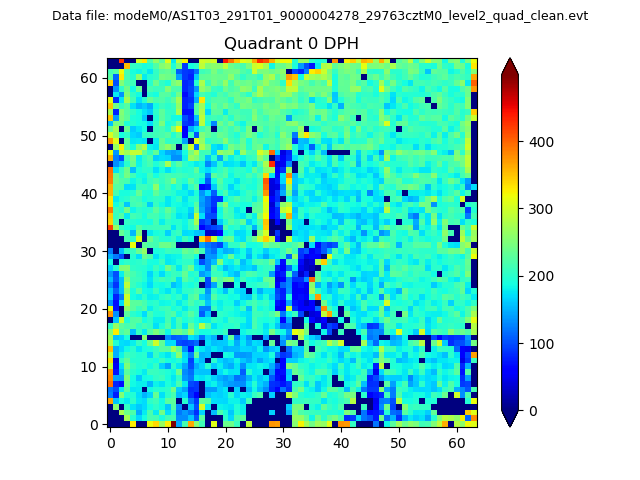 |
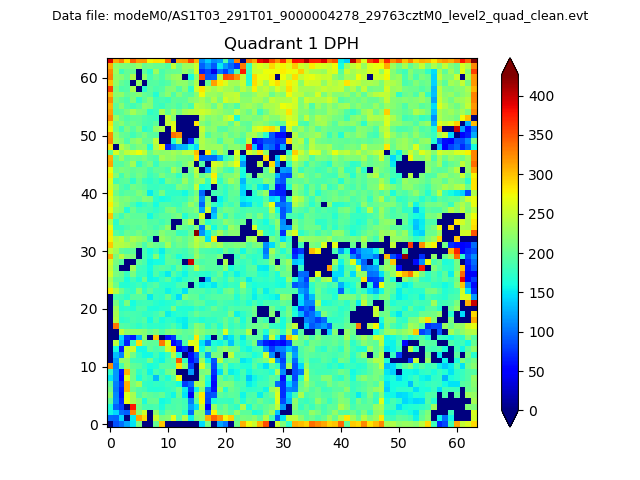 |
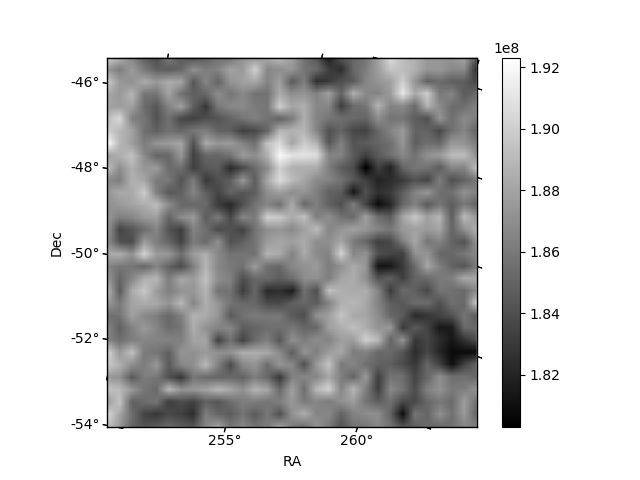
Quadrant B |
|---|---|---|---|
| Quadrant D | 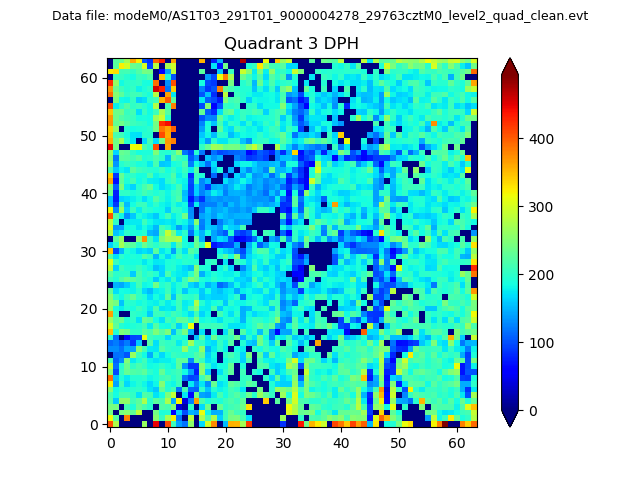 |
 |
Quadrant C |
| Plot type | Count rate plots | Images |
|---|---|---|
| Comparison with Poisson distribution Blue bars denote a histogram of data divided into 1 sec bins. Red curve is a Poisson curve with rate = median count rate of data. |
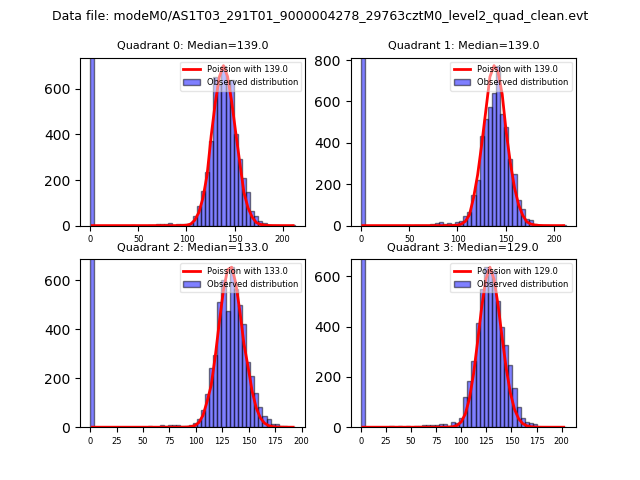 |
 |
| Quadrant-wise count rates Data is divided into 100 sec bins |
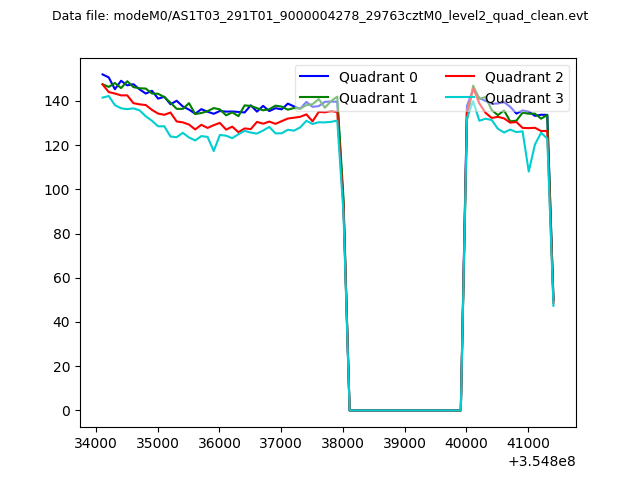 |
|
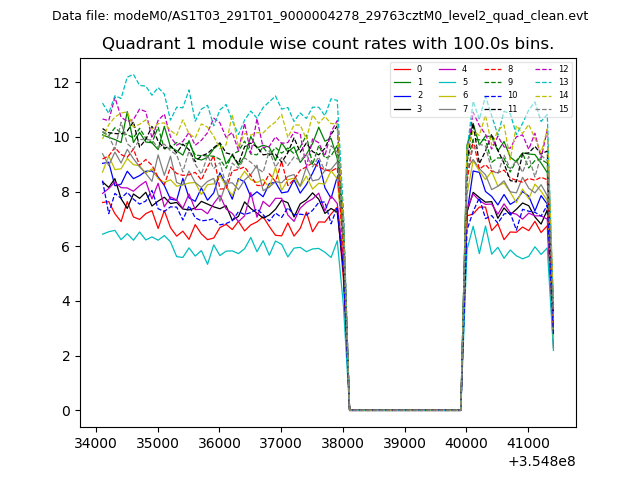
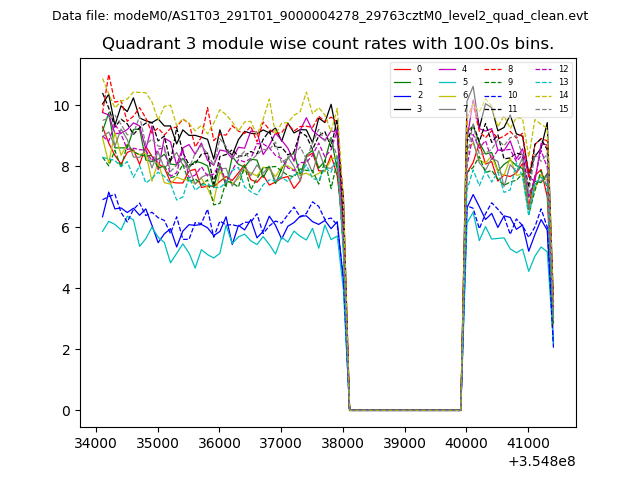
| Module-wise count rates for Quadrant A Data is divided into 100 sec bins |
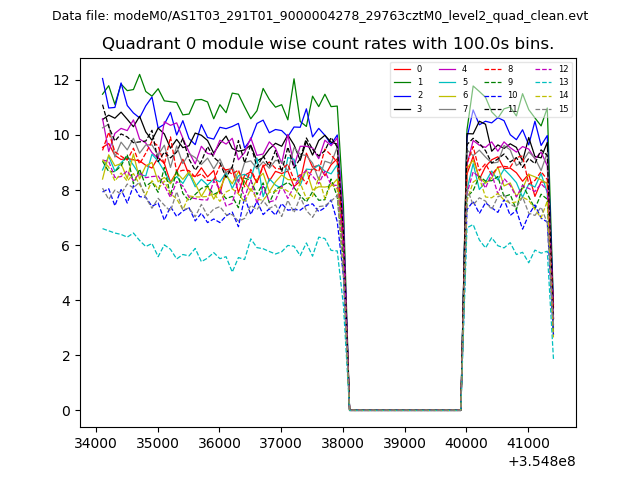 |
 |
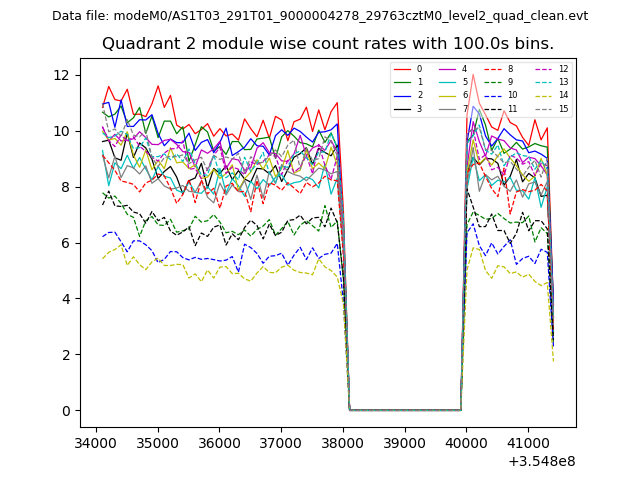
| Module-wise count rates for Quadrant B Data is divided into 100 sec bins |
 |
 |
| Module-wise count rates for Quadrant C Data is divided into 100 sec bins |
 |
 |
| Module-wise count rates for Quadrant D Data is divided into 100 sec bins |
 |
 |
| Parameter | Plot |
|---|---|
| CZT HV Monitor | 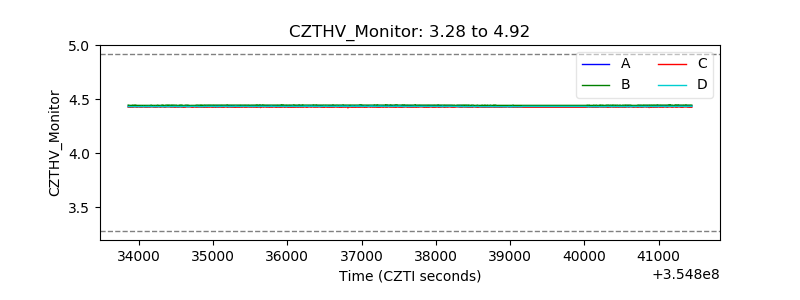 |
| D_VDD | 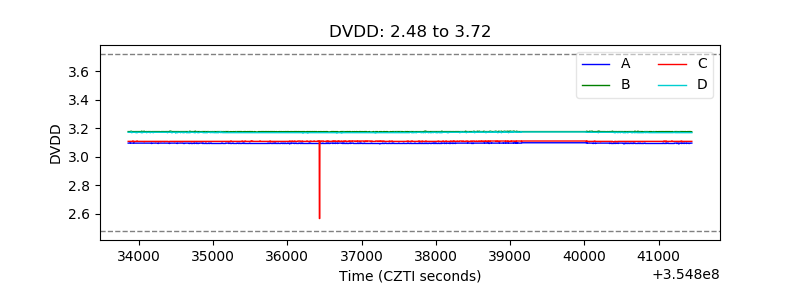 |
| Temperature 1 | 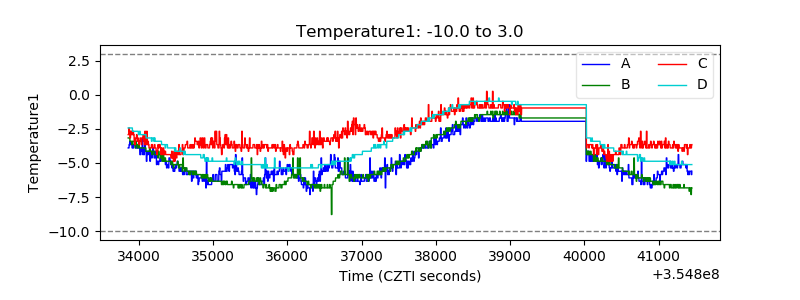 |
| Veto HV Monitor | 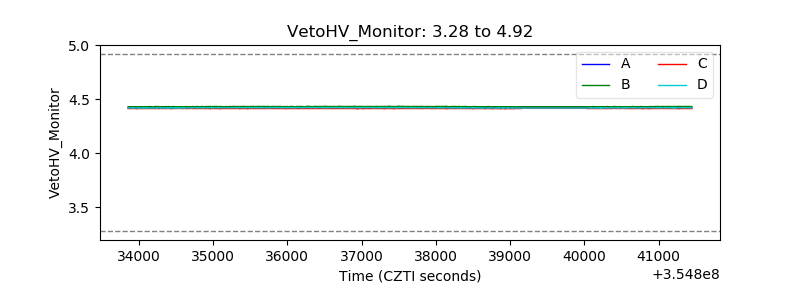 |
| Veto LLD | 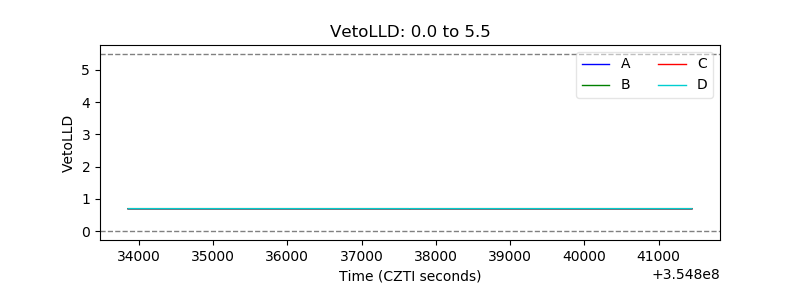 |
| Alpha Counter | 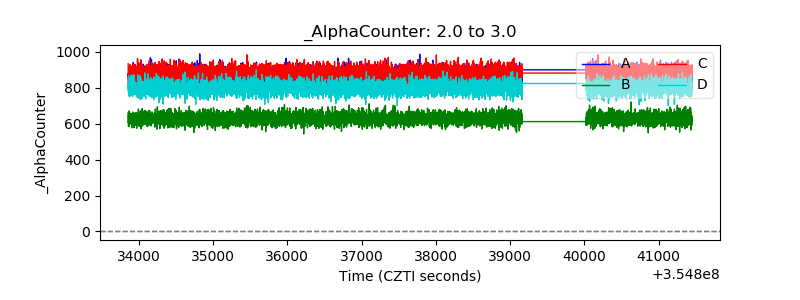 |
| _CPM_Rate | 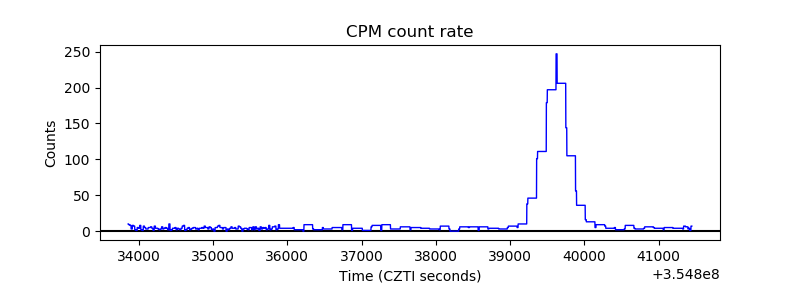 |
| CZT Counter | 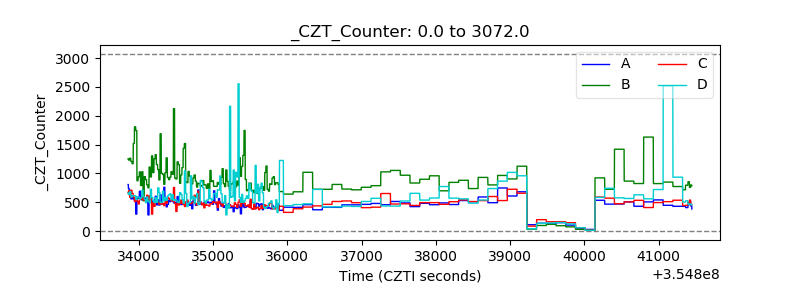 |
| +2.5 Volts monitor |  |
| +5 Volts monitor |  |
| _ROLL_ROT | 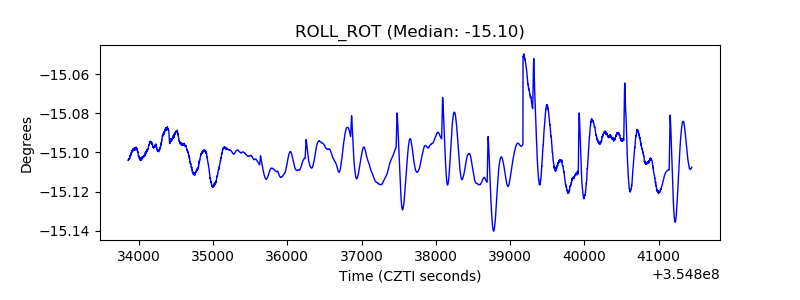 |
| _Roll_DEC |  |
| _Roll_RA | 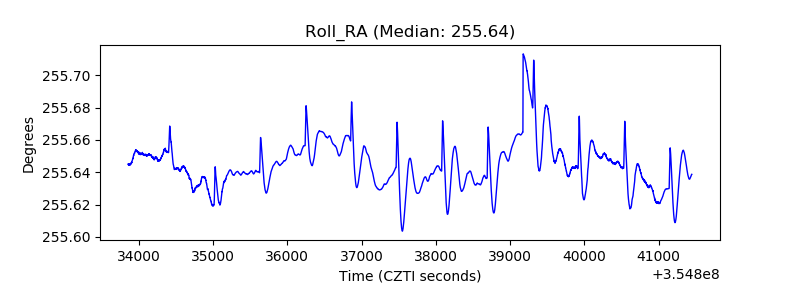 |
| Veto Counter | 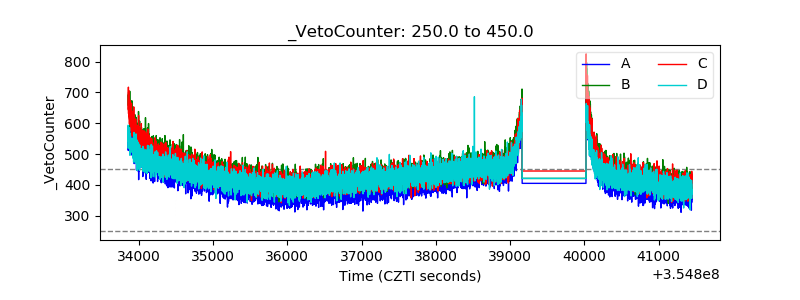 |