| Param | Original file | Final file |
|---|---|---|
| Filename | modeM0/AS1T03_291T01_9000004278_29764cztM0_level2.evt | modeM0/AS1T03_291T01_9000004278_29764cztM0_level2_quad_clean.evt |
| Size (bytes) | 575,982,720 | 106,156,800 |
| Size | 549.3 MB | 101.2 MB |
| Events in quadrant A | 3,359,608 | 700,504 |
| Events in quadrant B | 6,162,364 | 696,465 |
| Events in quadrant C | 3,457,510 | 671,719 |
| Events in quadrant D | 3,981,607 | 650,167 |
| Mode SS | |||
|---|---|---|---|
| Quadrant | BADHDUFLAG | Total packets | Discarded packets |
| A | 0 | 146 | 0 |
| B | 0 | 146 | 0 |
| C | 0 | 146 | 0 |
| D | 0 | 146 | 0 |
| Mode M0 | |||
|---|---|---|---|
| Quadrant | BADHDUFLAG | Total packets | Discarded packets |
| A | 0 | 14573 | 1 |
| B | 0 | 23066 | 2 |
| C | 0 | 14601 | 1 |
| D | 0 | 16539 | 1 |
| Mode M9 | |||
|---|---|---|---|
| Quadrant | BADHDUFLAG | Total packets | Discarded packets |
| A | 0 | 4 | 0 |
| B | 0 | 4 | 0 |
| C | 0 | 4 | 0 |
| D | 0 | 4 | 0 |
| Quadrant | Total seconds | Saturated seconds | Saturation percentage |
|---|---|---|---|
| A | 7120 | 13 | 0.182584% |
| B | 7120 | 239 | 3.356742% |
| C | 7120 | 79 | 1.109551% |
| D | 7120 | 55 | 0.772472% |
Noise dominated data is calculated using 1-second bins in cleaned event files. If a bin has >2000 counts, and if more than 50% of those come from <1% of pixels, then it is considered to be noise-dominated and hence unusable.
| Quadrant | # 1 sec bins | Bins with >0 counts | Bins with >2000 counts | High rate bins dominated by noise | Noise dominated (total time) | Noise dominated (detector-on time) | Marked lightcurve |
|---|---|---|---|---|---|---|---|
| A | 7580 | 7121 | 0 | 0 | 0.00% | 0.00% | 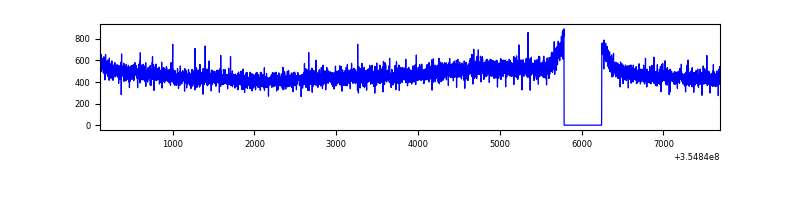 |
| B | 7580 | 7120 | 50 | 50 | 0.66% | 0.70% | 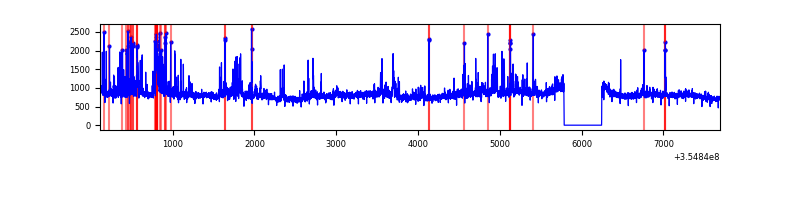 |
| C | 7580 | 7120 | 0 | 0 | 0.00% | 0.00% | 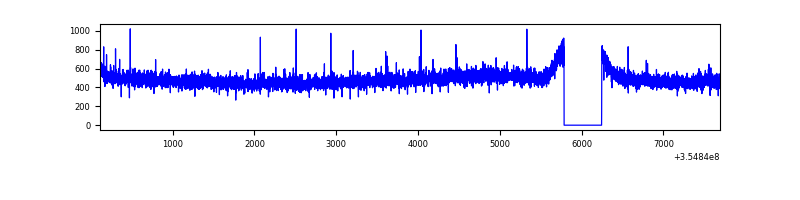 |
| D | 7580 | 7121 | 37 | 37 | 0.49% | 0.52% | 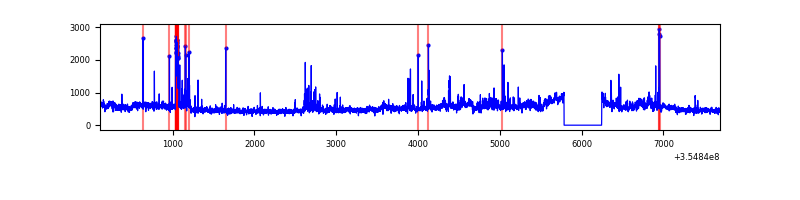 |
Top three noisy pixels from each quadrant. If the there are fewer than three noisy pixels in the level2.evt file, extra rows are filled as -1
| Pixel properties | Quadrant properties | ||||||
|---|---|---|---|---|---|---|---|
| Quadrant | DetID | PixID | Counts | Sigma | Mean | Median | Sigma |
| A | 13 | 254 | 13626 | 72.91 | 869 | 851 | 175.2 |
| A | 3 | 137 | 8924 | 46.08 | 869 | 851 | 175.2 |
| A | 0 | 226 | 7484 | 37.86 | 869 | 851 | 175.2 |
| B | 6 | 159 | 2126660 | 12930.46 | 861 | 838 | 164.4 |
| B | 0 | 229 | 381614 | 2316.1 | 861 | 838 | 164.4 |
| B | 5 | 255 | 250868 | 1520.83 | 861 | 838 | 164.4 |
| C | 14 | 238 | 135321 | 686.88 | 836 | 839 | 195.8 |
| C | 7 | 247 | 28739 | 142.5 | 836 | 839 | 195.8 |
| C | 2 | 114 | 16544 | 80.21 | 836 | 839 | 195.8 |
| D | 8 | 195 | 515864 | 2571.69 | 837 | 814 | 200.3 |
| D | 2 | 250 | 134779 | 668.9 | 837 | 814 | 200.3 |
| D | 7 | 80 | 64399 | 317.49 | 837 | 814 | 200.3 |
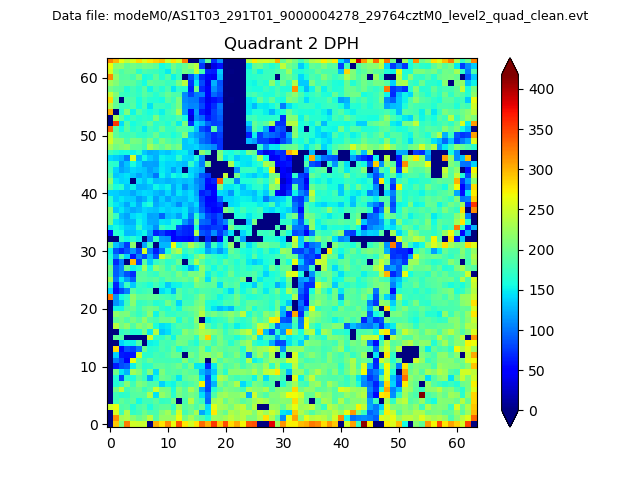
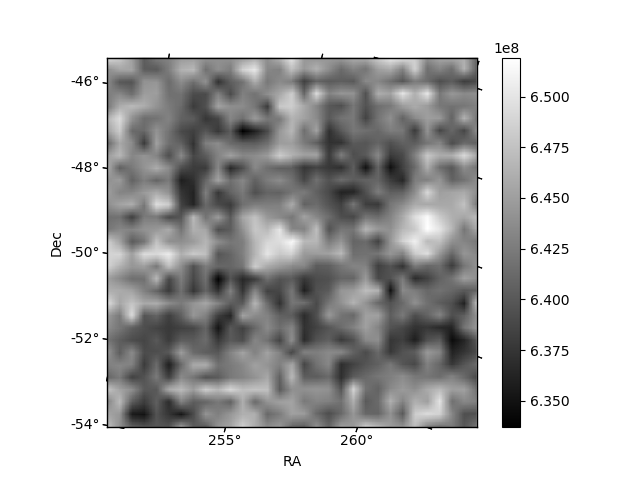
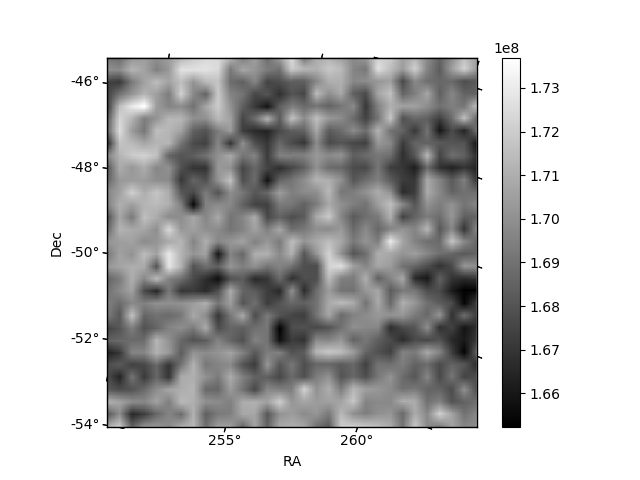
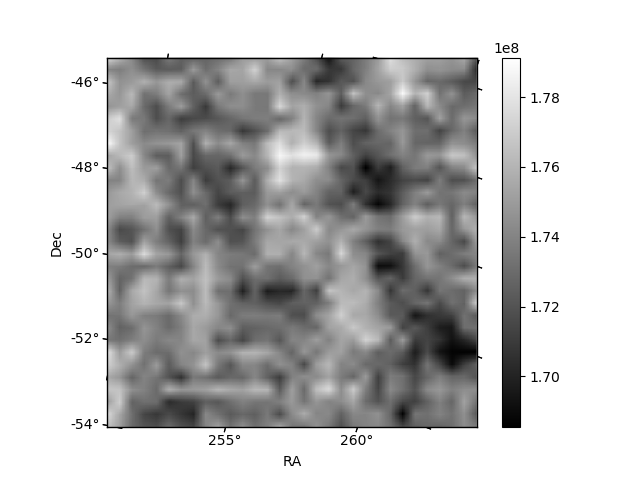
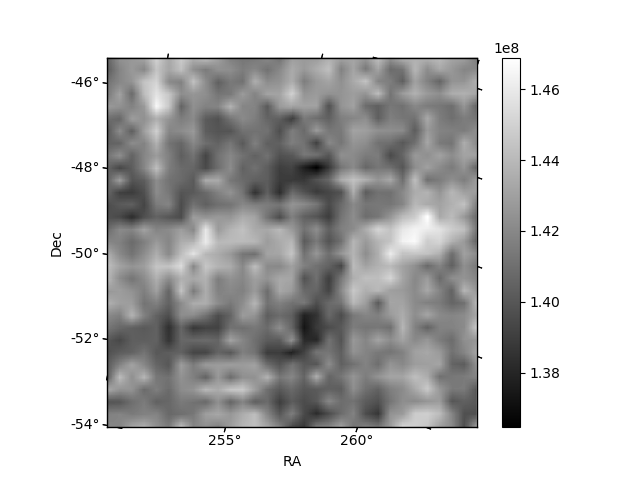
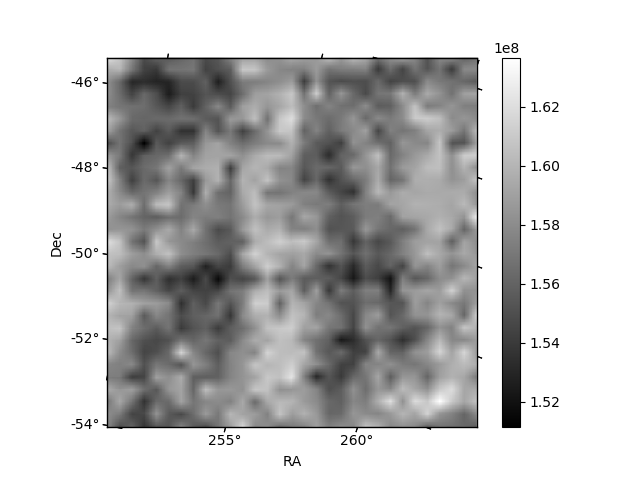
Histogram calculated using DETX and DETY for each event in the final _common_clean file
| Quadrant A | 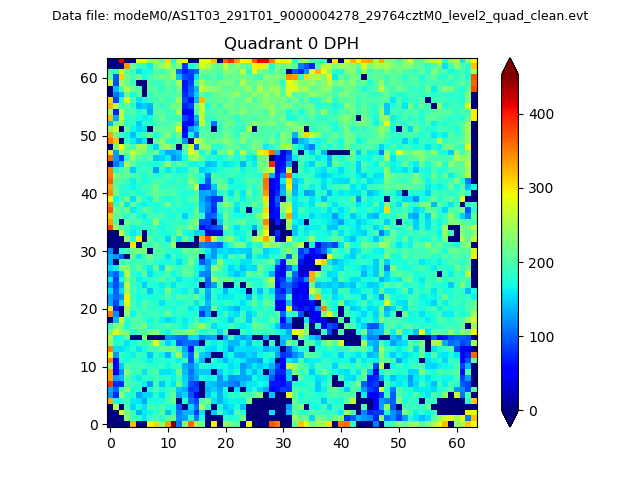 |
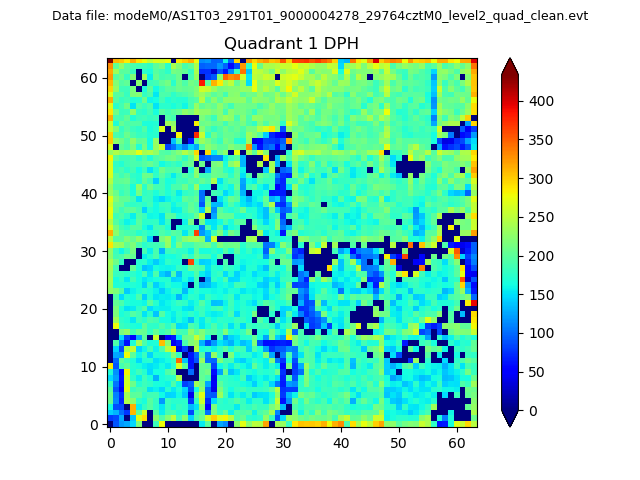 |
Quadrant B |
|---|---|---|---|
| Quadrant D | 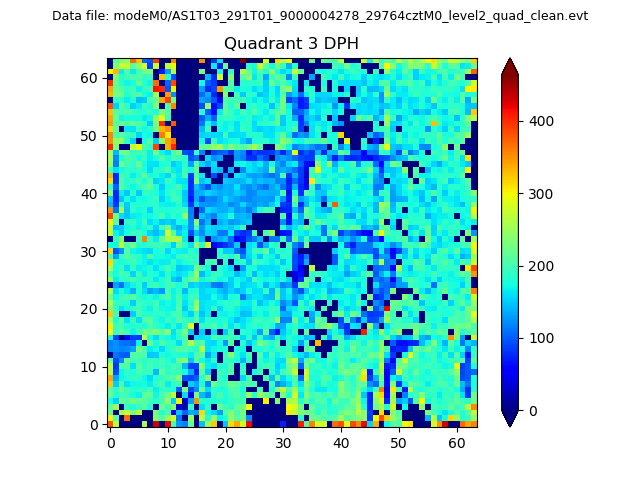 |
 |
Quadrant C |
| Plot type | Count rate plots | Images |
|---|---|---|
| Comparison with Poisson distribution Blue bars denote a histogram of data divided into 1 sec bins. Red curve is a Poisson curve with rate = median count rate of data. |
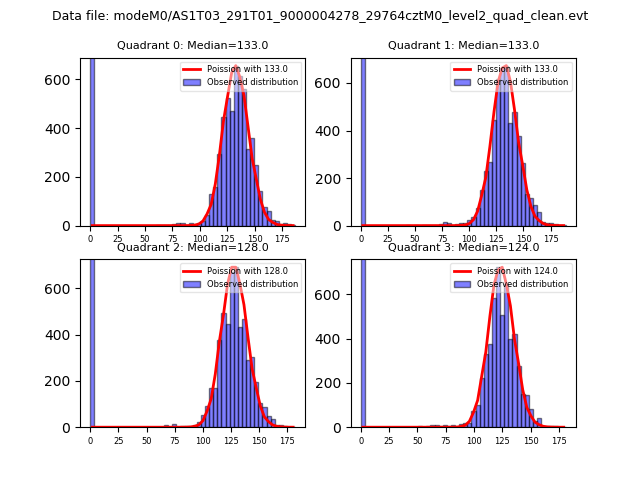 |
 |
| Quadrant-wise count rates Data is divided into 100 sec bins |
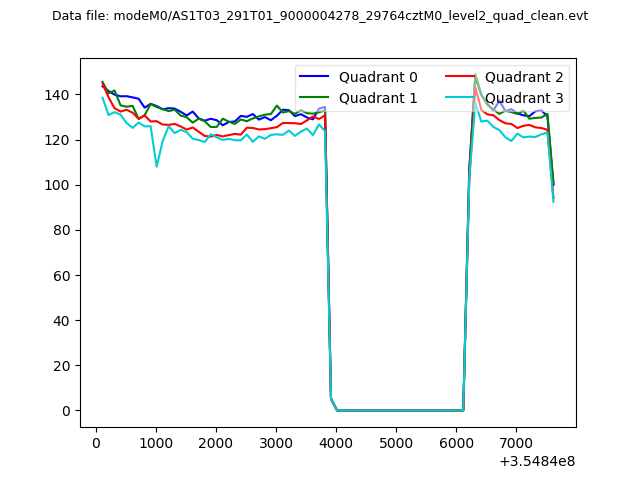 |
|
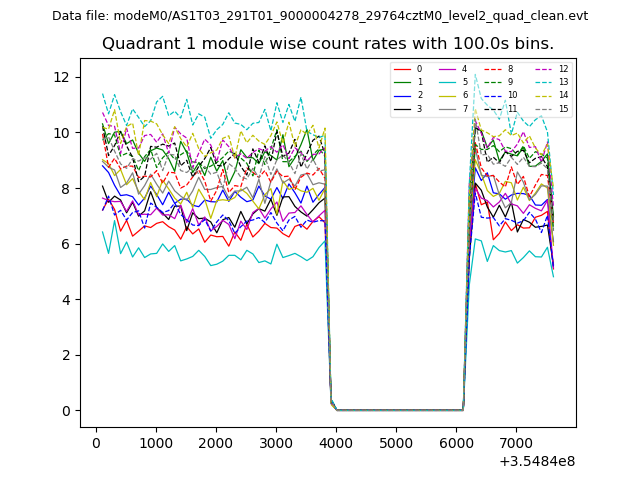
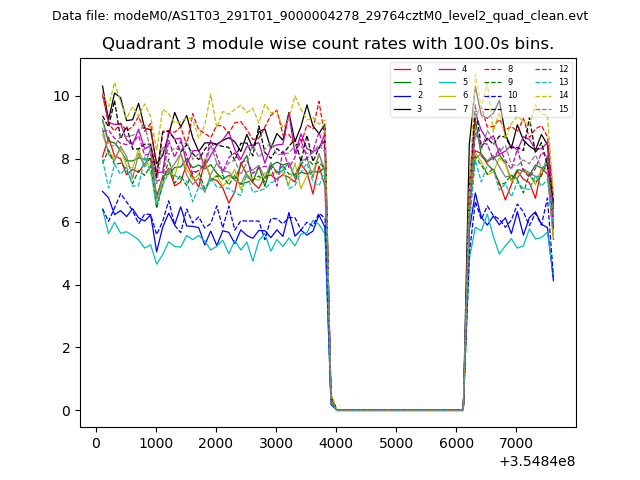
| Module-wise count rates for Quadrant A Data is divided into 100 sec bins |
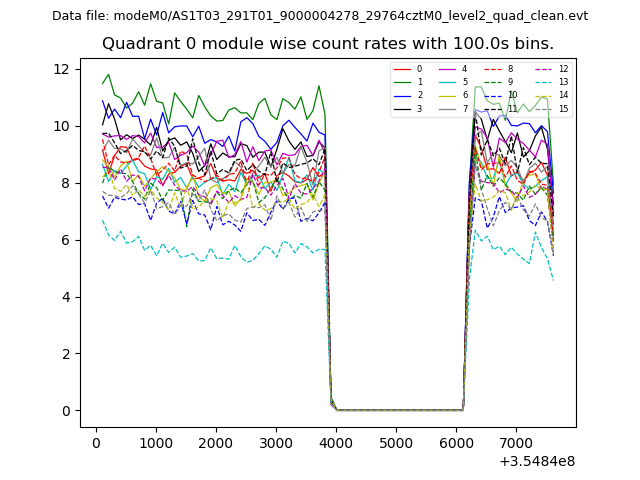 |
 |
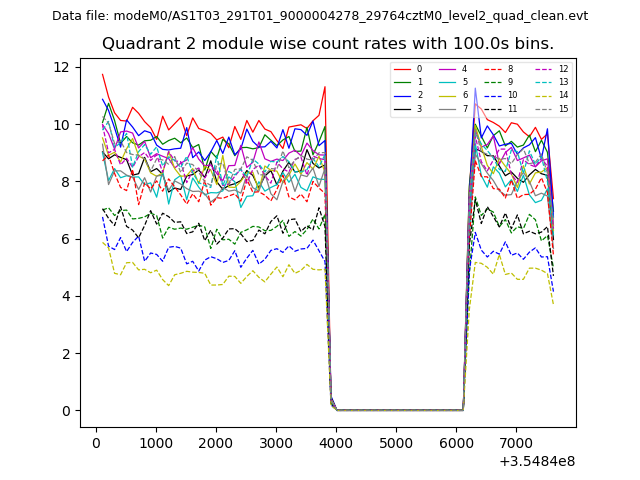
| Module-wise count rates for Quadrant B Data is divided into 100 sec bins |
 |
 |
| Module-wise count rates for Quadrant C Data is divided into 100 sec bins |
 |
 |
| Module-wise count rates for Quadrant D Data is divided into 100 sec bins |
 |
 |
| Parameter | Plot |
|---|---|
| CZT HV Monitor | 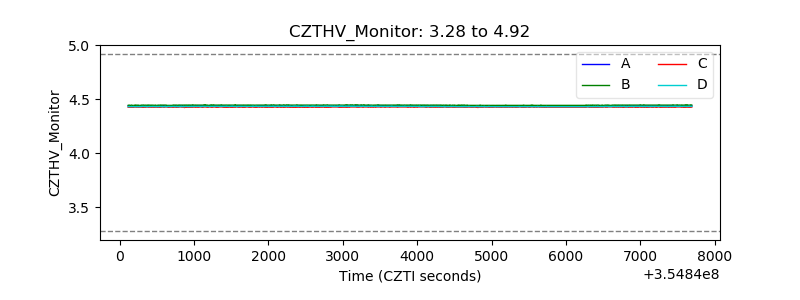 |
| D_VDD | 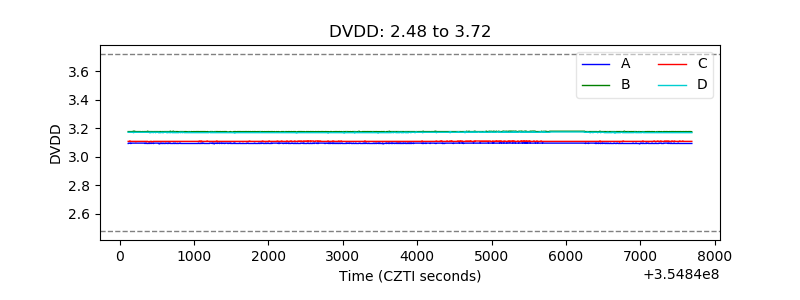 |
| Temperature 1 | 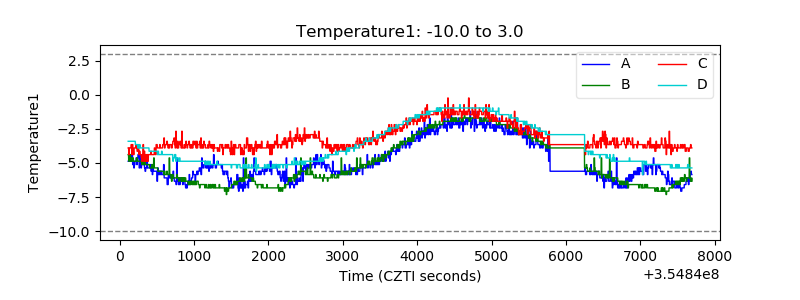 |
| Veto HV Monitor | 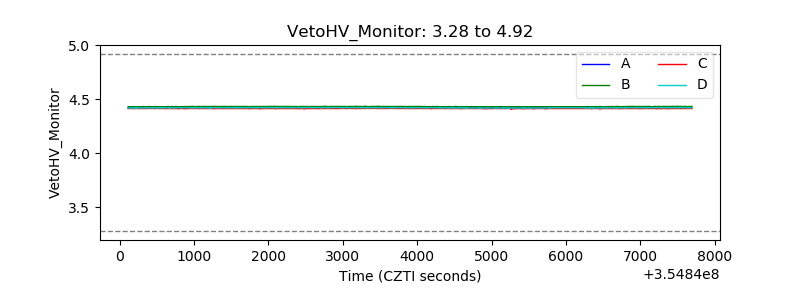 |
| Veto LLD | 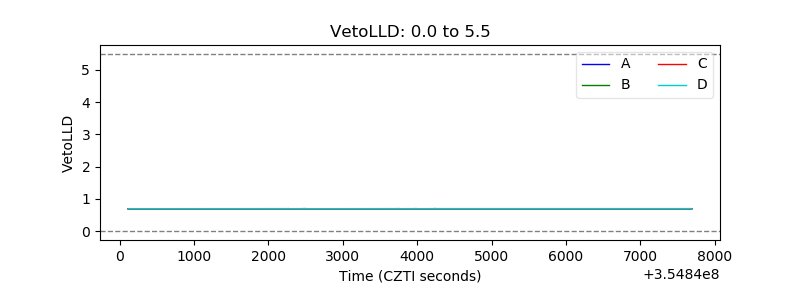 |
| Alpha Counter | 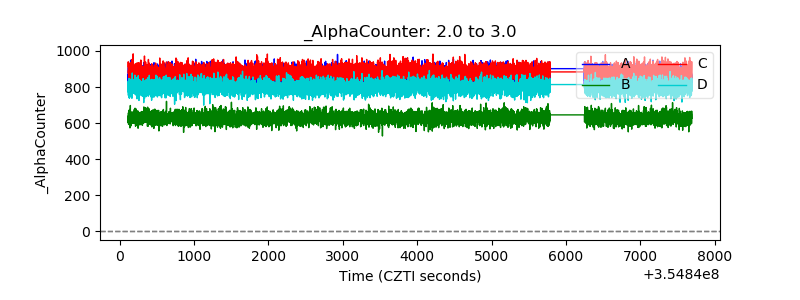 |
| _CPM_Rate | 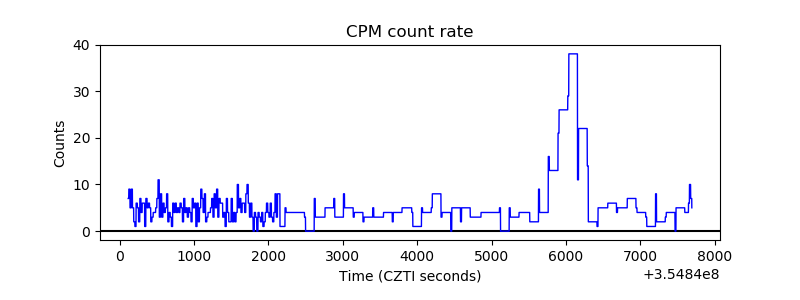 |
| CZT Counter | 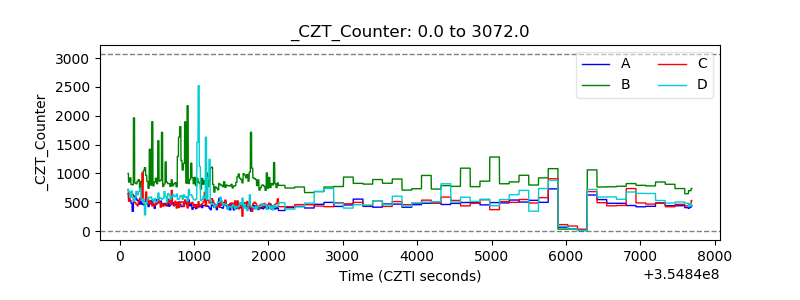 |
| +2.5 Volts monitor |  |
| +5 Volts monitor |  |
| _ROLL_ROT | 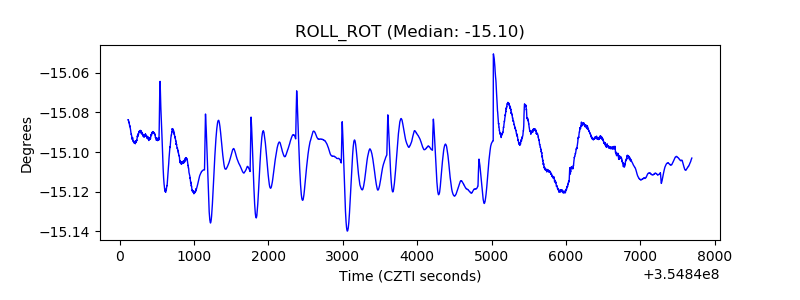 |
| _Roll_DEC |  |
| _Roll_RA | 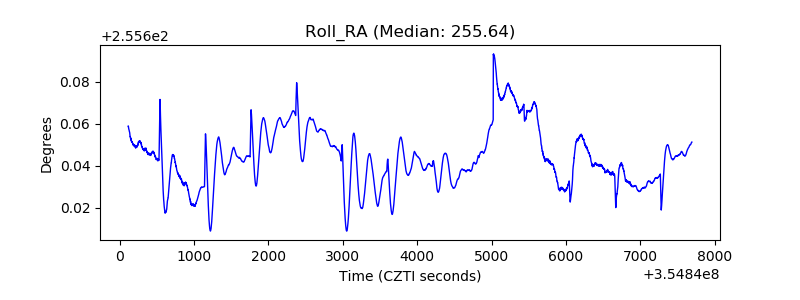 |
| Veto Counter | 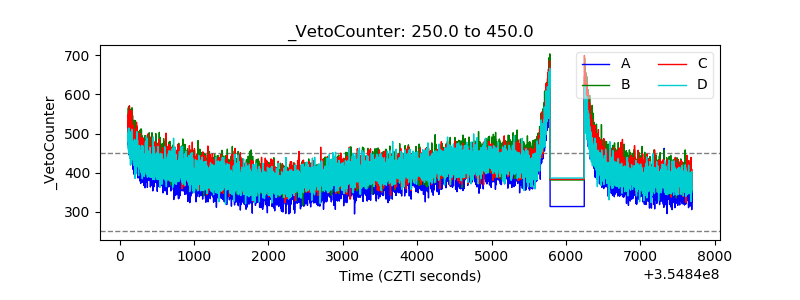 |