| Param | Original file | Final file |
|---|---|---|
| Filename | modeM0/AS1T03_291T01_9000004278_29770cztM0_level2.evt | modeM0/AS1T03_291T01_9000004278_29770cztM0_level2_quad_clean.evt |
| Size (bytes) | 1,429,300,800 | 252,250,560 |
| Size | 1.3 GB | 240.6 MB |
| Events in quadrant A | 8,513,431 | 1,640,802 |
| Events in quadrant B | 14,610,400 | 1,638,134 |
| Events in quadrant C | 9,326,868 | 1,573,263 |
| Events in quadrant D | 9,604,931 | 1,530,158 |
| Mode SS | |||
|---|---|---|---|
| Quadrant | BADHDUFLAG | Total packets | Discarded packets |
| A | 0 | 372 | 0 |
| B | 0 | 372 | 0 |
| C | 0 | 372 | 0 |
| D | 0 | 372 | 0 |
| Mode M0 | |||
|---|---|---|---|
| Quadrant | BADHDUFLAG | Total packets | Discarded packets |
| A | 0 | 37111 | 4 |
| B | 0 | 56749 | 3 |
| C | 0 | 38790 | 3 |
| D | 0 | 39699 | 3 |
| Mode M9 | |||
|---|---|---|---|
| Quadrant | BADHDUFLAG | Total packets | Discarded packets |
| A | 0 | 13 | 0 |
| B | 0 | 13 | 0 |
| C | 0 | 13 | 0 |
| D | 0 | 13 | 0 |
| Quadrant | Total seconds | Saturated seconds | Saturation percentage |
|---|---|---|---|
| A | 18246 | 115 | 0.630275% |
| B | 18247 | 450 | 2.466159% |
| C | 18247 | 332 | 1.819477% |
| D | 18247 | 150 | 0.822053% |
Noise dominated data is calculated using 1-second bins in cleaned event files. If a bin has >2000 counts, and if more than 50% of those come from <1% of pixels, then it is considered to be noise-dominated and hence unusable.
| Quadrant | # 1 sec bins | Bins with >0 counts | Bins with >2000 counts | High rate bins dominated by noise | Noise dominated (total time) | Noise dominated (detector-on time) | Marked lightcurve |
|---|---|---|---|---|---|---|---|
| A | 19641 | 18247 | 0 | 0 | 0.00% | 0.00% | 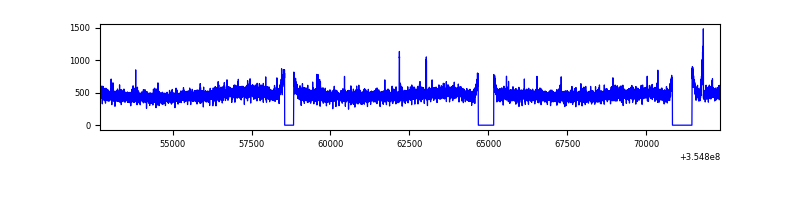 |
| B | 19642 | 18247 | 80 | 80 | 0.41% | 0.44% | 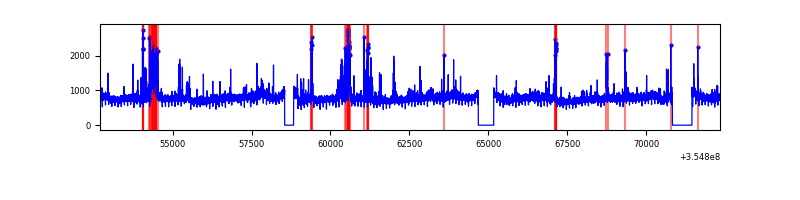 |
| C | 19642 | 18247 | 41 | 41 | 0.21% | 0.22% | 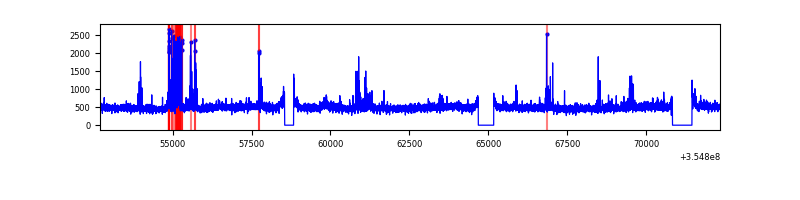 |
| D | 19642 | 18248 | 25 | 25 | 0.13% | 0.14% | 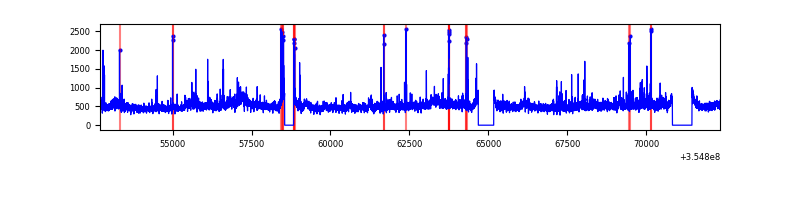 |
Top three noisy pixels from each quadrant. If the there are fewer than three noisy pixels in the level2.evt file, extra rows are filled as -1
| Pixel properties | Quadrant properties | ||||||
|---|---|---|---|---|---|---|---|
| Quadrant | DetID | PixID | Counts | Sigma | Mean | Median | Sigma |
| A | 13 | 254 | 39923 | 86.03 | 2192 | 2144 | 439.1 |
| A | 14 | 250 | 35638 | 76.27 | 2192 | 2144 | 439.1 |
| A | 3 | 137 | 22145 | 45.55 | 2192 | 2144 | 439.1 |
| B | 6 | 159 | 5169183 | 12428.56 | 2169 | 2109 | 415.7 |
| B | 0 | 229 | 764773 | 1834.46 | 2169 | 2109 | 415.7 |
| B | 5 | 255 | 59682 | 138.48 | 2169 | 2109 | 415.7 |
| C | 10 | 22 | 422741 | 853.64 | 2111 | 2125 | 492.7 |
| C | 14 | 238 | 343318 | 692.45 | 2111 | 2125 | 492.7 |
| C | 3 | 233 | 201050 | 403.72 | 2111 | 2125 | 492.7 |
| D | 8 | 195 | 1157815 | 2290.38 | 2123 | 2063 | 504.6 |
| D | 2 | 250 | 121853 | 237.39 | 2123 | 2063 | 504.6 |
| D | 13 | 104 | 112187 | 218.23 | 2123 | 2063 | 504.6 |
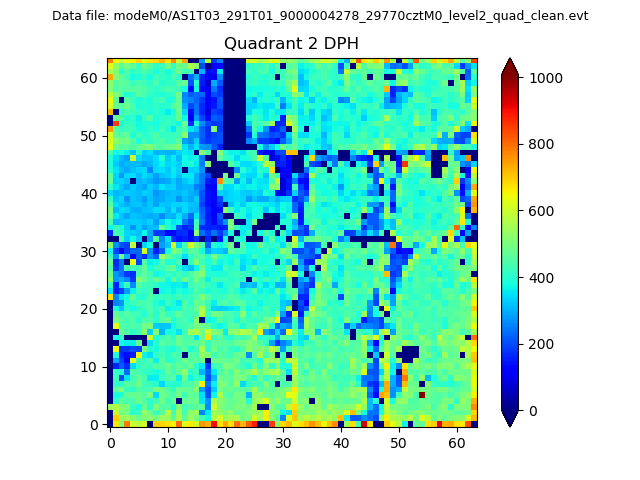
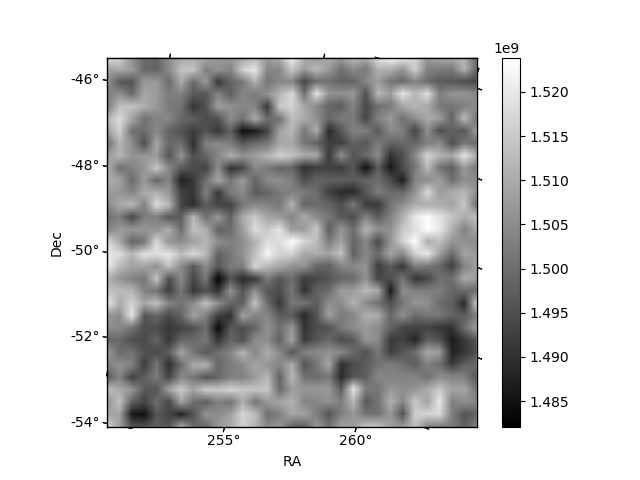
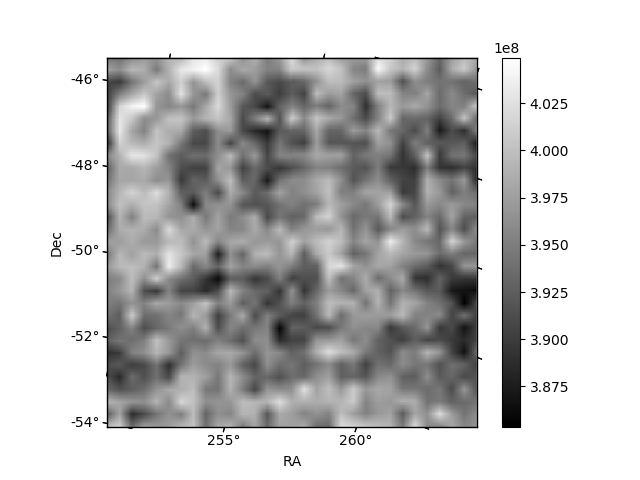
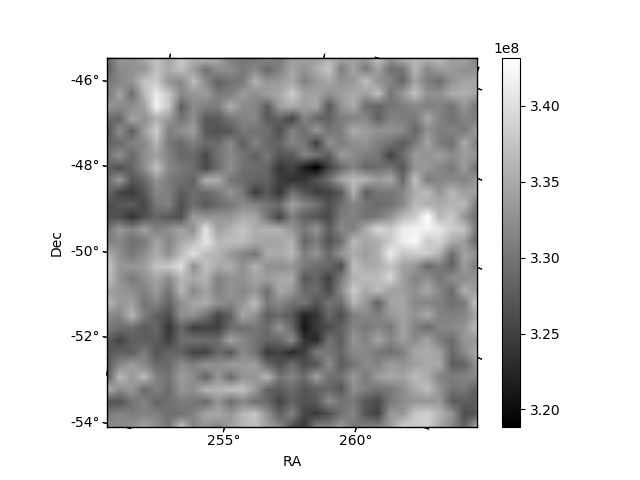
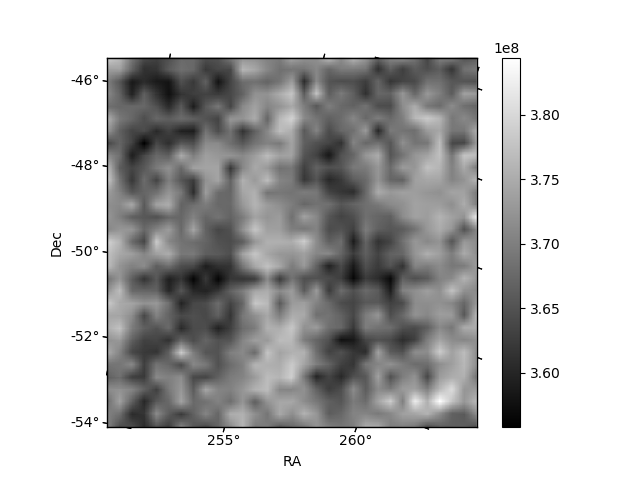
Histogram calculated using DETX and DETY for each event in the final _common_clean file
| Quadrant A | 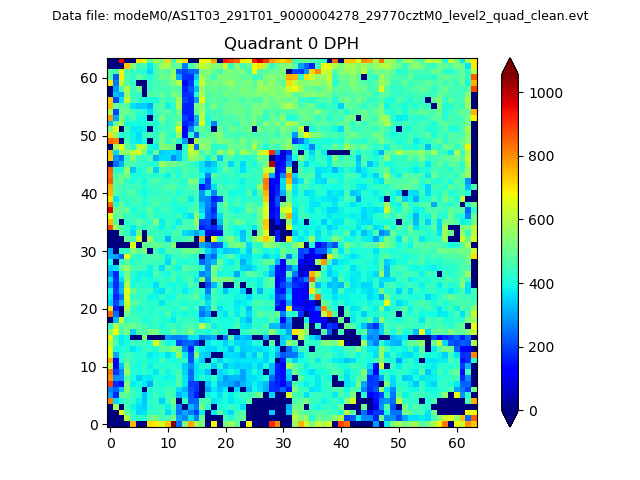 |
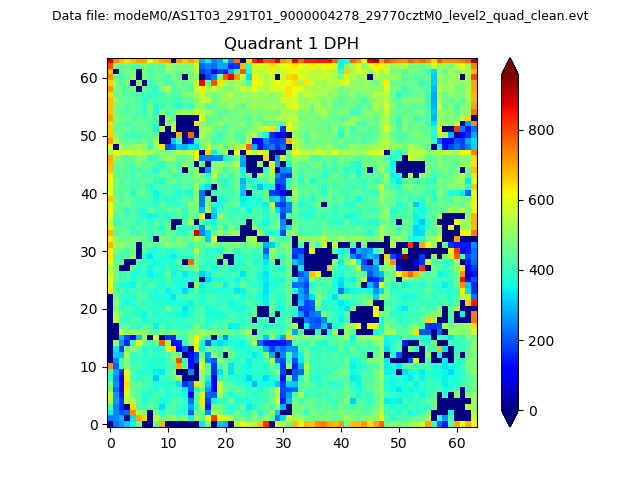 |
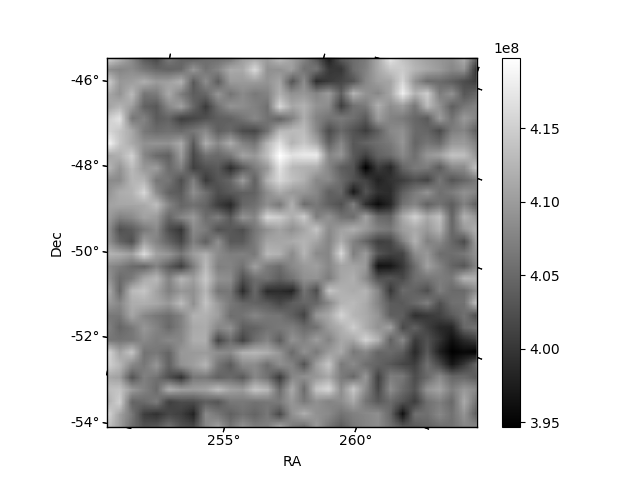
Quadrant B |
|---|---|---|---|
| Quadrant D | 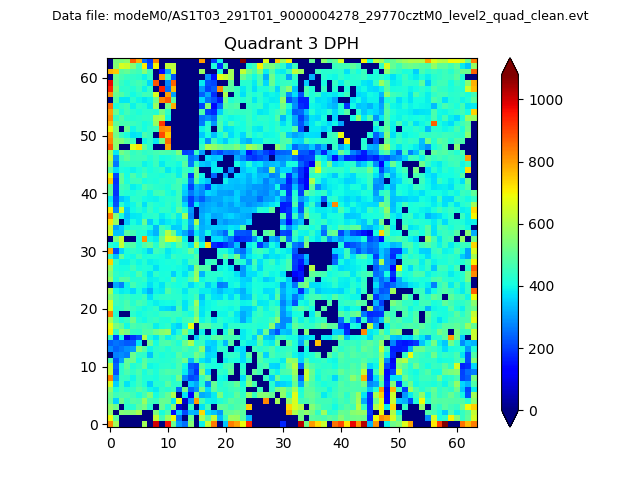 |
 |
Quadrant C |
| Plot type | Count rate plots | Images |
|---|---|---|
| Comparison with Poisson distribution Blue bars denote a histogram of data divided into 1 sec bins. Red curve is a Poisson curve with rate = median count rate of data. |
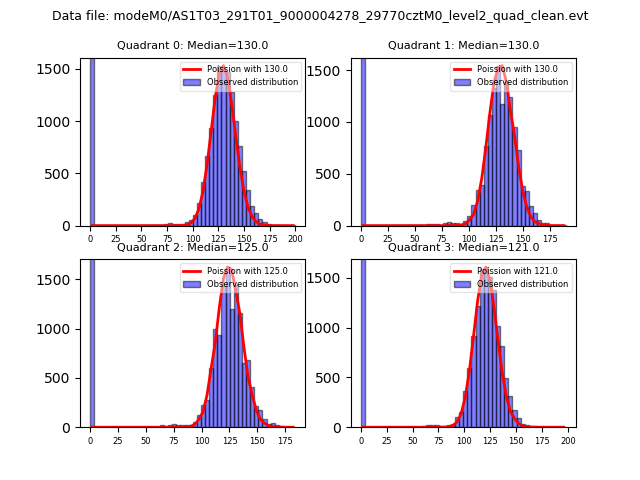 |
 |
| Quadrant-wise count rates Data is divided into 100 sec bins |
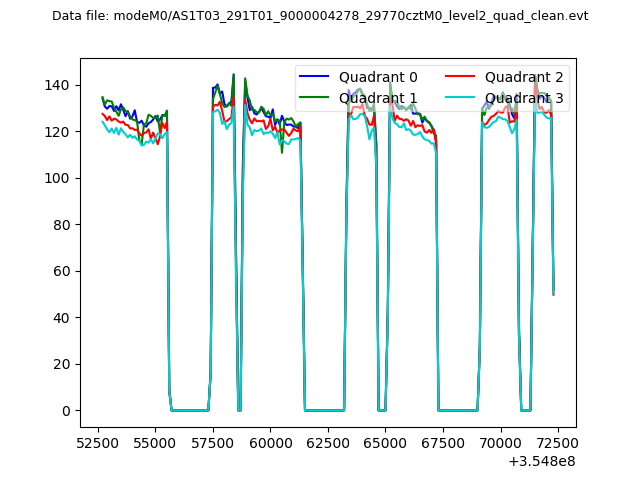 |
|
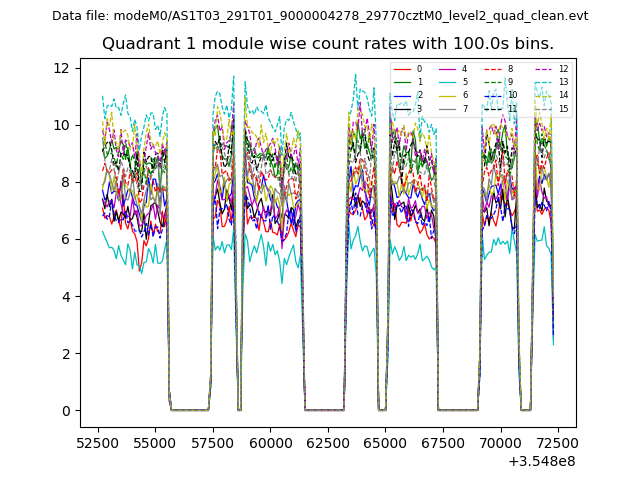
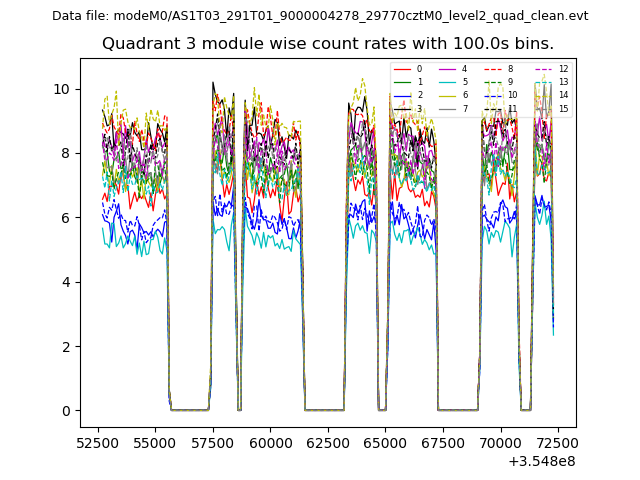
| Module-wise count rates for Quadrant A Data is divided into 100 sec bins |
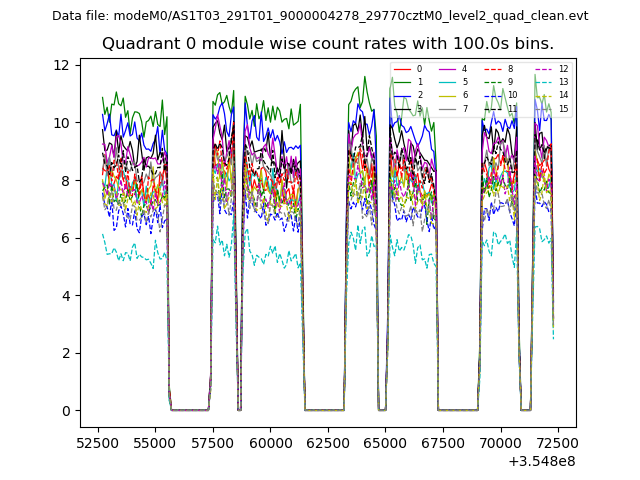 |
 |
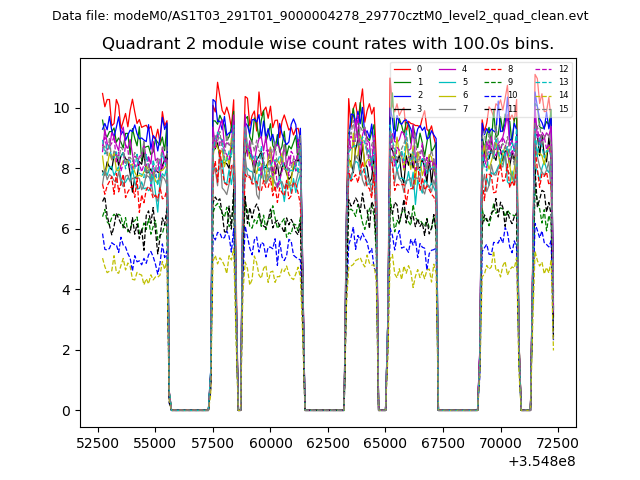
| Module-wise count rates for Quadrant B Data is divided into 100 sec bins |
 |
 |
| Module-wise count rates for Quadrant C Data is divided into 100 sec bins |
 |
 |
| Module-wise count rates for Quadrant D Data is divided into 100 sec bins |
 |
 |
| Parameter | Plot |
|---|---|
| CZT HV Monitor | 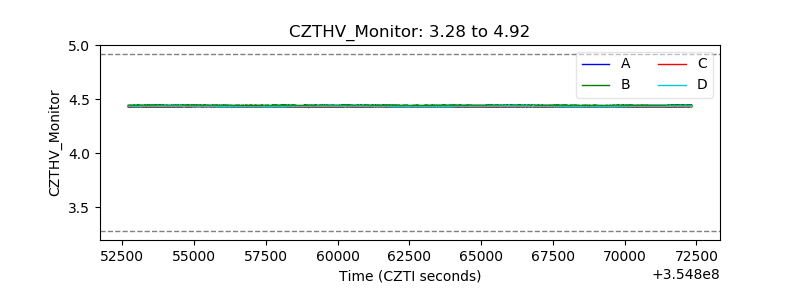 |
| D_VDD | 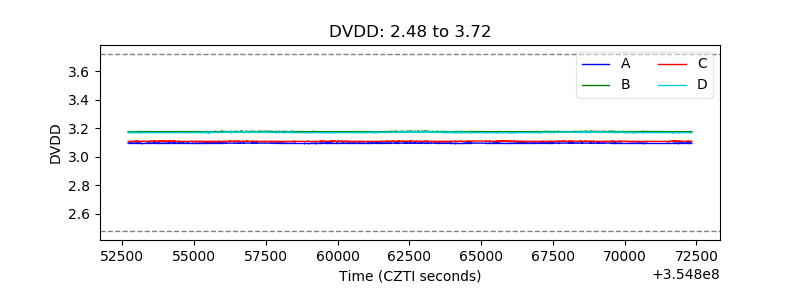 |
| Temperature 1 | 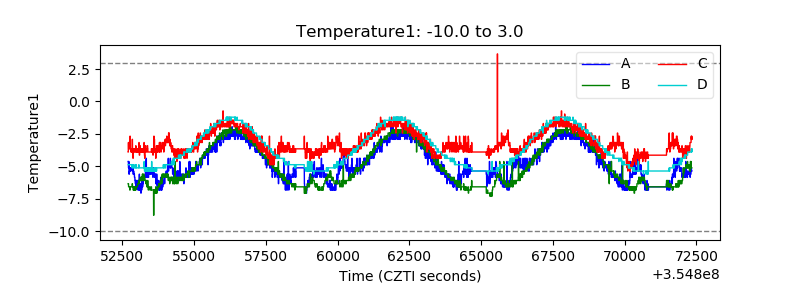 |
| Veto HV Monitor | 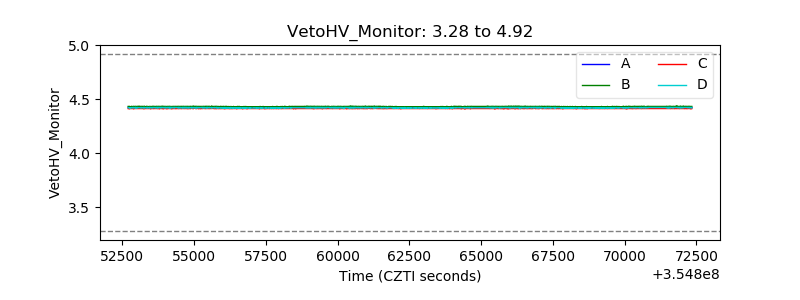 |
| Veto LLD | 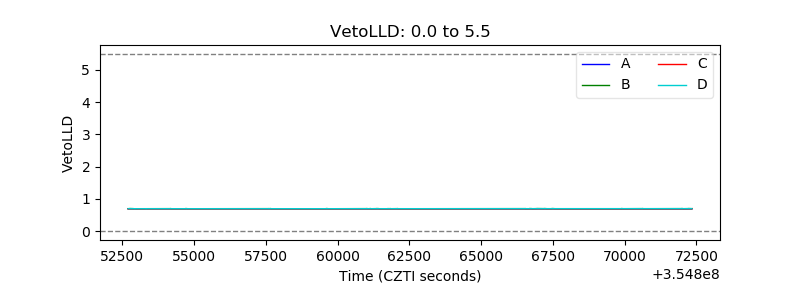 |
| Alpha Counter | 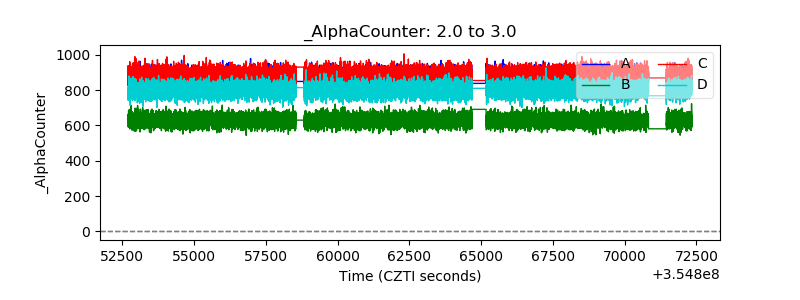 |
| _CPM_Rate | 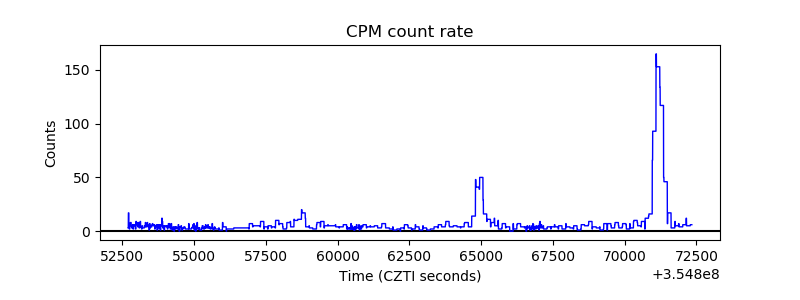 |
| CZT Counter | 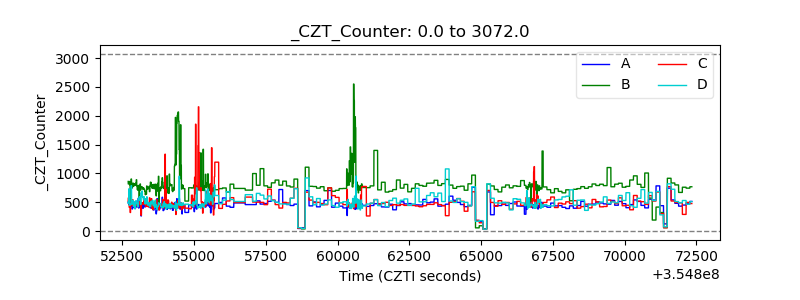 |
| +2.5 Volts monitor |  |
| +5 Volts monitor | 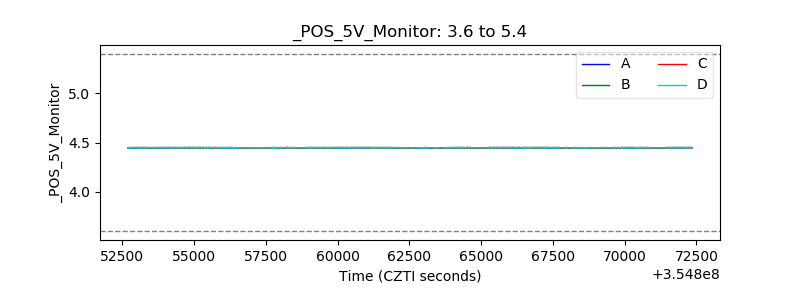 |
| _ROLL_ROT | 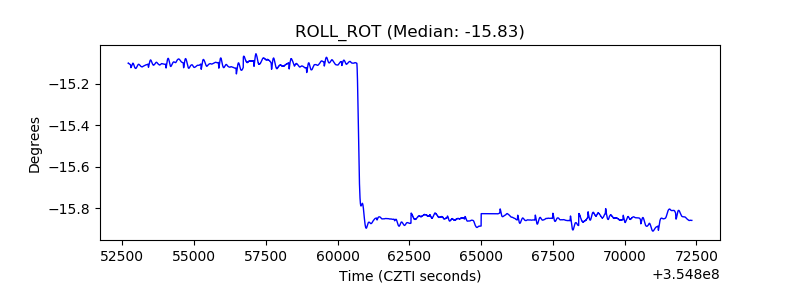 |
| _Roll_DEC | 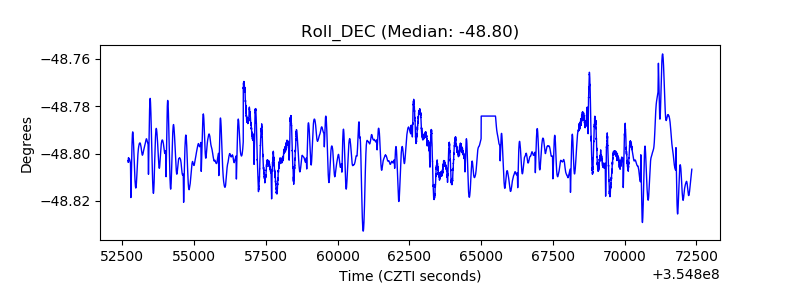 |
| _Roll_RA | 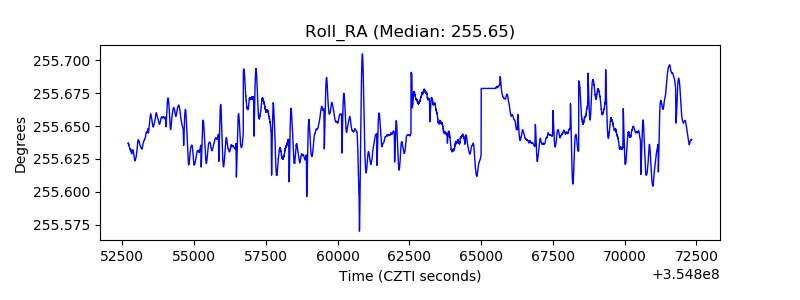 |
| Veto Counter | 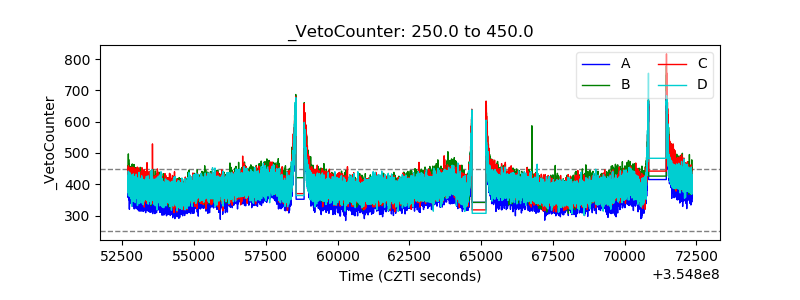 |