| Param | Original file | Final file |
|---|---|---|
| Filename | modeM0/AS1T03_291T01_9000004278_29773cztM0_level2.evt | modeM0/AS1T03_291T01_9000004278_29773cztM0_level2_quad_clean.evt |
| Size (bytes) | 593,501,760 | 70,171,200 |
| Size | 566.0 MB | 66.9 MB |
| Events in quadrant A | 3,459,203 | 438,007 |
| Events in quadrant B | 6,235,430 | 427,206 |
| Events in quadrant C | 3,732,344 | 408,175 |
| Events in quadrant D | 4,113,099 | 403,163 |
| Mode SS | |||
|---|---|---|---|
| Quadrant | BADHDUFLAG | Total packets | Discarded packets |
| A | 0 | 130 | 0 |
| B | 0 | 130 | 0 |
| C | 0 | 130 | 0 |
| D | 0 | 130 | 0 |
| Mode M0 | |||
|---|---|---|---|
| Quadrant | BADHDUFLAG | Total packets | Discarded packets |
| A | 0 | 14480 | 1 |
| B | 0 | 22680 | 1 |
| C | 0 | 15209 | 1 |
| D | 0 | 16493 | 1 |
| Mode M9 | |||
|---|---|---|---|
| Quadrant | BADHDUFLAG | Total packets | Discarded packets |
| A | 0 | 12 | 0 |
| B | 0 | 12 | 0 |
| C | 0 | 12 | 0 |
| D | 0 | 12 | 0 |
| Quadrant | Total seconds | Saturated seconds | Saturation percentage |
|---|---|---|---|
| A | 6422 | 80 | 1.245718% |
| B | 6422 | 469 | 7.303021% |
| C | 6421 | 184 | 2.865597% |
| D | 6421 | 94 | 1.463946% |
Noise dominated data is calculated using 1-second bins in cleaned event files. If a bin has >2000 counts, and if more than 50% of those come from <1% of pixels, then it is considered to be noise-dominated and hence unusable.
| Quadrant | # 1 sec bins | Bins with >0 counts | Bins with >2000 counts | High rate bins dominated by noise | Noise dominated (total time) | Noise dominated (detector-on time) | Marked lightcurve |
|---|---|---|---|---|---|---|---|
| A | 7621 | 6421 | 0 | 0 | 0.00% | 0.00% | 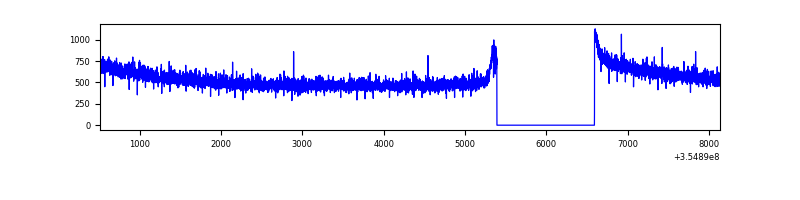 |
| B | 7621 | 6421 | 207 | 207 | 2.72% | 3.22% | 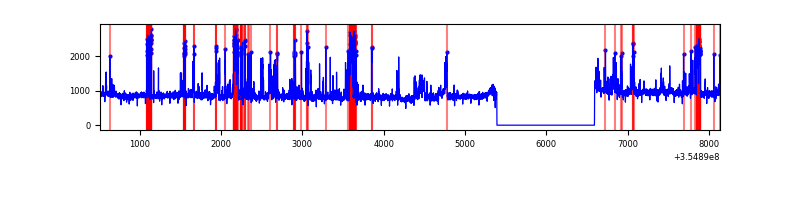 |
| C | 7620 | 6420 | 0 | 0 | 0.00% | 0.00% | 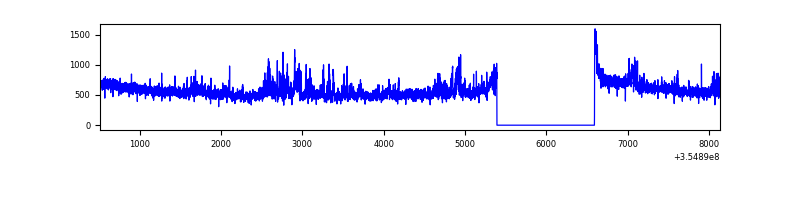 |
| D | 7620 | 6420 | 27 | 27 | 0.35% | 0.42% | 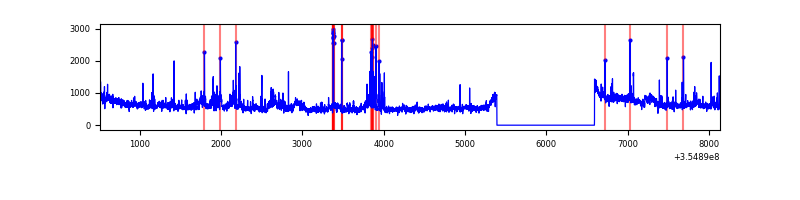 |
Top three noisy pixels from each quadrant. If the there are fewer than three noisy pixels in the level2.evt file, extra rows are filled as -1
| Pixel properties | Quadrant properties | ||||||
|---|---|---|---|---|---|---|---|
| Quadrant | DetID | PixID | Counts | Sigma | Mean | Median | Sigma |
| A | 13 | 254 | 16102 | 86.34 | 895 | 881 | 176.3 |
| A | 3 | 137 | 8115 | 41.03 | 895 | 881 | 176.3 |
| A | 0 | 226 | 7811 | 39.31 | 895 | 881 | 176.3 |
| B | 6 | 159 | 1855803 | 11696.02 | 862 | 845 | 158.6 |
| B | 0 | 229 | 888215 | 5595.11 | 862 | 845 | 158.6 |
| B | 5 | 255 | 67581 | 420.79 | 862 | 845 | 158.6 |
| C | 3 | 233 | 298151 | 1574.4 | 829 | 839 | 188.8 |
| C | 14 | 238 | 155634 | 819.71 | 829 | 839 | 188.8 |
| C | 14 | 254 | 26557 | 136.19 | 829 | 839 | 188.8 |
| D | 8 | 195 | 636353 | 3247.15 | 848 | 829 | 195.7 |
| D | 2 | 250 | 122190 | 620.08 | 848 | 829 | 195.7 |
| D | 11 | 176 | 33860 | 168.77 | 848 | 829 | 195.7 |
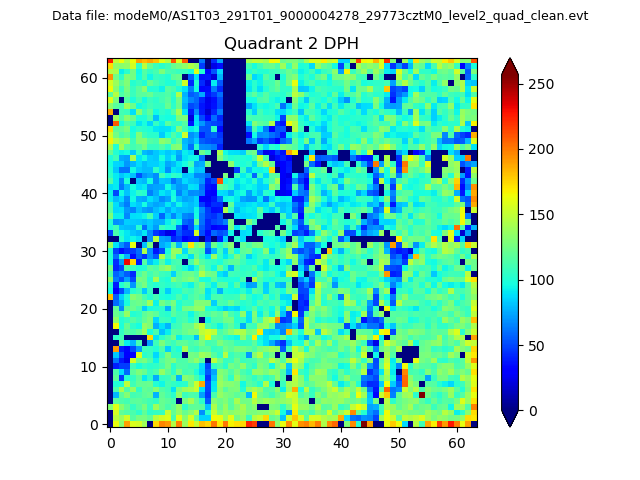
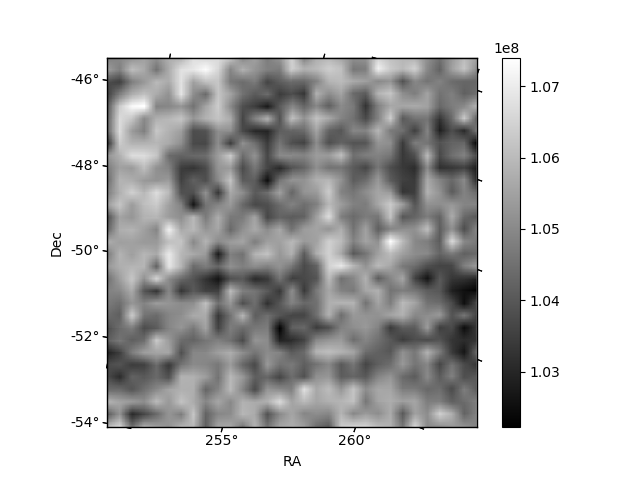
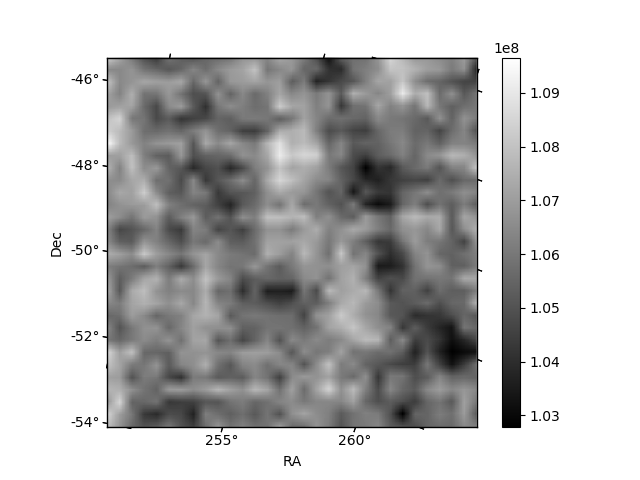
Histogram calculated using DETX and DETY for each event in the final _common_clean file
| Quadrant A | 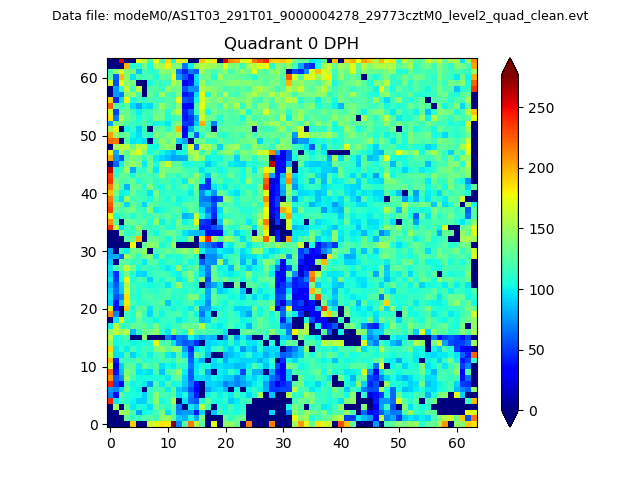 |
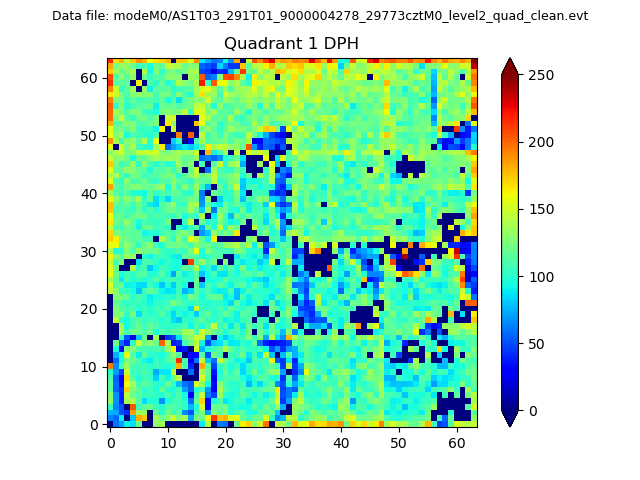 |
Quadrant B |
|---|---|---|---|
| Quadrant D | 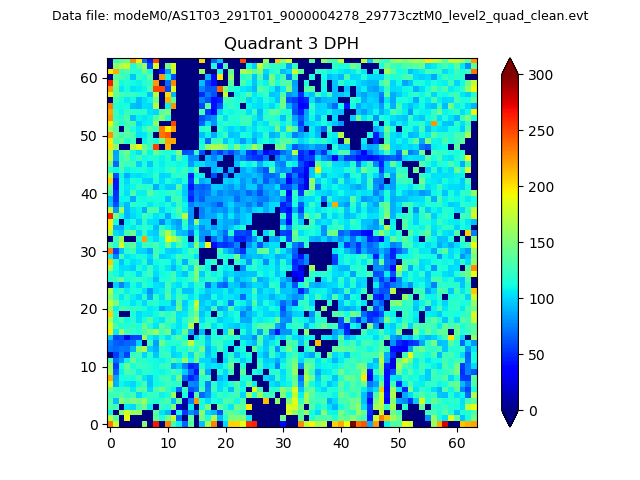 |
 |
Quadrant C |
| Plot type | Count rate plots | Images |
|---|---|---|
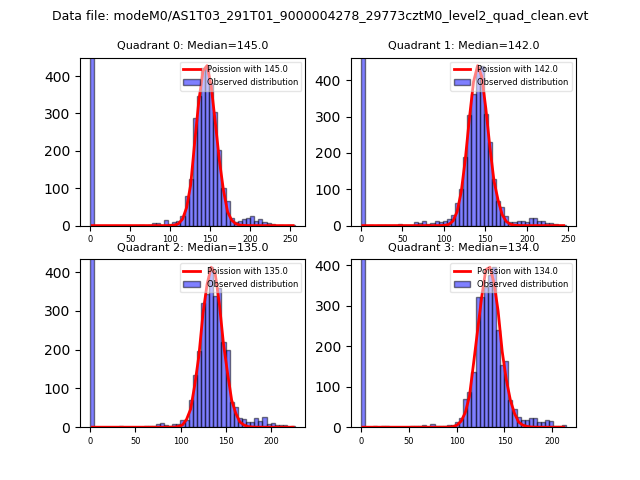
| Comparison with Poisson distribution Blue bars denote a histogram of data divided into 1 sec bins. Red curve is a Poisson curve with rate = median count rate of data. |
 |
 |
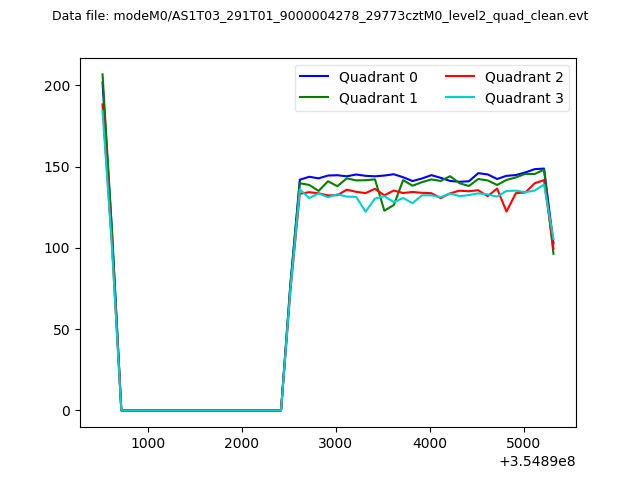
| Quadrant-wise count rates Data is divided into 100 sec bins |
 |
|
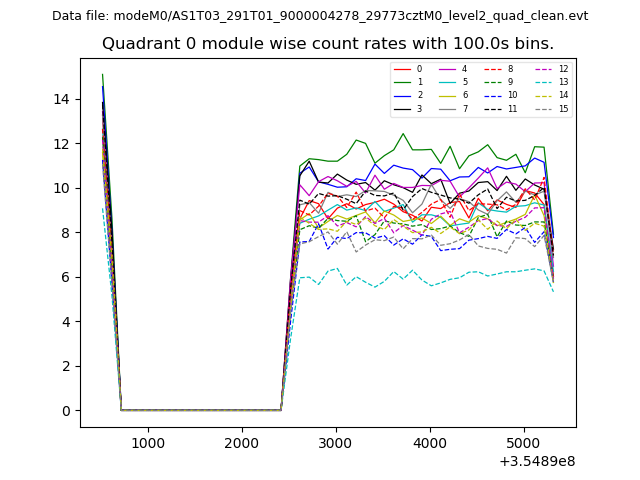
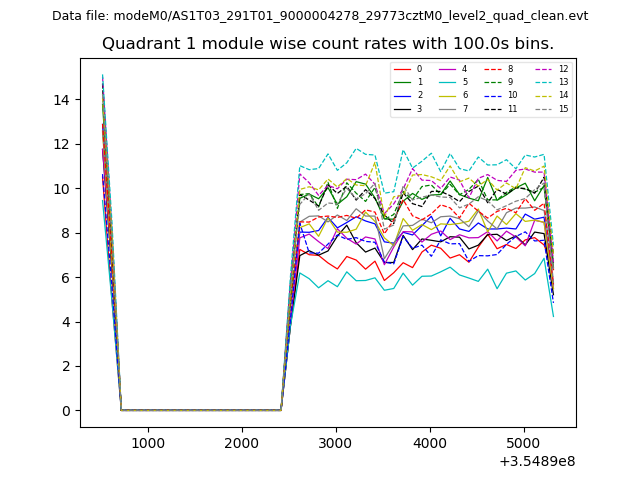
| Module-wise count rates for Quadrant A Data is divided into 100 sec bins |
 |
 |
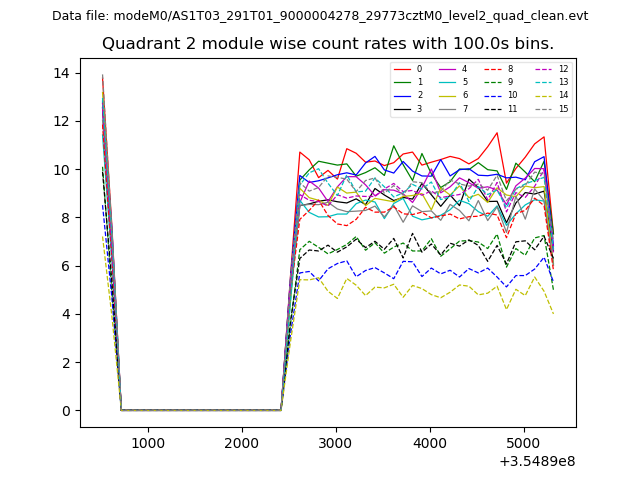
| Module-wise count rates for Quadrant B Data is divided into 100 sec bins |
 |
 |
| Module-wise count rates for Quadrant C Data is divided into 100 sec bins |
 |
 |
| Module-wise count rates for Quadrant D Data is divided into 100 sec bins |
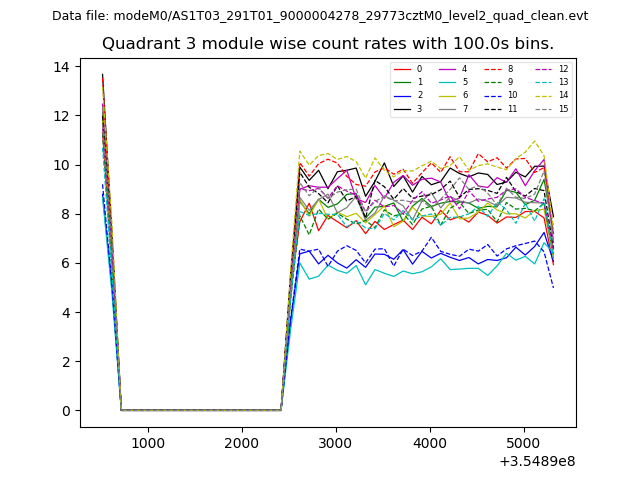 |
 |
| Parameter | Plot |
|---|---|
| CZT HV Monitor | 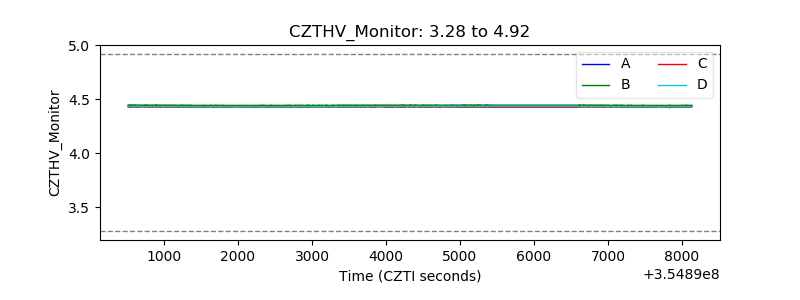 |
| D_VDD | 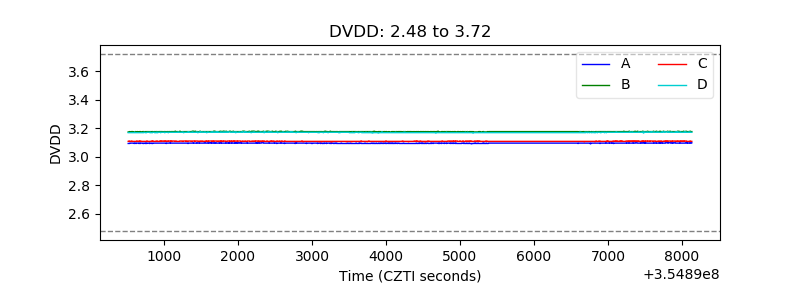 |
| Temperature 1 | 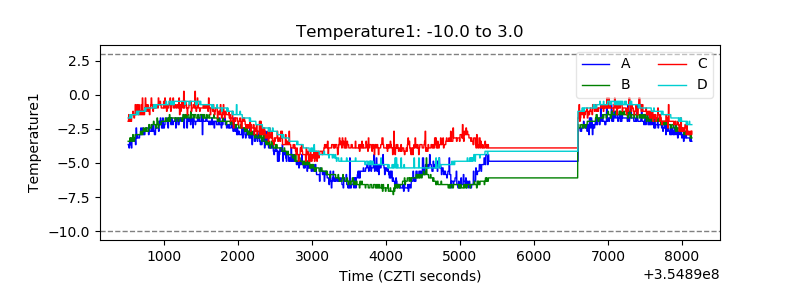 |
| Veto HV Monitor | 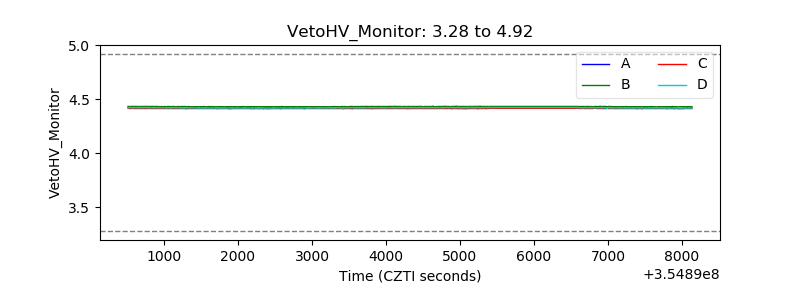 |
| Veto LLD | 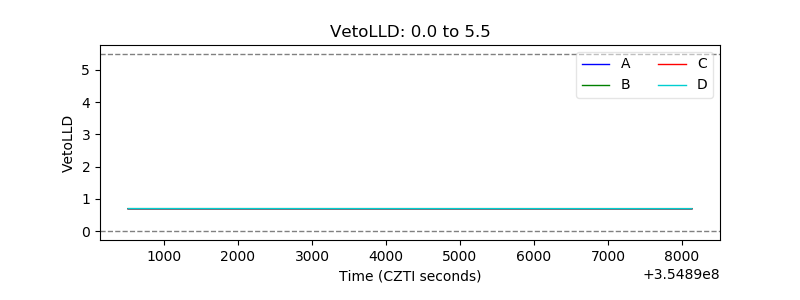 |
| Alpha Counter | 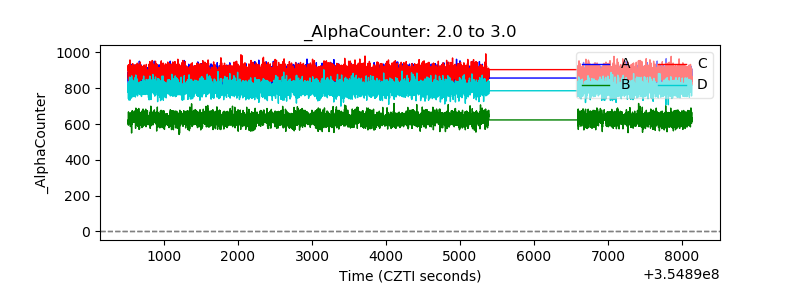 |
| _CPM_Rate | 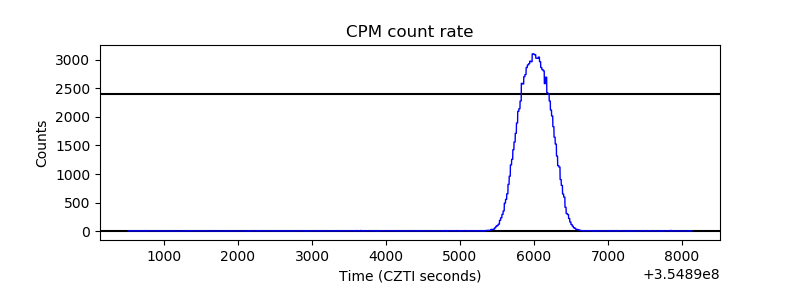 |
| CZT Counter | 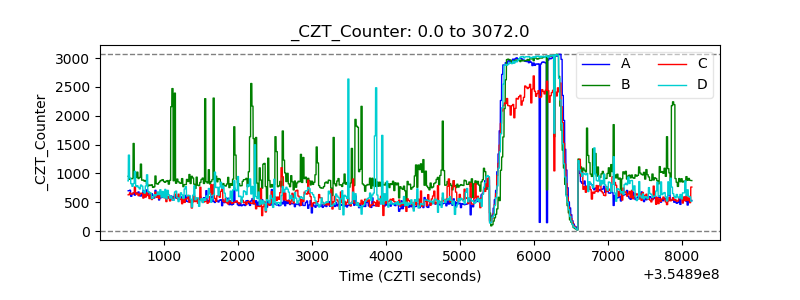 |
| +2.5 Volts monitor |  |
| +5 Volts monitor |  |
| _ROLL_ROT | 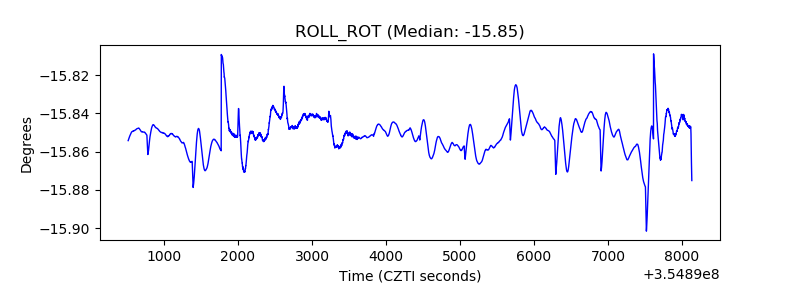 |
| _Roll_DEC | 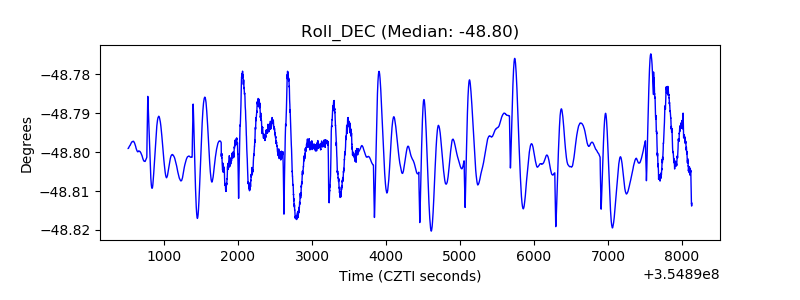 |
| _Roll_RA | 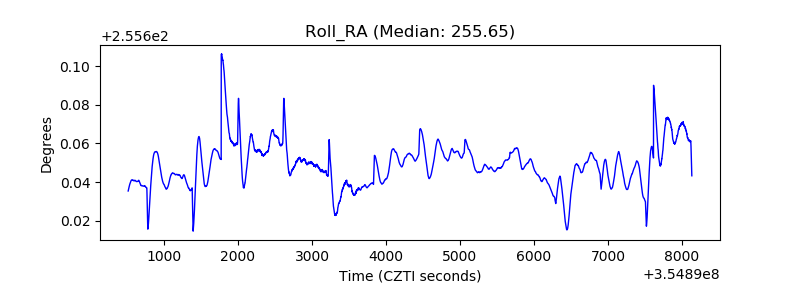 |
| Veto Counter | 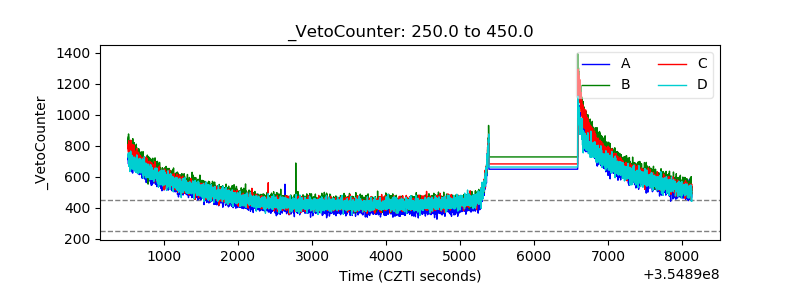 |