| Param | Original file | Final file |
|---|---|---|
| Filename | modeM0/AS1T03_291T01_9000004278_29774cztM0_level2.evt | modeM0/AS1T03_291T01_9000004278_29774cztM0_level2_quad_clean.evt |
| Size (bytes) | 544,423,680 | 75,648,960 |
| Size | 519.2 MB | 72.1 MB |
| Events in quadrant A | 3,315,512 | 489,738 |
| Events in quadrant B | 5,532,458 | 483,664 |
| Events in quadrant C | 3,545,339 | 446,961 |
| Events in quadrant D | 3,686,425 | 449,186 |
| Mode SS | |||
|---|---|---|---|
| Quadrant | BADHDUFLAG | Total packets | Discarded packets |
| A | 0 | 124 | 0 |
| B | 0 | 124 | 0 |
| C | 0 | 124 | 0 |
| D | 0 | 124 | 0 |
| Mode M0 | |||
|---|---|---|---|
| Quadrant | BADHDUFLAG | Total packets | Discarded packets |
| A | 0 | 13688 | 1 |
| B | 0 | 20451 | 1 |
| C | 0 | 14400 | 1 |
| D | 0 | 14849 | 1 |
| Mode M9 | |||
|---|---|---|---|
| Quadrant | BADHDUFLAG | Total packets | Discarded packets |
| A | 0 | 13 | 0 |
| B | 0 | 13 | 0 |
| C | 0 | 13 | 0 |
| D | 0 | 13 | 0 |
| Quadrant | Total seconds | Saturated seconds | Saturation percentage |
|---|---|---|---|
| A | 6025 | 96 | 1.593361% |
| B | 6025 | 250 | 4.149378% |
| C | 6025 | 321 | 5.327801% |
| D | 6025 | 91 | 1.510373% |
Noise dominated data is calculated using 1-second bins in cleaned event files. If a bin has >2000 counts, and if more than 50% of those come from <1% of pixels, then it is considered to be noise-dominated and hence unusable.
| Quadrant | # 1 sec bins | Bins with >0 counts | Bins with >2000 counts | High rate bins dominated by noise | Noise dominated (total time) | Noise dominated (detector-on time) | Marked lightcurve |
|---|---|---|---|---|---|---|---|
| A | 7330 | 6025 | 4 | 4 | 0.05% | 0.07% | 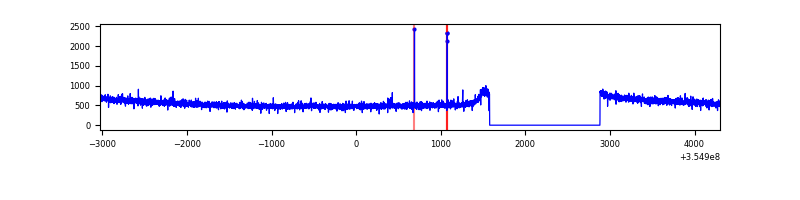 |
| B | 7330 | 6025 | 62 | 62 | 0.85% | 1.03% | 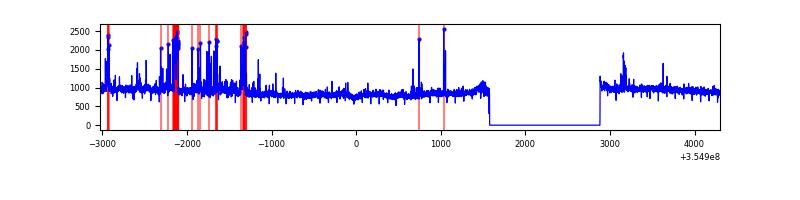 |
| C | 7330 | 6025 | 11 | 11 | 0.15% | 0.18% | 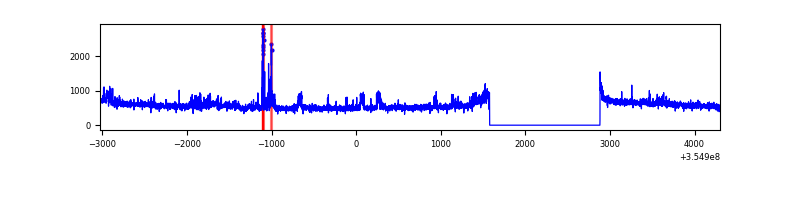 |
| D | 7330 | 6025 | 16 | 16 | 0.22% | 0.27% | 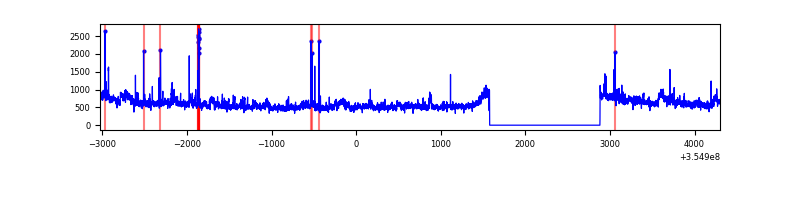 |
Top three noisy pixels from each quadrant. If the there are fewer than three noisy pixels in the level2.evt file, extra rows are filled as -1
| Pixel properties | Quadrant properties | ||||||
|---|---|---|---|---|---|---|---|
| Quadrant | DetID | PixID | Counts | Sigma | Mean | Median | Sigma |
| A | 12 | 96 | 16341 | 92.14 | 854 | 840 | 168.2 |
| A | 13 | 254 | 16115 | 90.8 | 854 | 840 | 168.2 |
| A | 3 | 137 | 7649 | 40.48 | 854 | 840 | 168.2 |
| B | 6 | 159 | 1841572 | 12017.82 | 839 | 824 | 153.2 |
| B | 0 | 229 | 346024 | 2253.73 | 839 | 824 | 153.2 |
| B | 5 | 255 | 37692 | 240.7 | 839 | 824 | 153.2 |
| C | 14 | 238 | 204794 | 1143.1 | 784 | 792 | 178.5 |
| C | 3 | 233 | 107666 | 598.85 | 784 | 792 | 178.5 |
| C | 14 | 254 | 104344 | 580.24 | 784 | 792 | 178.5 |
| D | 8 | 195 | 518162 | 2758.09 | 805 | 786 | 187.6 |
| D | 2 | 250 | 46001 | 241.04 | 805 | 786 | 187.6 |
| D | 7 | 80 | 36803 | 192.0 | 805 | 786 | 187.6 |
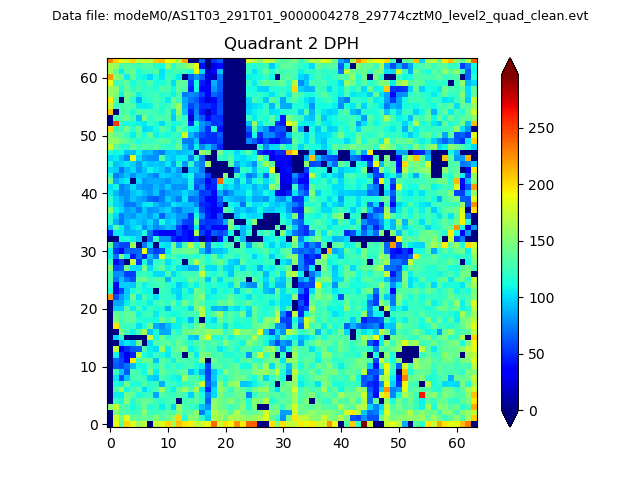
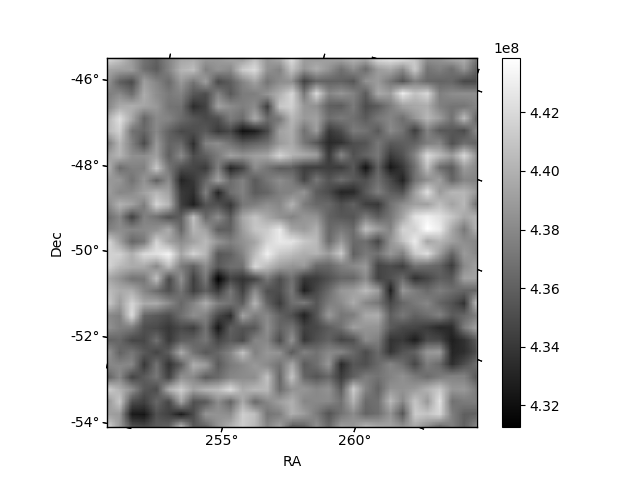
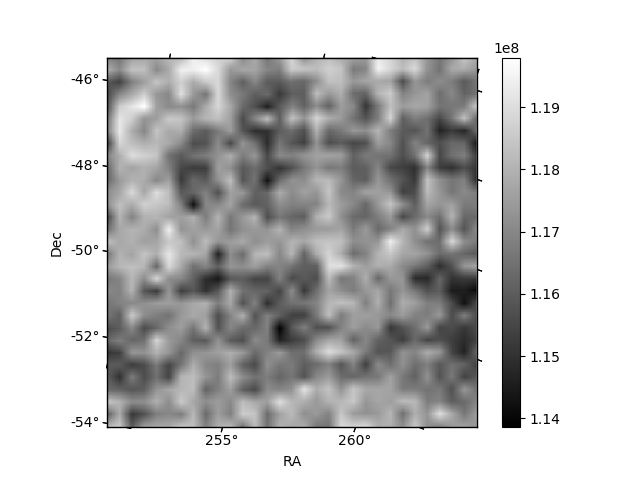
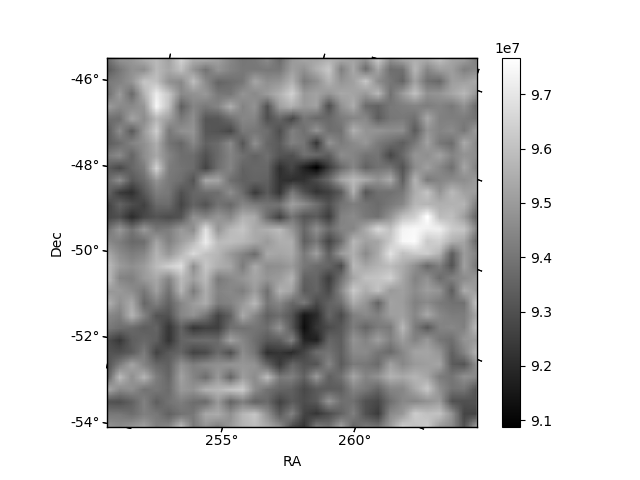
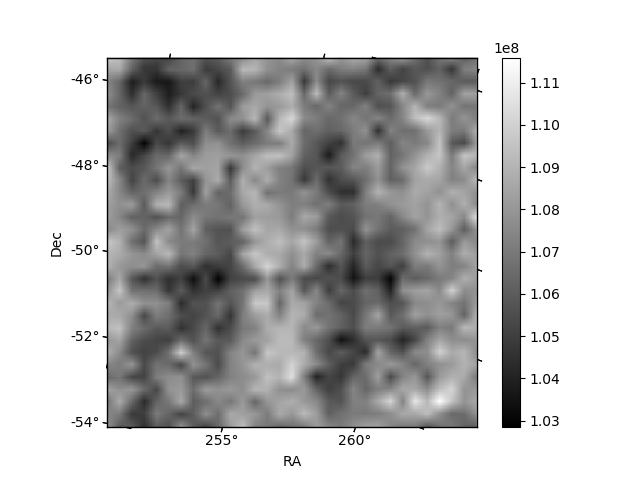
Histogram calculated using DETX and DETY for each event in the final _common_clean file
| Quadrant A | 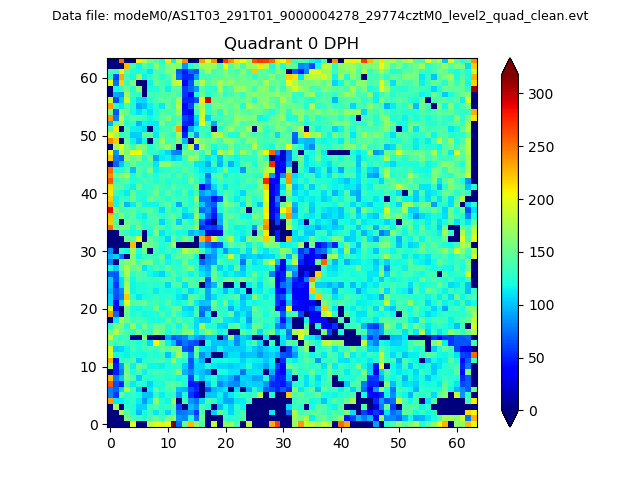 |
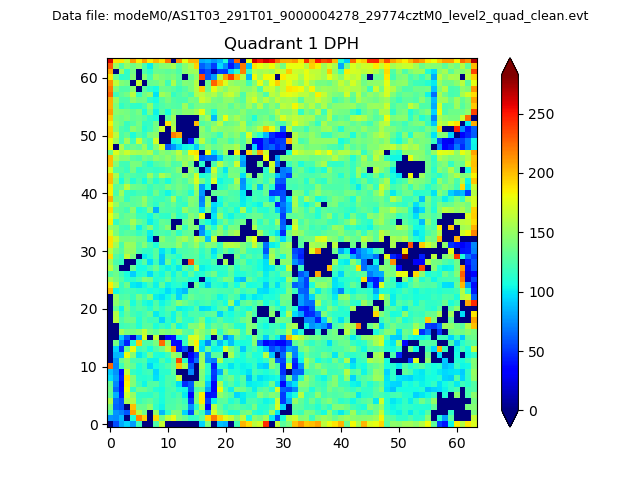 |
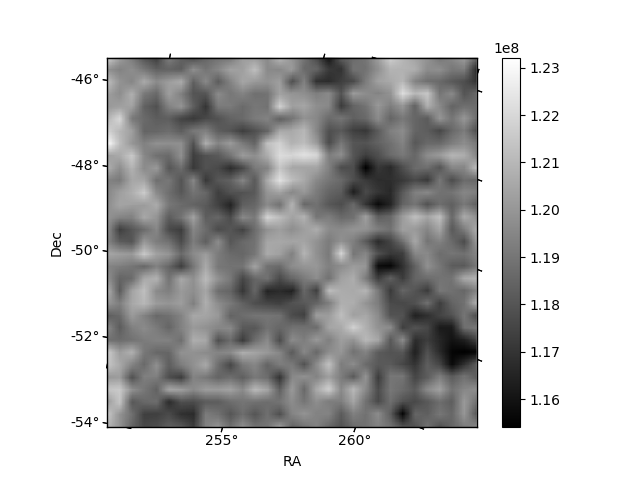
Quadrant B |
|---|---|---|---|
| Quadrant D | 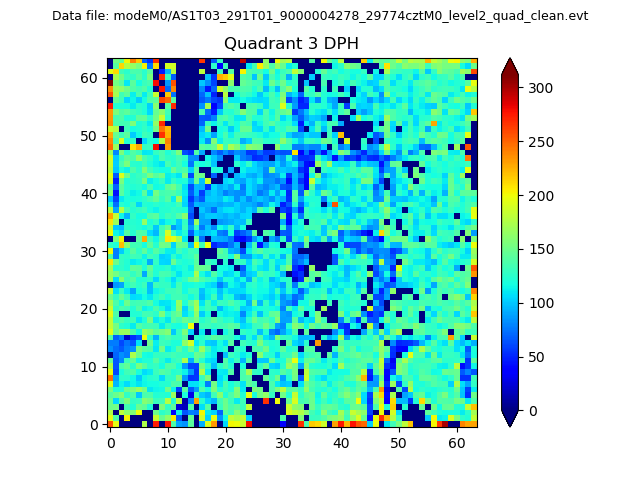 |
 |
Quadrant C |
| Plot type | Count rate plots | Images |
|---|---|---|
| Comparison with Poisson distribution Blue bars denote a histogram of data divided into 1 sec bins. Red curve is a Poisson curve with rate = median count rate of data. |
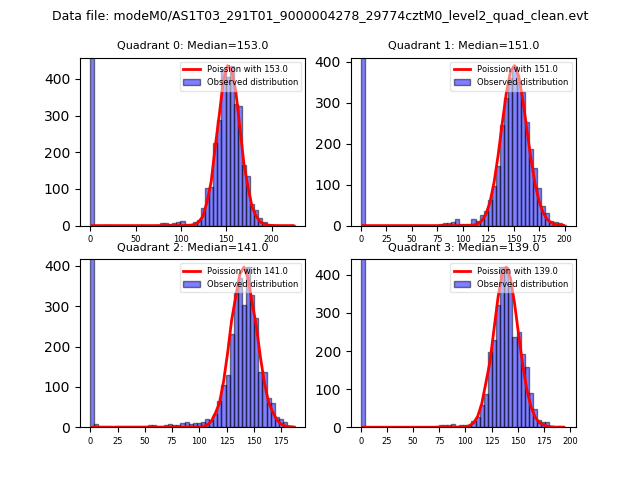 |
 |
| Quadrant-wise count rates Data is divided into 100 sec bins |
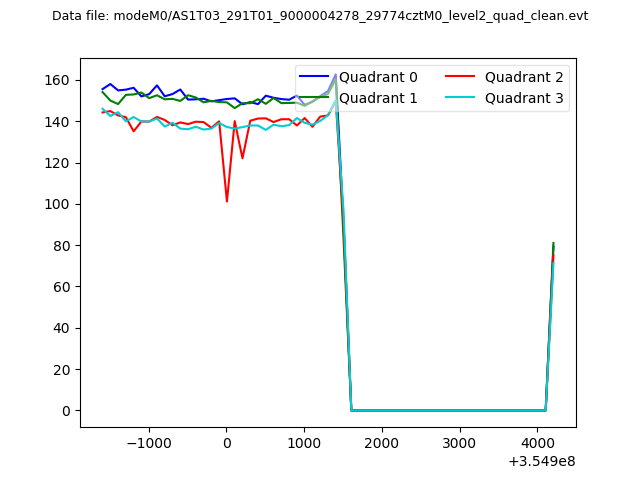 |
|
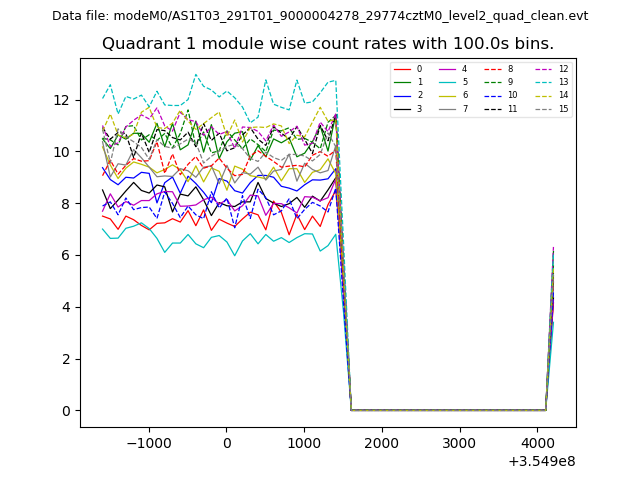
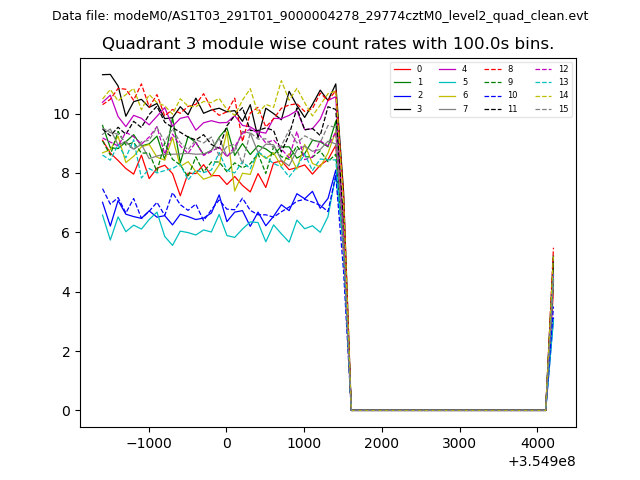
| Module-wise count rates for Quadrant A Data is divided into 100 sec bins |
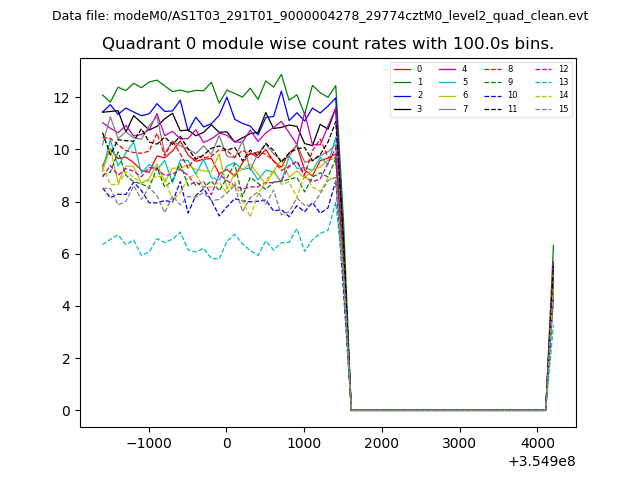 |
 |
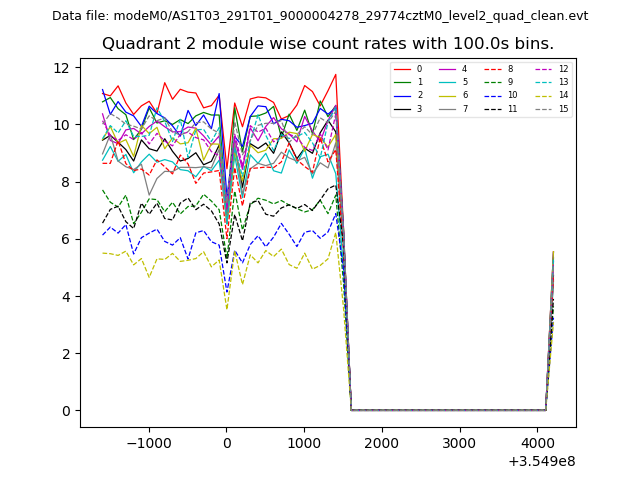
| Module-wise count rates for Quadrant B Data is divided into 100 sec bins |
 |
 |
| Module-wise count rates for Quadrant C Data is divided into 100 sec bins |
 |
 |
| Module-wise count rates for Quadrant D Data is divided into 100 sec bins |
 |
 |
| Parameter | Plot |
|---|---|
| CZT HV Monitor | 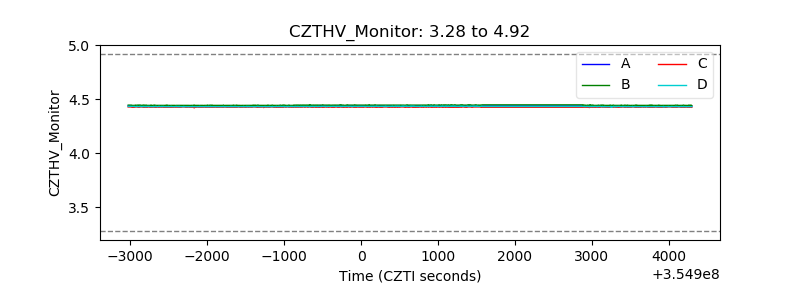 |
| D_VDD | 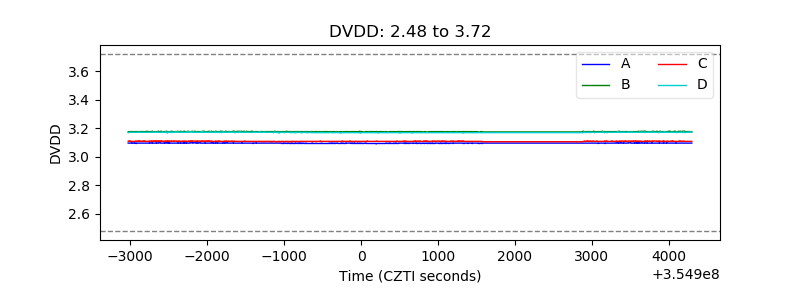 |
| Temperature 1 | 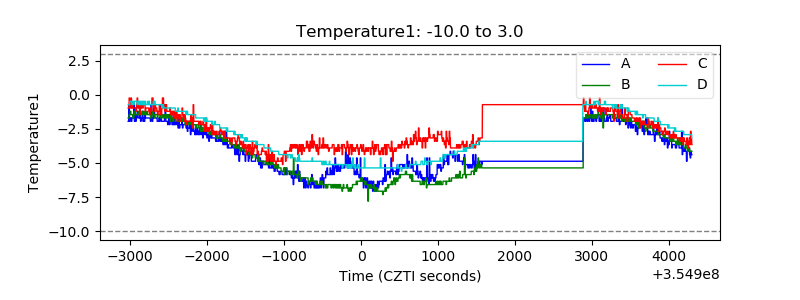 |
| Veto HV Monitor | 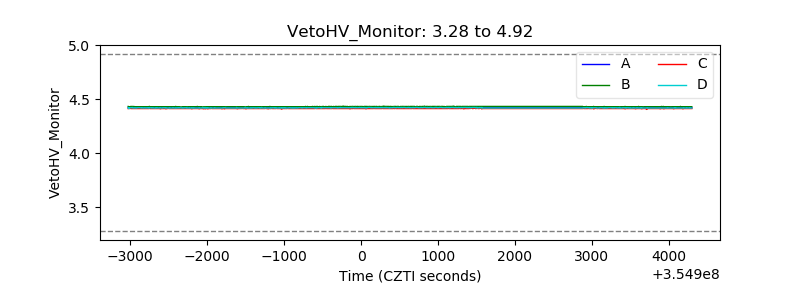 |
| Veto LLD | 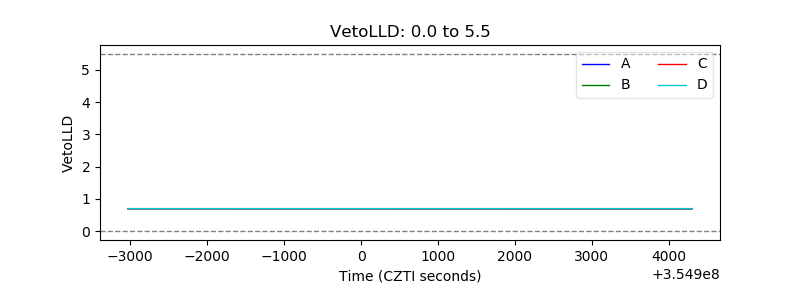 |
| Alpha Counter | 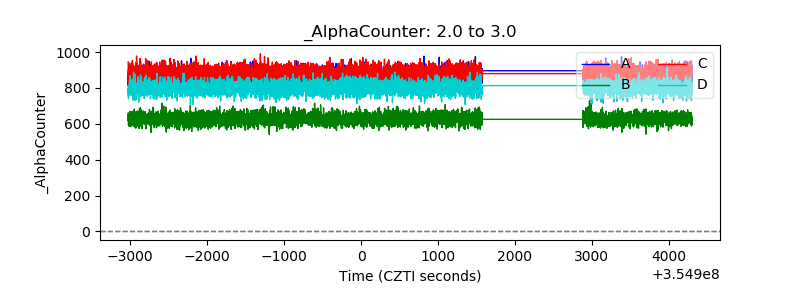 |
| _CPM_Rate | 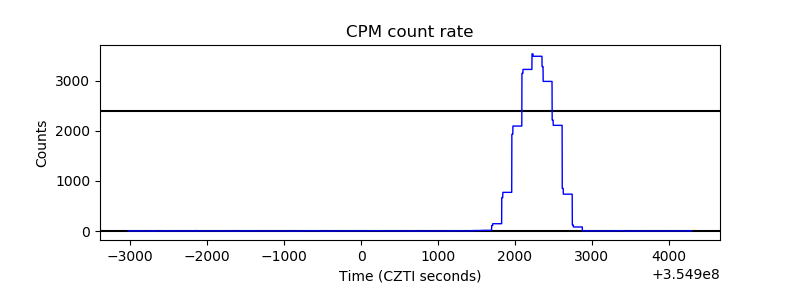 |
| CZT Counter | 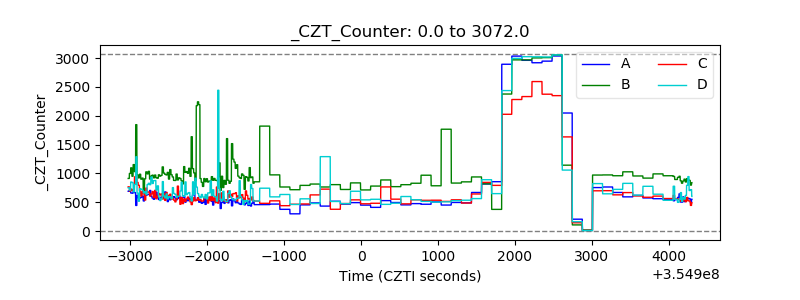 |
| +2.5 Volts monitor |  |
| +5 Volts monitor | 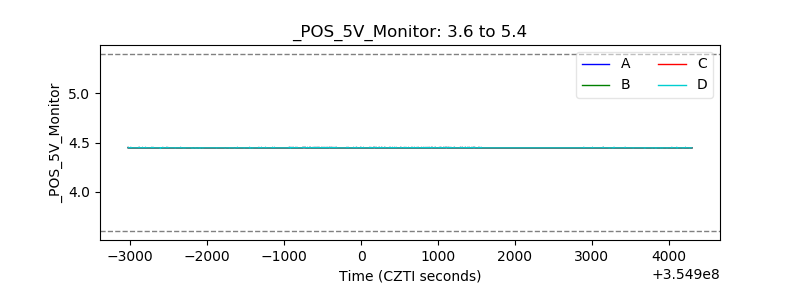 |
| _ROLL_ROT | 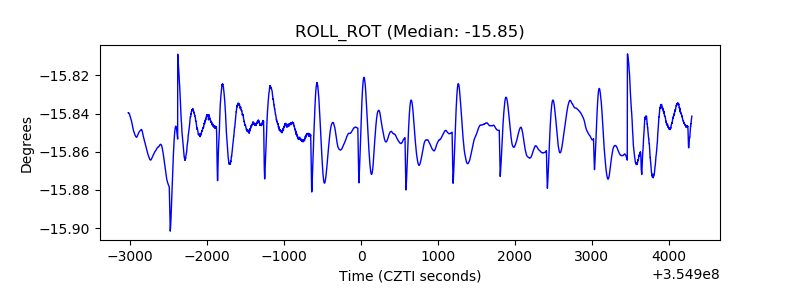 |
| _Roll_DEC | 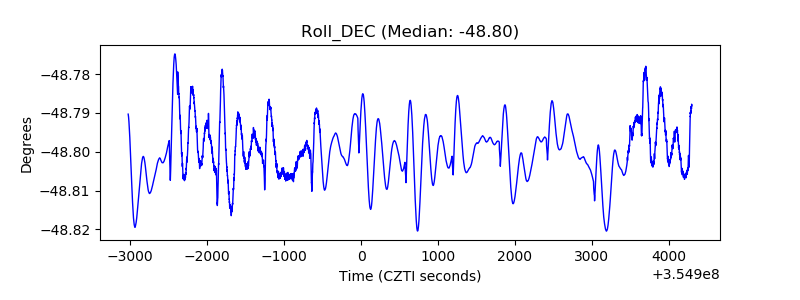 |
| _Roll_RA | 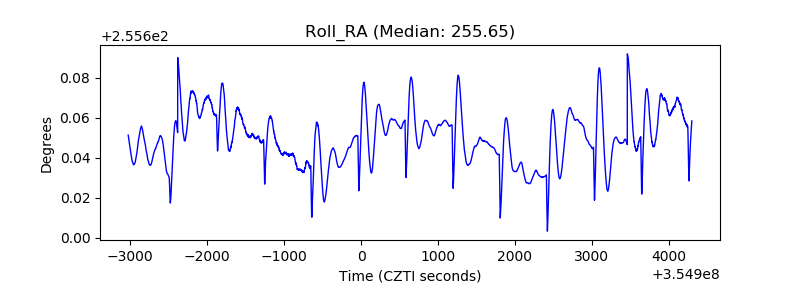 |
| Veto Counter | 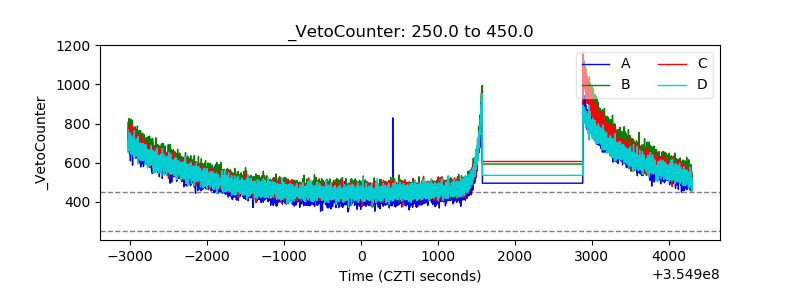 |