| Param | Original file | Final file |
|---|---|---|
| Filename | modeM0/AS1T03_291T01_9000004278_29777cztM0_level2.evt | modeM0/AS1T03_291T01_9000004278_29777cztM0_level2_quad_clean.evt |
| Size (bytes) | 538,462,080 | 111,329,280 |
| Size | 513.5 MB | 106.2 MB |
| Events in quadrant A | 3,321,483 | 750,375 |
| Events in quadrant B | 5,505,947 | 753,902 |
| Events in quadrant C | 3,419,109 | 710,136 |
| Events in quadrant D | 3,610,040 | 693,481 |
| Mode SS | |||
|---|---|---|---|
| Quadrant | BADHDUFLAG | Total packets | Discarded packets |
| A | 0 | 138 | 0 |
| B | 0 | 138 | 0 |
| C | 0 | 138 | 0 |
| D | 0 | 138 | 0 |
| Mode M0 | |||
|---|---|---|---|
| Quadrant | BADHDUFLAG | Total packets | Discarded packets |
| A | 0 | 13965 | 2 |
| B | 0 | 20767 | 2 |
| C | 0 | 14132 | 2 |
| D | 0 | 14798 | 2 |
| Mode M9 | |||
|---|---|---|---|
| Quadrant | BADHDUFLAG | Total packets | Discarded packets |
| A | 0 | 23 | 0 |
| B | 0 | 23 | 0 |
| C | 0 | 23 | 0 |
| D | 0 | 23 | 0 |
| Quadrant | Total seconds | Saturated seconds | Saturation percentage |
|---|---|---|---|
| A | 6650 | 66 | 0.992481% |
| B | 6650 | 187 | 2.812030% |
| C | 6651 | 101 | 1.518569% |
| D | 6651 | 49 | 0.736731% |
Noise dominated data is calculated using 1-second bins in cleaned event files. If a bin has >2000 counts, and if more than 50% of those come from <1% of pixels, then it is considered to be noise-dominated and hence unusable.
| Quadrant | # 1 sec bins | Bins with >0 counts | Bins with >2000 counts | High rate bins dominated by noise | Noise dominated (total time) | Noise dominated (detector-on time) | Marked lightcurve |
|---|---|---|---|---|---|---|---|
| A | 9020 | 6651 | 0 | 0 | 0.00% | 0.00% | 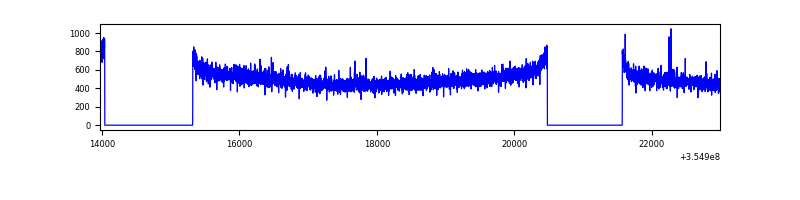 |
| B | 9020 | 6651 | 2 | 2 | 0.02% | 0.03% | 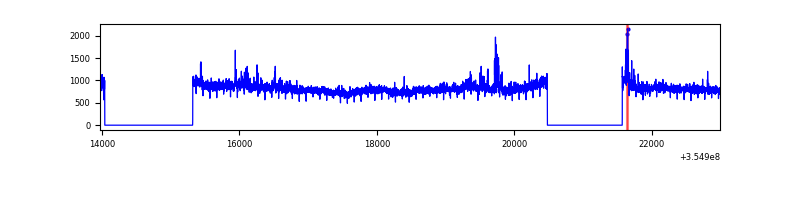 |
| C | 9021 | 6652 | 0 | 0 | 0.00% | 0.00% | 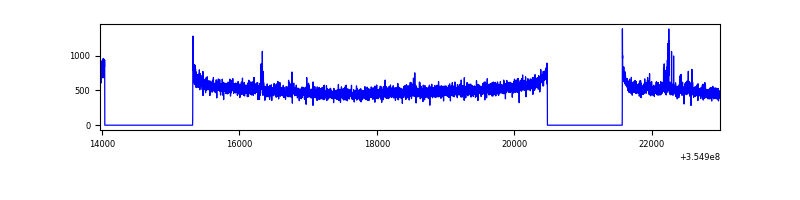 |
| D | 9021 | 6652 | 15 | 15 | 0.17% | 0.23% | 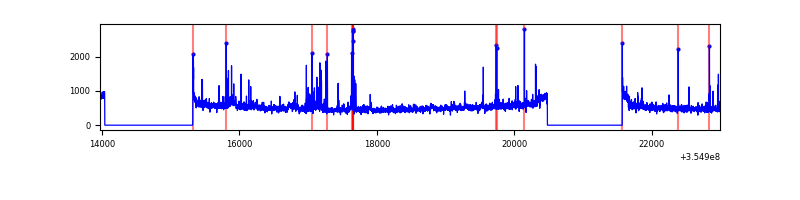 |
Top three noisy pixels from each quadrant. If the there are fewer than three noisy pixels in the level2.evt file, extra rows are filled as -1
| Pixel properties | Quadrant properties | ||||||
|---|---|---|---|---|---|---|---|
| Quadrant | DetID | PixID | Counts | Sigma | Mean | Median | Sigma |
| A | 13 | 254 | 16088 | 89.53 | 857 | 841 | 170.3 |
| A | 3 | 137 | 8208 | 43.26 | 857 | 841 | 170.3 |
| A | 0 | 226 | 7246 | 37.61 | 857 | 841 | 170.3 |
| B | 6 | 159 | 1971494 | 12296.97 | 853 | 834 | 160.3 |
| B | 0 | 229 | 119263 | 739.0 | 853 | 834 | 160.3 |
| B | 15 | 33 | 34973 | 213.03 | 853 | 834 | 160.3 |
| C | 14 | 238 | 134797 | 709.29 | 817 | 821 | 188.9 |
| C | 3 | 233 | 61664 | 322.11 | 817 | 821 | 188.9 |
| C | 10 | 22 | 21830 | 111.22 | 817 | 821 | 188.9 |
| D | 8 | 195 | 340222 | 1768.01 | 817 | 795 | 192.0 |
| D | 2 | 250 | 102991 | 532.32 | 817 | 795 | 192.0 |
| D | 2 | 234 | 28521 | 144.42 | 817 | 795 | 192.0 |
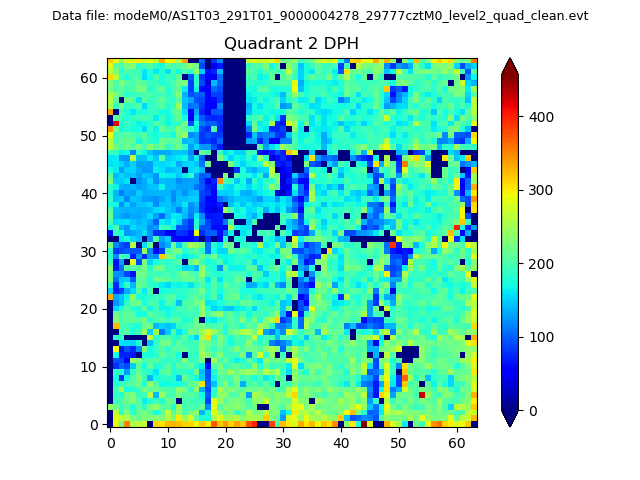
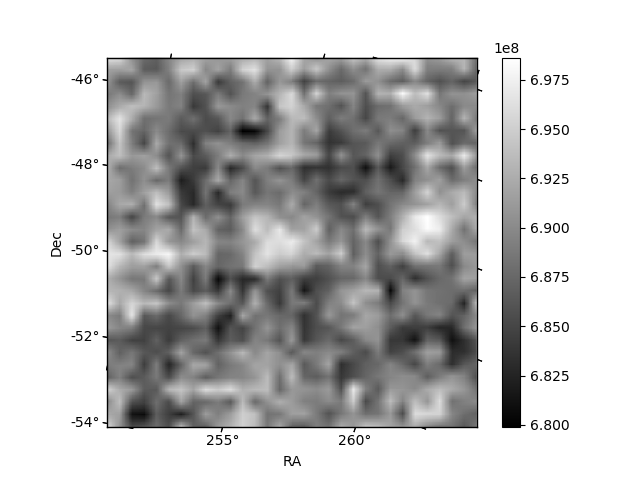
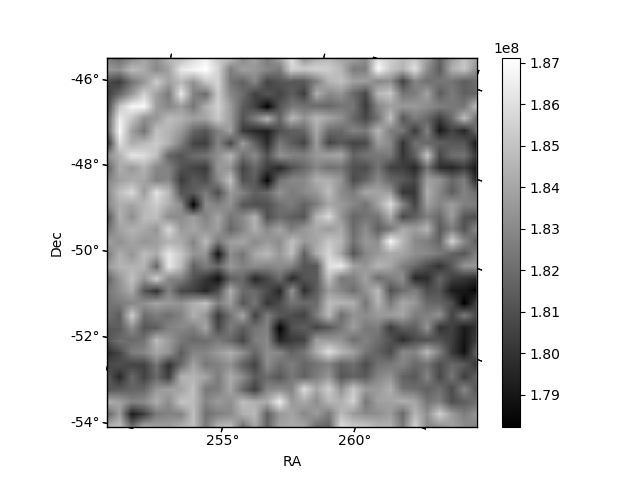
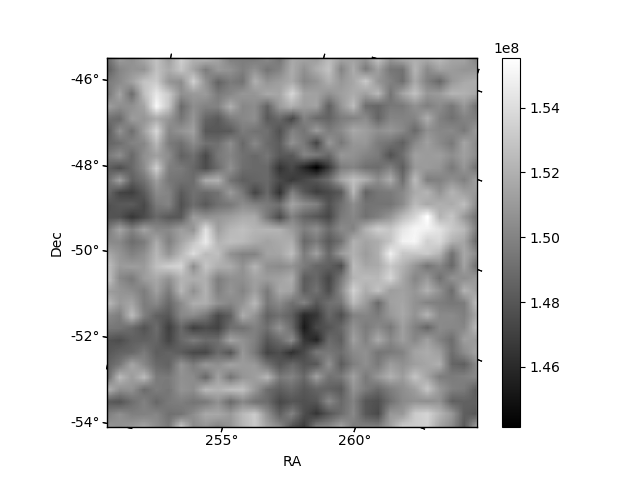
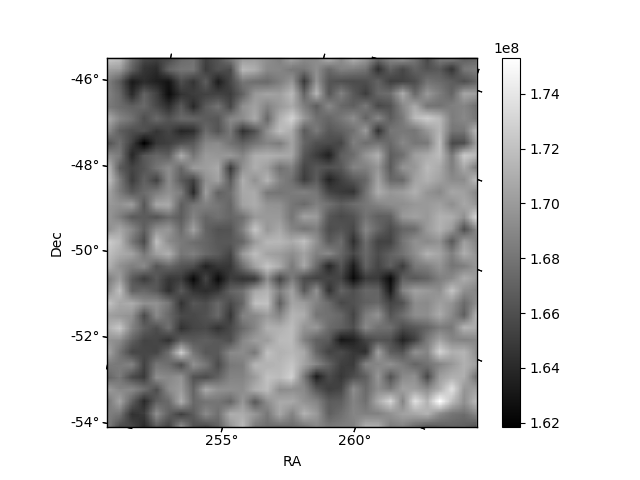
Histogram calculated using DETX and DETY for each event in the final _common_clean file
| Quadrant A | 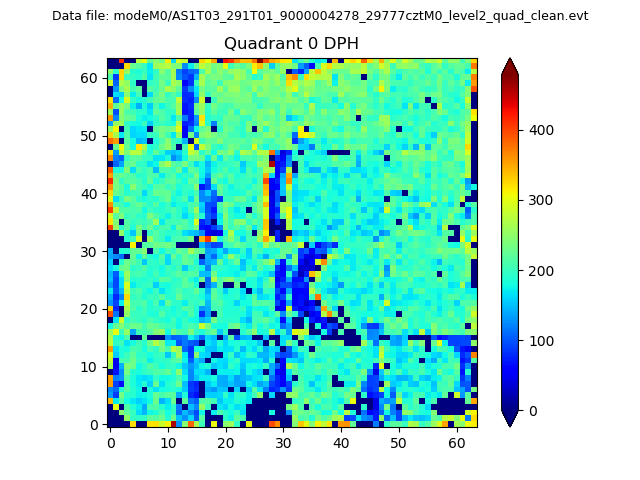 |
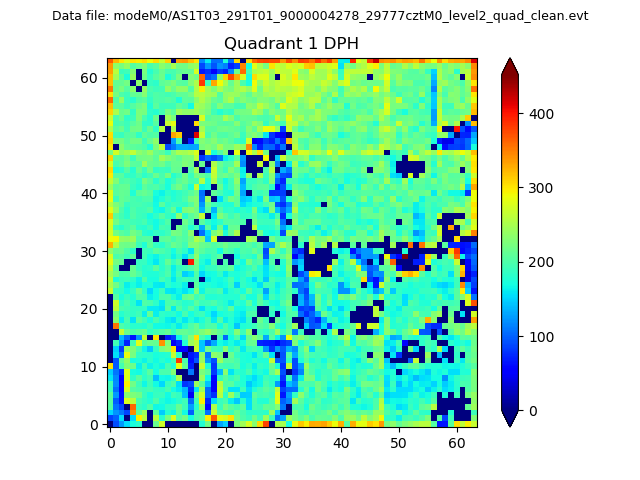 |
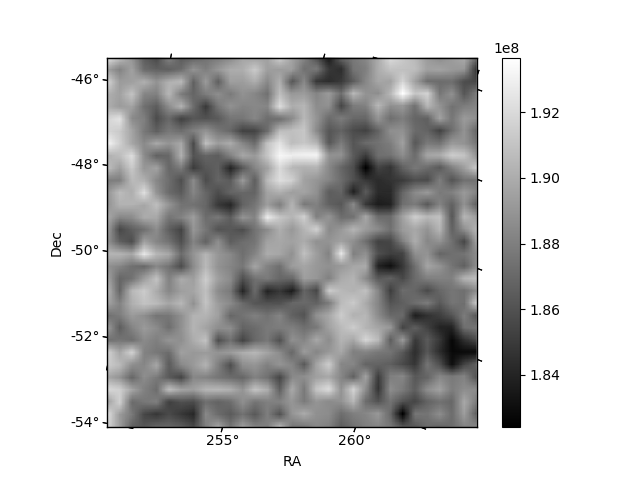
Quadrant B |
|---|---|---|---|
| Quadrant D | 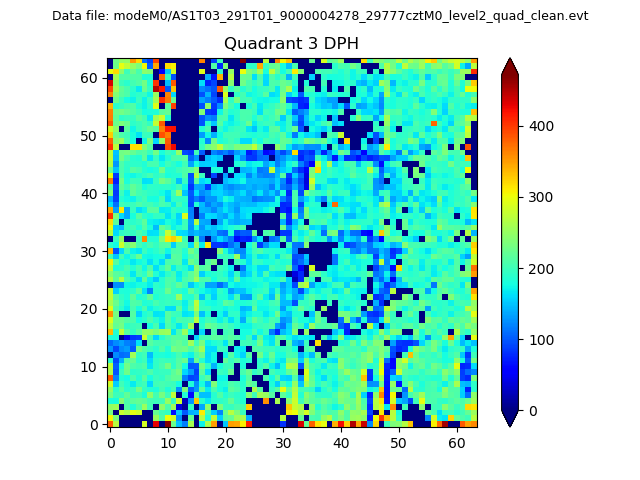 |
 |
Quadrant C |
| Plot type | Count rate plots | Images |
|---|---|---|
| Comparison with Poisson distribution Blue bars denote a histogram of data divided into 1 sec bins. Red curve is a Poisson curve with rate = median count rate of data. |
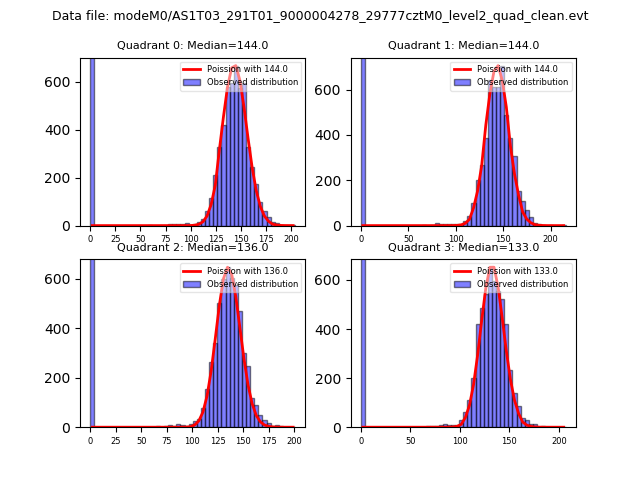 |
 |
| Quadrant-wise count rates Data is divided into 100 sec bins |
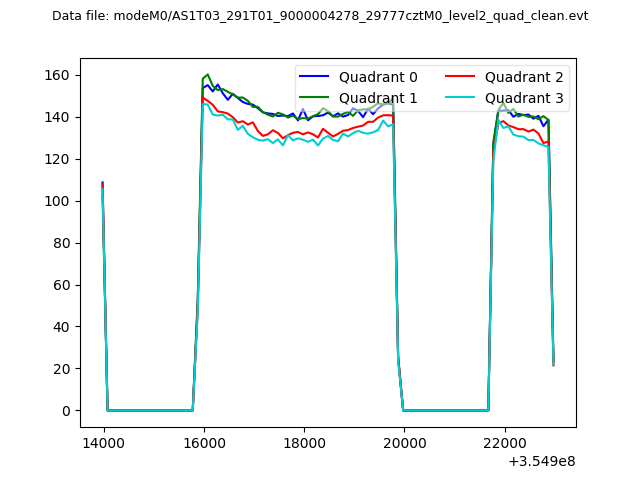 |
|
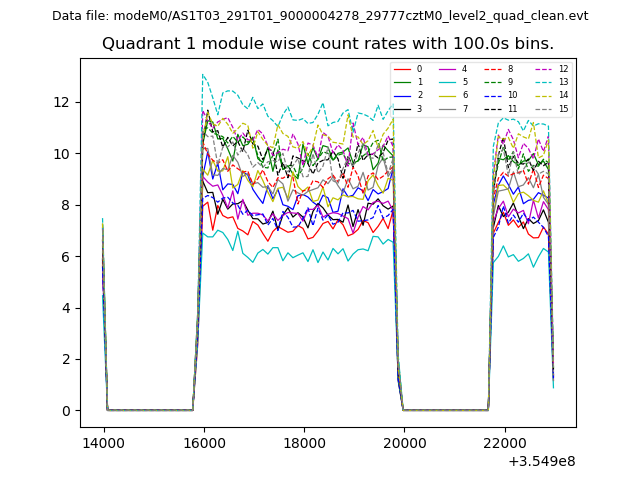
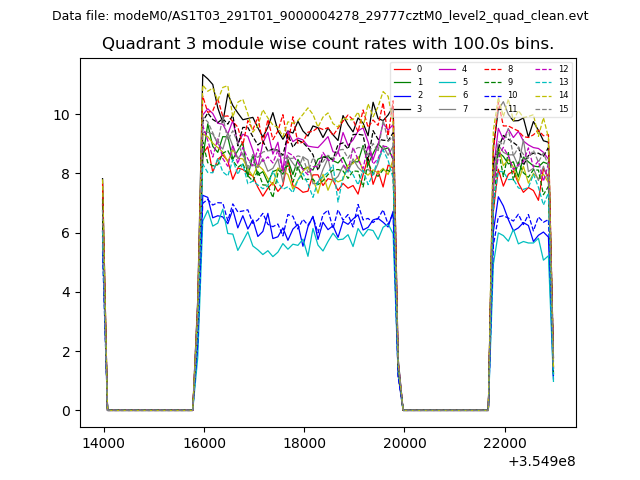
| Module-wise count rates for Quadrant A Data is divided into 100 sec bins |
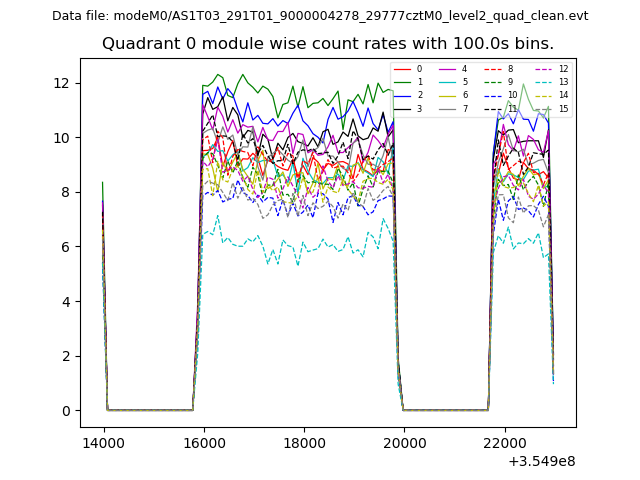 |
 |
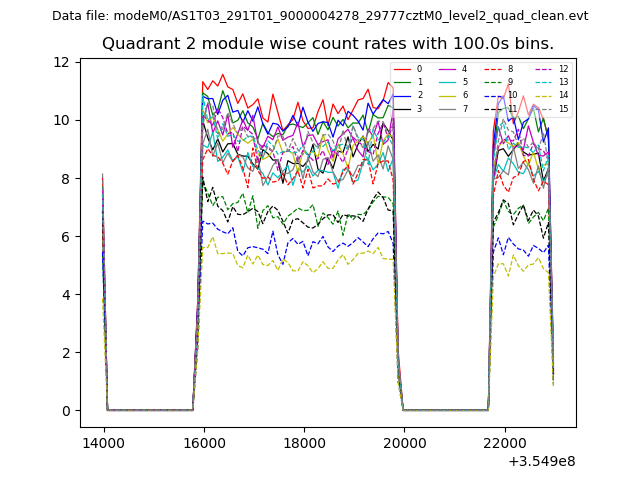
| Module-wise count rates for Quadrant B Data is divided into 100 sec bins |
 |
 |
| Module-wise count rates for Quadrant C Data is divided into 100 sec bins |
 |
 |
| Module-wise count rates for Quadrant D Data is divided into 100 sec bins |
 |
 |
| Parameter | Plot |
|---|---|
| CZT HV Monitor | 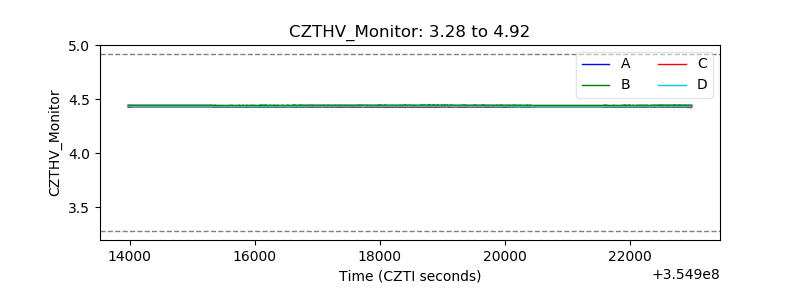 |
| D_VDD | 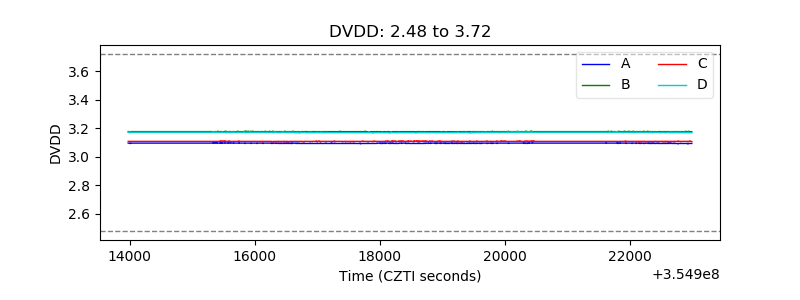 |
| Temperature 1 | 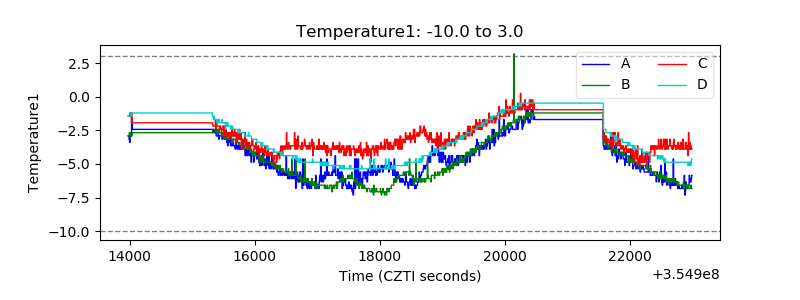 |
| Veto HV Monitor |  |
| Veto LLD | 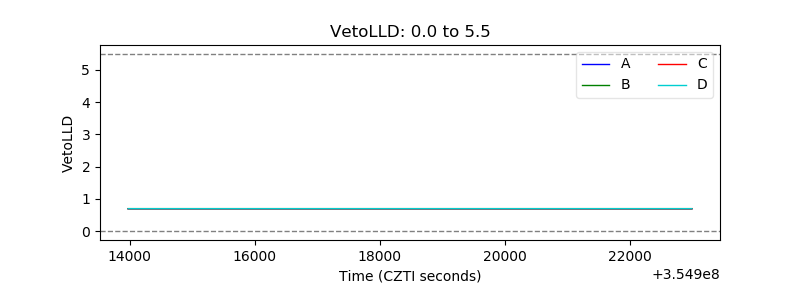 |
| Alpha Counter | 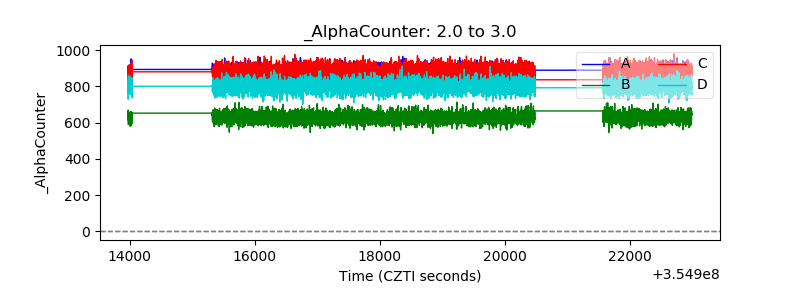 |
| _CPM_Rate | 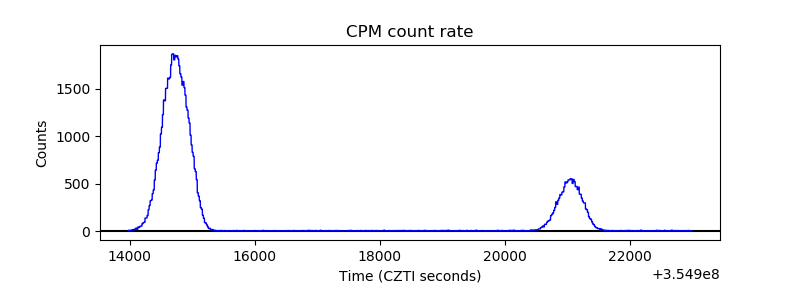 |
| CZT Counter | 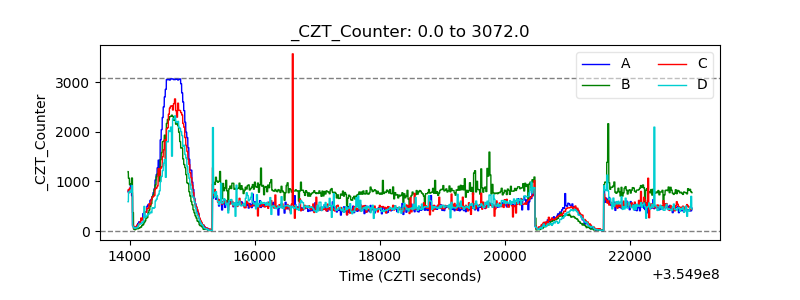 |
| +2.5 Volts monitor |  |
| +5 Volts monitor | 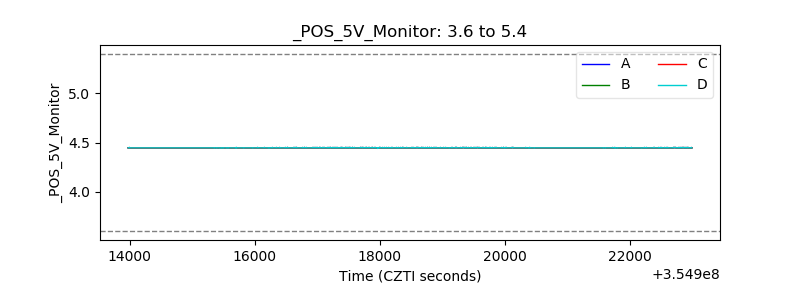 |
| _ROLL_ROT |  |
| _Roll_DEC | 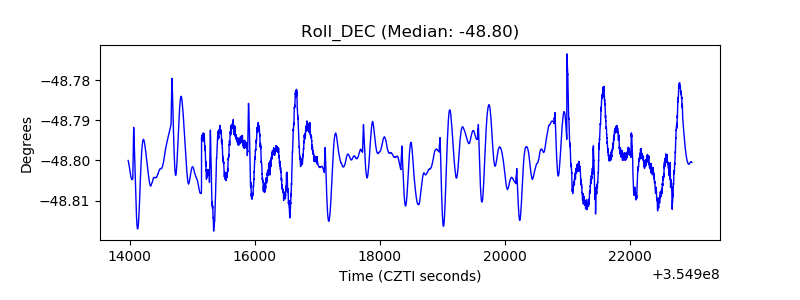 |
| _Roll_RA | 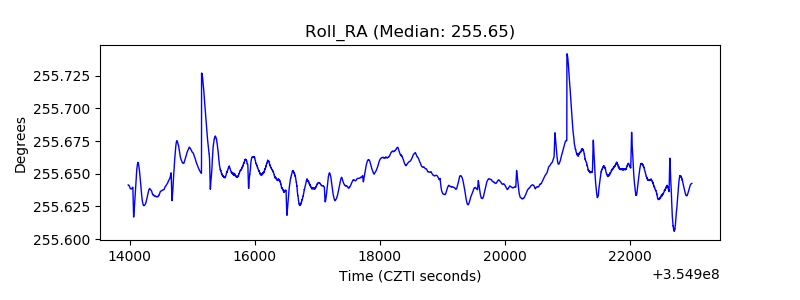 |
| Veto Counter |  |