| Param | Original file | Final file |
|---|---|---|
| Filename | modeM0/AS1T03_291T01_9000004278_29779cztM0_level2.evt | modeM0/AS1T03_291T01_9000004278_29779cztM0_level2_quad_clean.evt |
| Size (bytes) | 595,022,400 | 112,999,680 |
| Size | 567.5 MB | 107.8 MB |
| Events in quadrant A | 3,757,798 | 740,794 |
| Events in quadrant B | 6,007,909 | 745,533 |
| Events in quadrant C | 3,727,788 | 715,815 |
| Events in quadrant D | 4,016,468 | 695,989 |
| Mode SS | |||
|---|---|---|---|
| Quadrant | BADHDUFLAG | Total packets | Discarded packets |
| A | 0 | 154 | 0 |
| B | 0 | 154 | 0 |
| C | 0 | 154 | 0 |
| D | 0 | 154 | 0 |
| Mode M0 | |||
|---|---|---|---|
| Quadrant | BADHDUFLAG | Total packets | Discarded packets |
| A | 0 | 16107 | 2 |
| B | 0 | 23084 | 2 |
| C | 0 | 15712 | 2 |
| D | 0 | 16572 | 2 |
| Mode M9 | |||
|---|---|---|---|
| Quadrant | BADHDUFLAG | Total packets | Discarded packets |
| A | 0 | 3 | 0 |
| B | 0 | 3 | 0 |
| C | 0 | 3 | 0 |
| D | 0 | 3 | 0 |
| Quadrant | Total seconds | Saturated seconds | Saturation percentage |
|---|---|---|---|
| A | 7535 | 93 | 1.234240% |
| B | 7535 | 175 | 2.322495% |
| C | 7535 | 119 | 1.579297% |
| D | 7535 | 31 | 0.411413% |
Noise dominated data is calculated using 1-second bins in cleaned event files. If a bin has >2000 counts, and if more than 50% of those come from <1% of pixels, then it is considered to be noise-dominated and hence unusable.
| Quadrant | # 1 sec bins | Bins with >0 counts | Bins with >2000 counts | High rate bins dominated by noise | Noise dominated (total time) | Noise dominated (detector-on time) | Marked lightcurve |
|---|---|---|---|---|---|---|---|
| A | 7805 | 7537 | 54 | 54 | 0.69% | 0.72% | 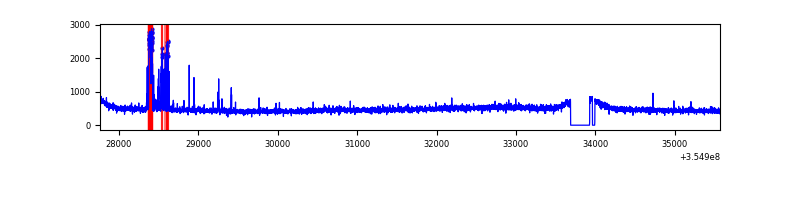 |
| B | 7805 | 7537 | 5 | 5 | 0.06% | 0.07% | 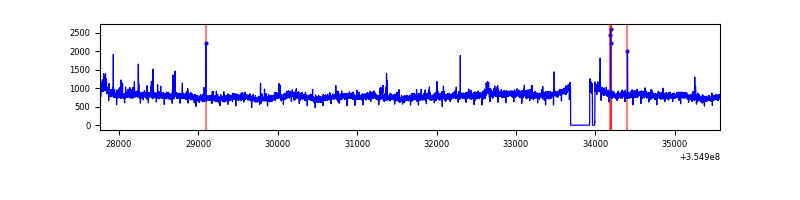 |
| C | 7805 | 7537 | 0 | 0 | 0.00% | 0.00% | 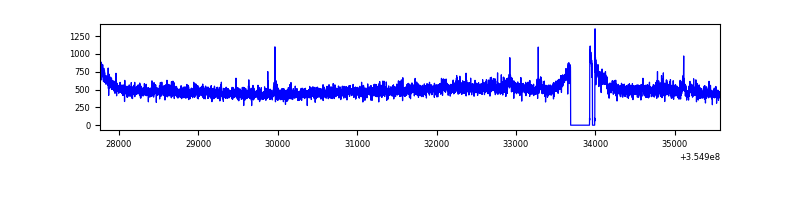 |
| D | 7805 | 7537 | 9 | 9 | 0.12% | 0.12% | 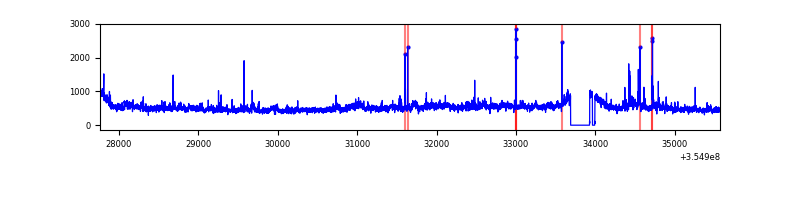 |
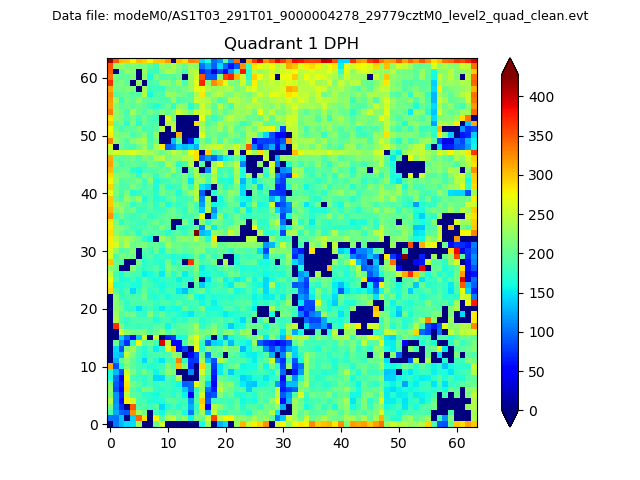
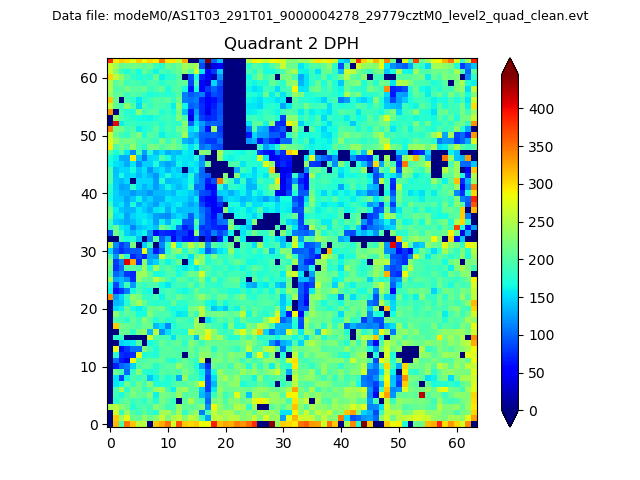
Top three noisy pixels from each quadrant. If the there are fewer than three noisy pixels in the level2.evt file, extra rows are filled as -1
| Pixel properties | Quadrant properties | ||||||
|---|---|---|---|---|---|---|---|
| Quadrant | DetID | PixID | Counts | Sigma | Mean | Median | Sigma |
| A | 12 | 96 | 211017 | 1137.09 | 918 | 899 | 184.8 |
| A | 13 | 254 | 17005 | 87.16 | 918 | 899 | 184.8 |
| A | 3 | 137 | 9418 | 46.1 | 918 | 899 | 184.8 |
| B | 6 | 159 | 2258048 | 12846.31 | 916 | 893 | 175.7 |
| B | 0 | 229 | 111080 | 627.12 | 916 | 893 | 175.7 |
| B | 12 | 111 | 21819 | 119.1 | 916 | 893 | 175.7 |
| C | 14 | 238 | 147192 | 710.39 | 886 | 891 | 205.9 |
| C | 3 | 233 | 98972 | 476.25 | 886 | 891 | 205.9 |
| C | 2 | 114 | 18195 | 84.02 | 886 | 891 | 205.9 |
| D | 8 | 195 | 567417 | 2657.36 | 890 | 864 | 213.2 |
| D | 2 | 250 | 34026 | 155.54 | 890 | 864 | 213.2 |
| D | 2 | 234 | 33006 | 150.76 | 890 | 864 | 213.2 |
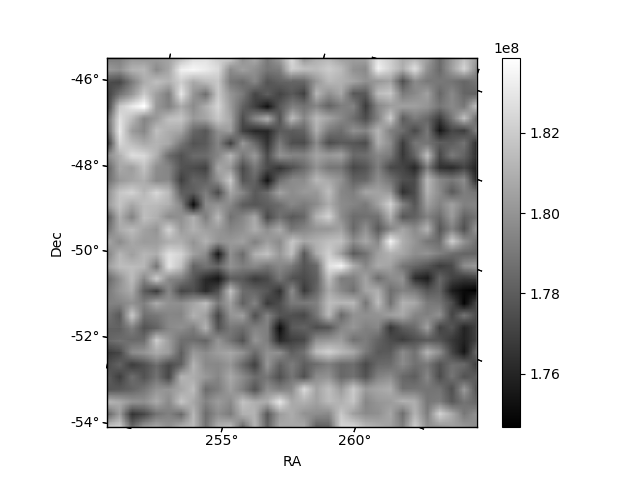
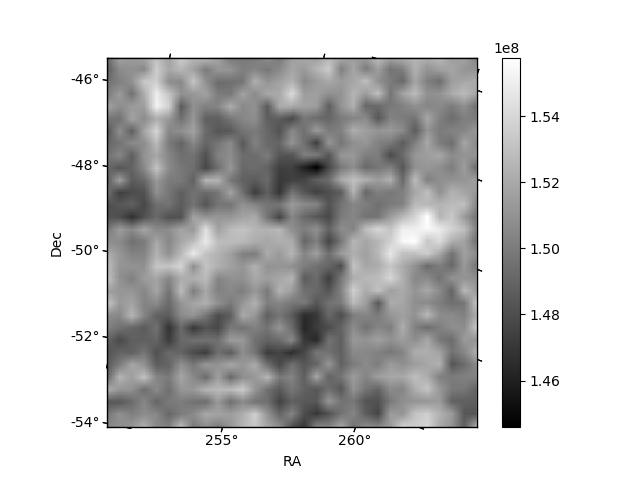
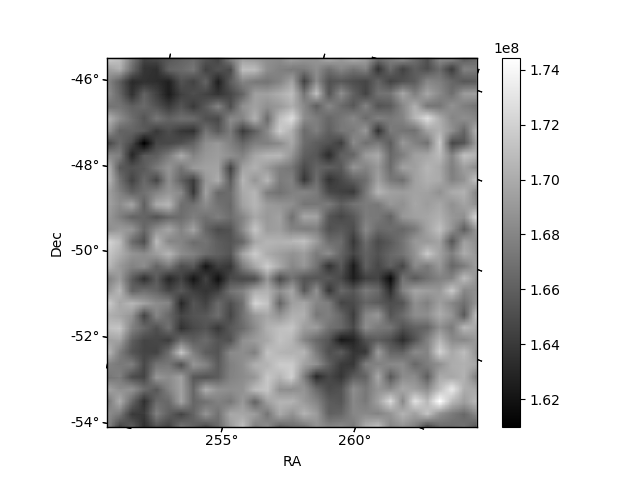
Histogram calculated using DETX and DETY for each event in the final _common_clean file
| Quadrant A | 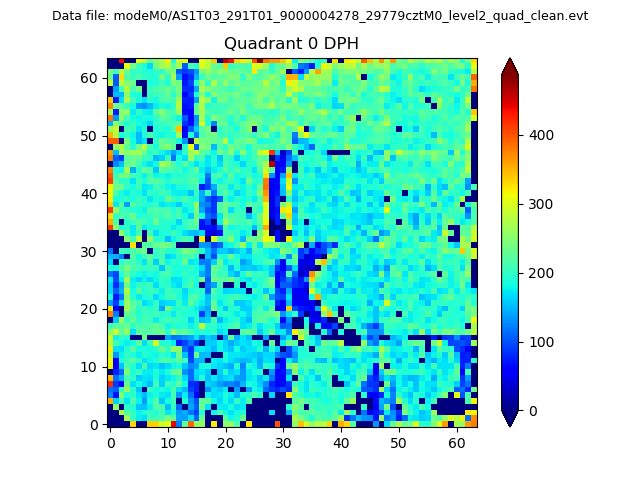 |
 |
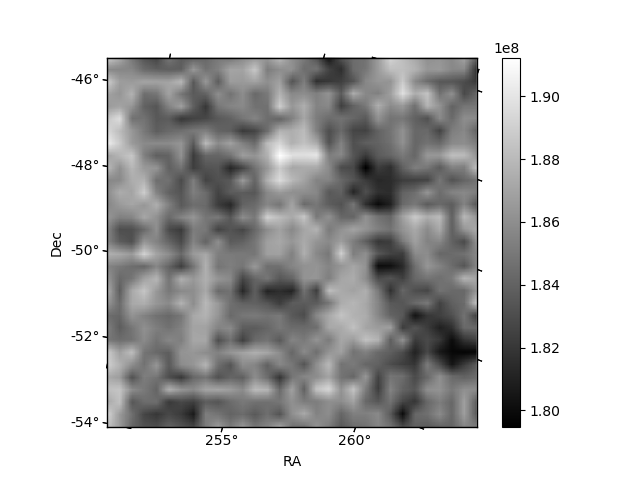
Quadrant B |
|---|---|---|---|
| Quadrant D | 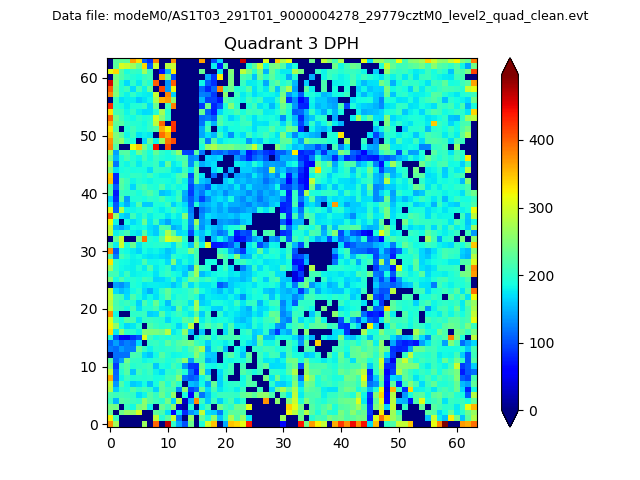 |
 |
Quadrant C |
| Plot type | Count rate plots | Images |
|---|---|---|
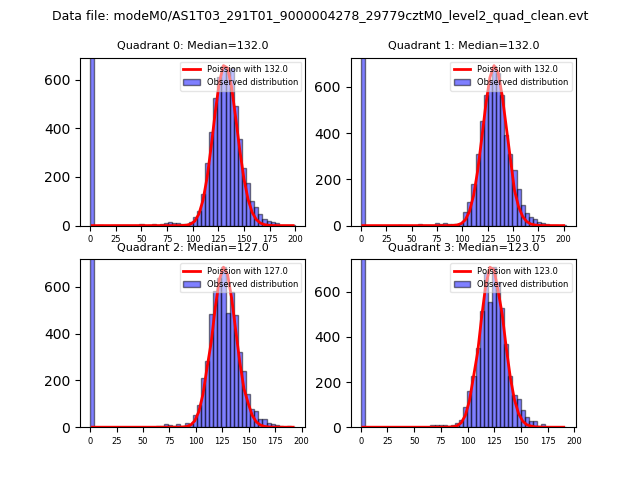
| Comparison with Poisson distribution Blue bars denote a histogram of data divided into 1 sec bins. Red curve is a Poisson curve with rate = median count rate of data. |
 |
 |
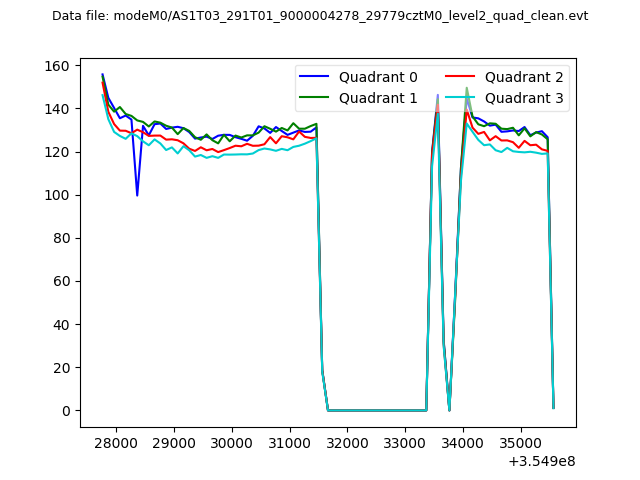
| Quadrant-wise count rates Data is divided into 100 sec bins |
 |
|
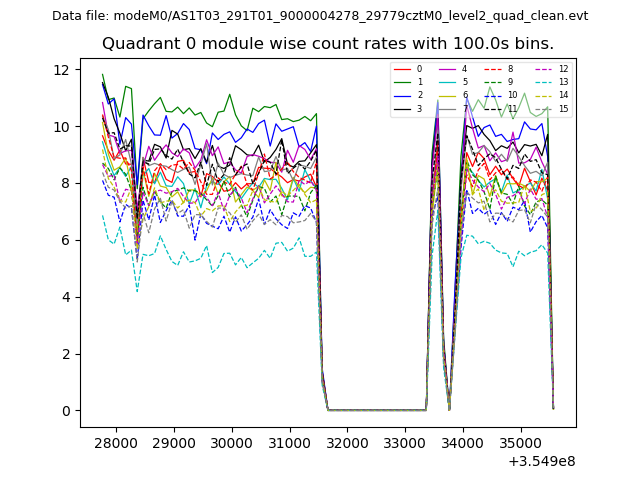
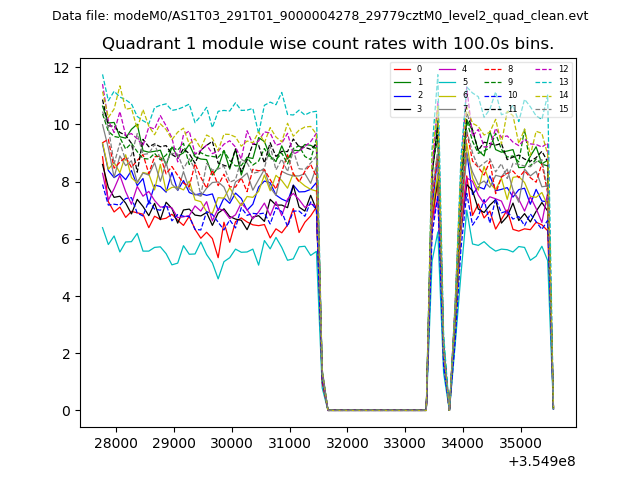
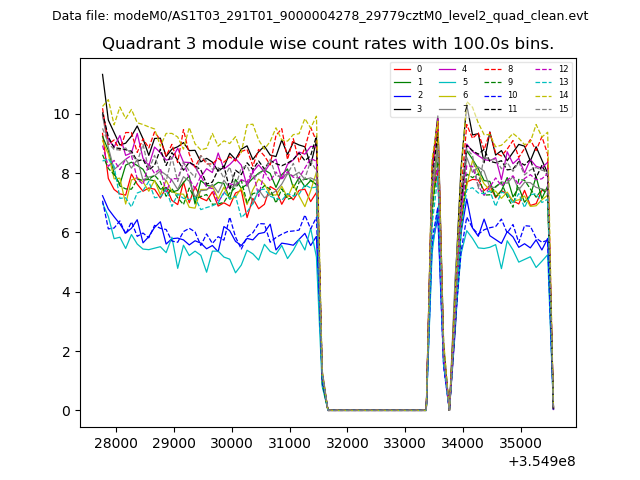
| Module-wise count rates for Quadrant A Data is divided into 100 sec bins |
 |
 |
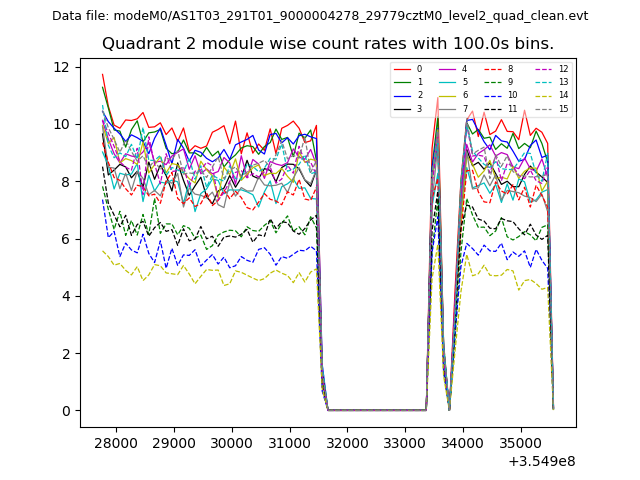
| Module-wise count rates for Quadrant B Data is divided into 100 sec bins |
 |
 |
| Module-wise count rates for Quadrant C Data is divided into 100 sec bins |
 |
 |
| Module-wise count rates for Quadrant D Data is divided into 100 sec bins |
 |
 |
| Parameter | Plot |
|---|---|
| CZT HV Monitor | 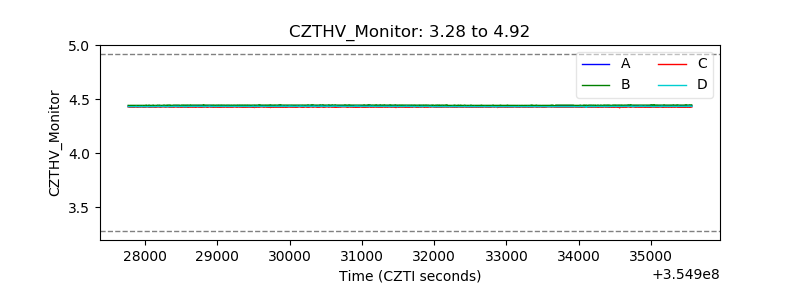 |
| D_VDD | 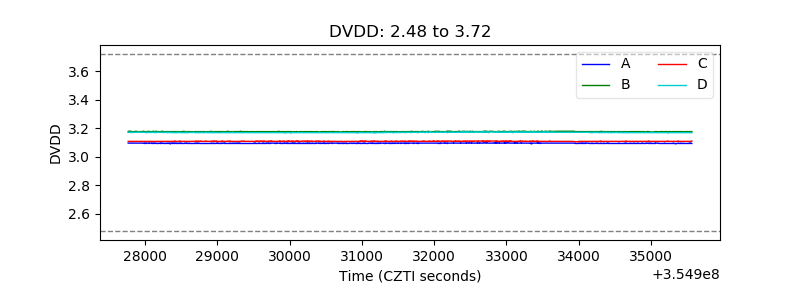 |
| Temperature 1 | 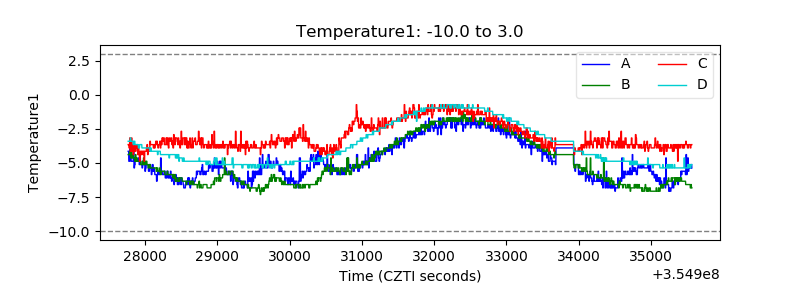 |
| Veto HV Monitor | 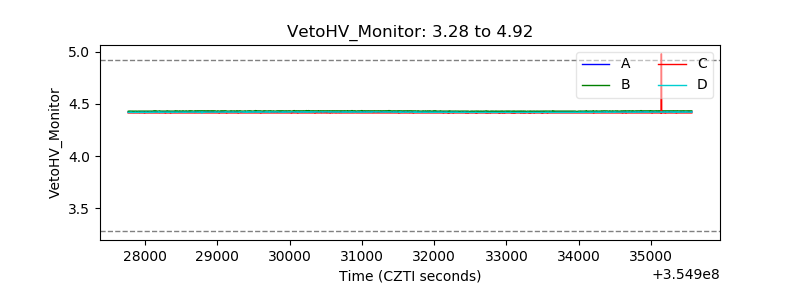 |
| Veto LLD | 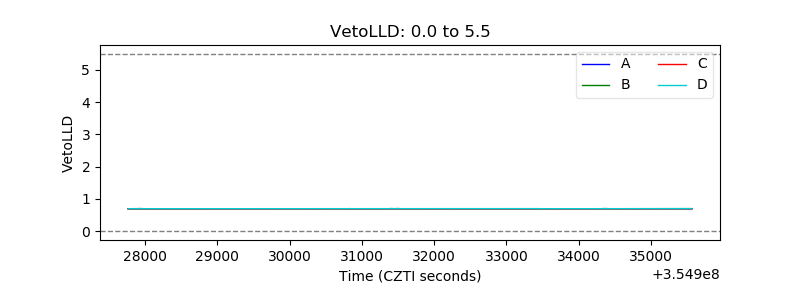 |
| Alpha Counter | 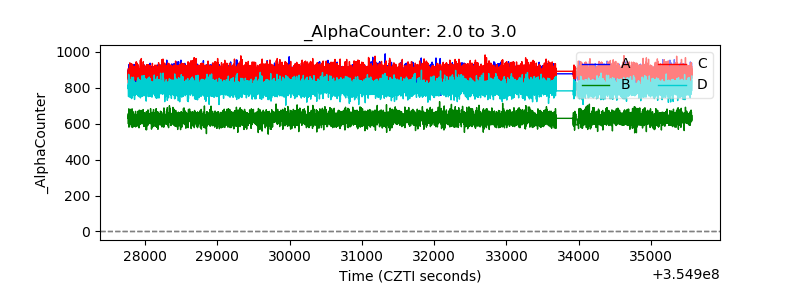 |
| _CPM_Rate | 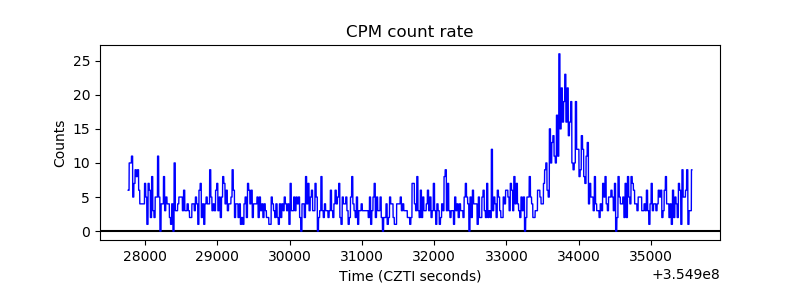 |
| CZT Counter | 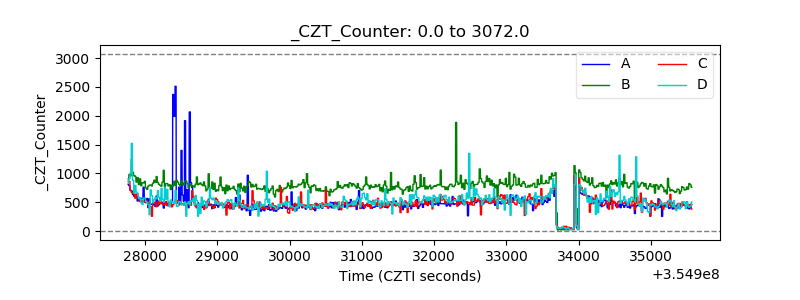 |
| +2.5 Volts monitor |  |
| +5 Volts monitor |  |
| _ROLL_ROT | 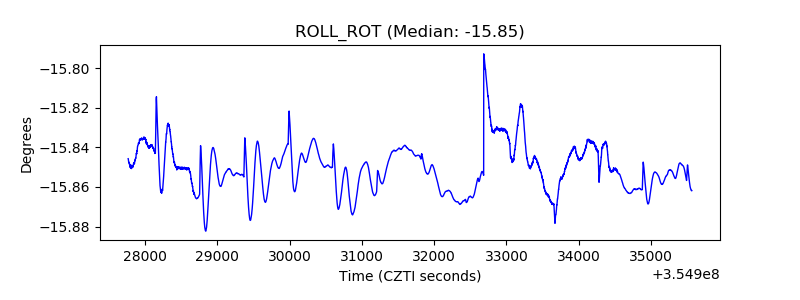 |
| _Roll_DEC |  |
| _Roll_RA | 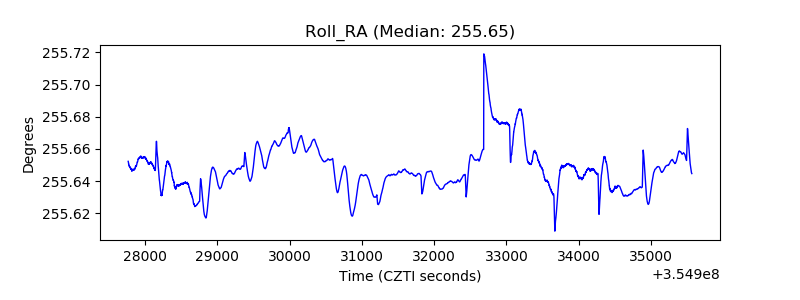 |
| Veto Counter | 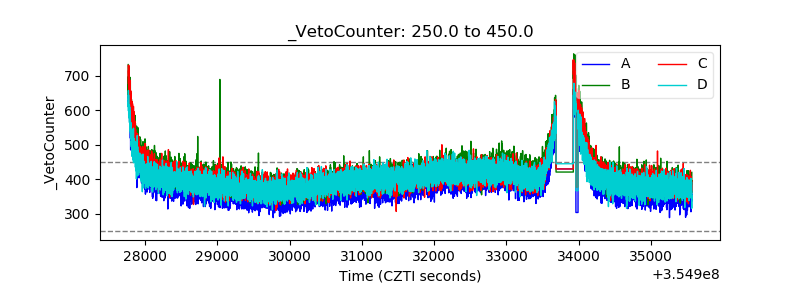 |