| Param | Original file | Final file |
|---|---|---|
| Filename | modeM0/AS1T03_291T01_9000004278_29784cztM0_level2.evt | modeM0/AS1T03_291T01_9000004278_29784cztM0_level2_quad_clean.evt |
| Size (bytes) | 346,786,560 | 63,800,640 |
| Size | 330.7 MB | 60.8 MB |
| Events in quadrant A | 2,037,133 | 414,123 |
| Events in quadrant B | 3,521,407 | 415,510 |
| Events in quadrant C | 2,256,370 | 396,594 |
| Events in quadrant D | 2,377,847 | 385,795 |
| Mode SS | |||
|---|---|---|---|
| Quadrant | BADHDUFLAG | Total packets | Discarded packets |
| A | 0 | 90 | 0 |
| B | 0 | 90 | 0 |
| C | 0 | 90 | 0 |
| D | 0 | 90 | 0 |
| Mode M0 | |||
|---|---|---|---|
| Quadrant | BADHDUFLAG | Total packets | Discarded packets |
| A | 0 | 9127 | 0 |
| B | 0 | 13801 | 0 |
| C | 0 | 9511 | 0 |
| D | 0 | 9936 | 0 |
| Quadrant | Total seconds | Saturated seconds | Saturation percentage |
|---|---|---|---|
| A | 4550 | 3 | 0.065934% |
| B | 4550 | 20 | 0.439560% |
| C | 4551 | 24 | 0.527357% |
| D | 4551 | 12 | 0.263678% |
Noise dominated data is calculated using 1-second bins in cleaned event files. If a bin has >2000 counts, and if more than 50% of those come from <1% of pixels, then it is considered to be noise-dominated and hence unusable.
| Quadrant | # 1 sec bins | Bins with >0 counts | Bins with >2000 counts | High rate bins dominated by noise | Noise dominated (total time) | Noise dominated (detector-on time) | Marked lightcurve |
|---|---|---|---|---|---|---|---|
| A | 4550 | 4550 | 0 | 0 | 0.00% | 0.00% | 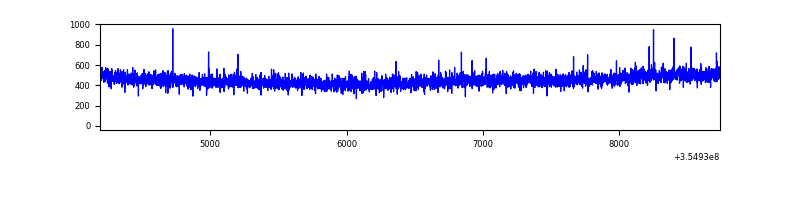 |
| B | 4550 | 4550 | 4 | 4 | 0.09% | 0.09% | 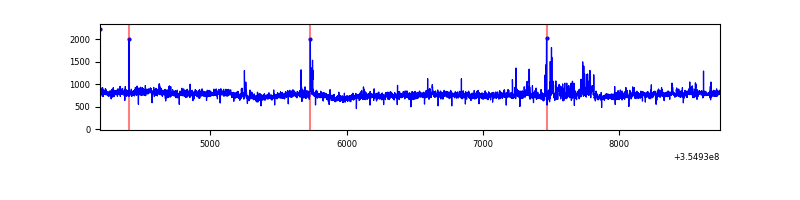 |
| C | 4551 | 4551 | 0 | 0 | 0.00% | 0.00% | 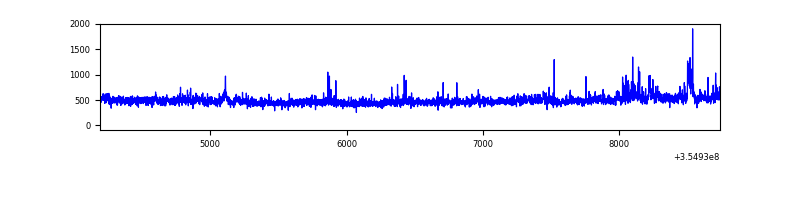 |
| D | 4551 | 4551 | 11 | 11 | 0.24% | 0.24% | 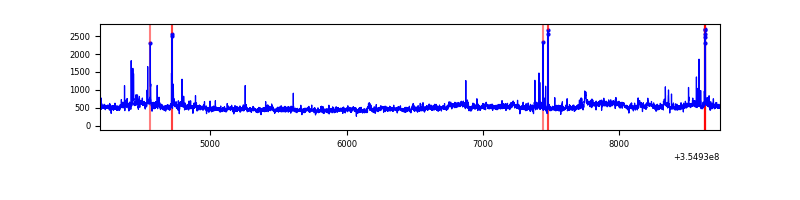 |
Top three noisy pixels from each quadrant. If the there are fewer than three noisy pixels in the level2.evt file, extra rows are filled as -1
| Pixel properties | Quadrant properties | ||||||
|---|---|---|---|---|---|---|---|
| Quadrant | DetID | PixID | Counts | Sigma | Mean | Median | Sigma |
| A | 13 | 254 | 10455 | 93.63 | 527 | 516 | 106.2 |
| A | 3 | 137 | 5311 | 45.17 | 527 | 516 | 106.2 |
| A | 0 | 226 | 4287 | 35.52 | 527 | 516 | 106.2 |
| B | 6 | 159 | 1347534 | 13453.33 | 523 | 509 | 100.1 |
| B | 0 | 229 | 101034 | 1003.99 | 523 | 509 | 100.1 |
| B | 12 | 111 | 12310 | 117.86 | 523 | 509 | 100.1 |
| C | 3 | 233 | 155133 | 1280.94 | 511 | 515 | 120.7 |
| C | 14 | 238 | 84169 | 693.03 | 511 | 515 | 120.7 |
| C | 7 | 247 | 14856 | 118.81 | 511 | 515 | 120.7 |
| D | 8 | 195 | 362491 | 2961.51 | 512 | 499 | 122.2 |
| D | 13 | 153 | 37744 | 304.71 | 512 | 499 | 122.2 |
| D | 2 | 250 | 28932 | 232.61 | 512 | 499 | 122.2 |
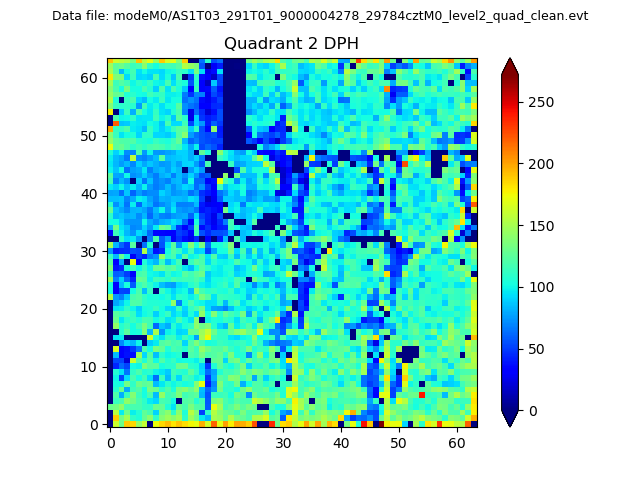
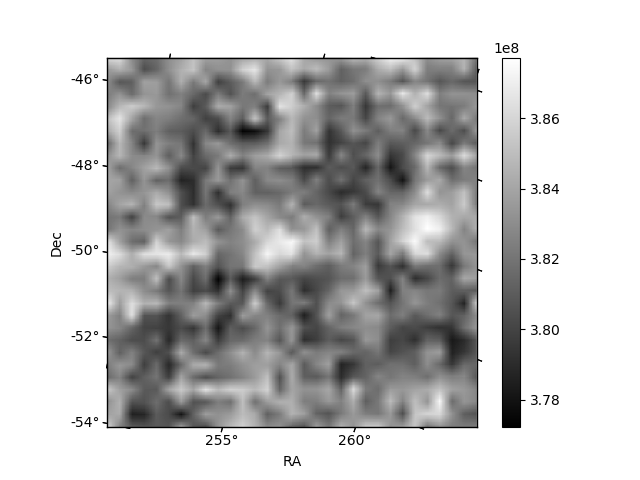
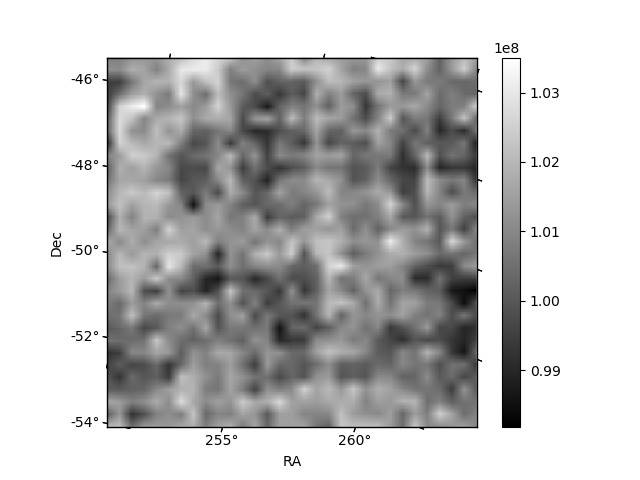
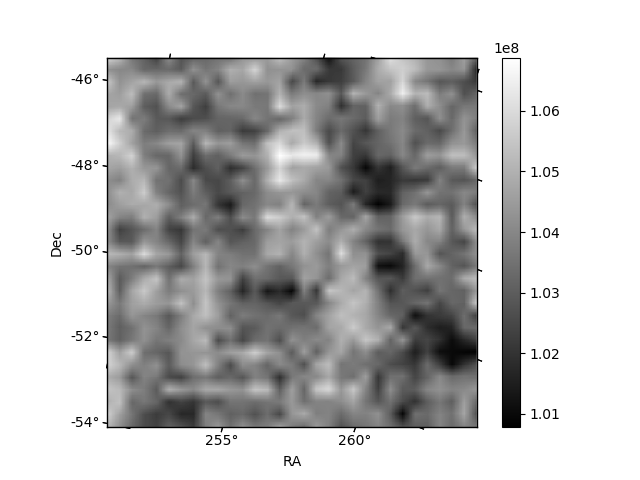
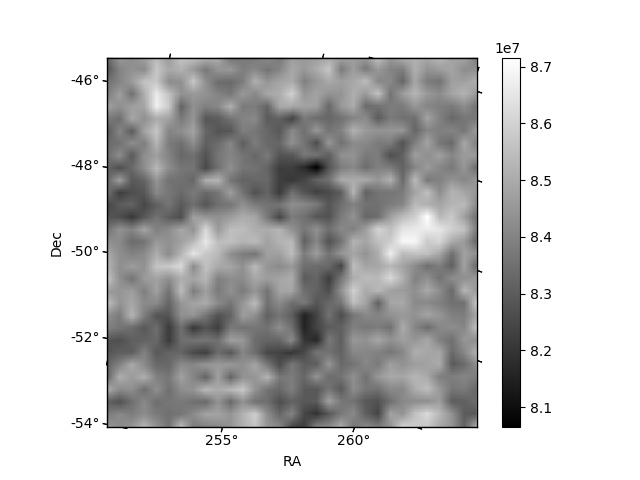
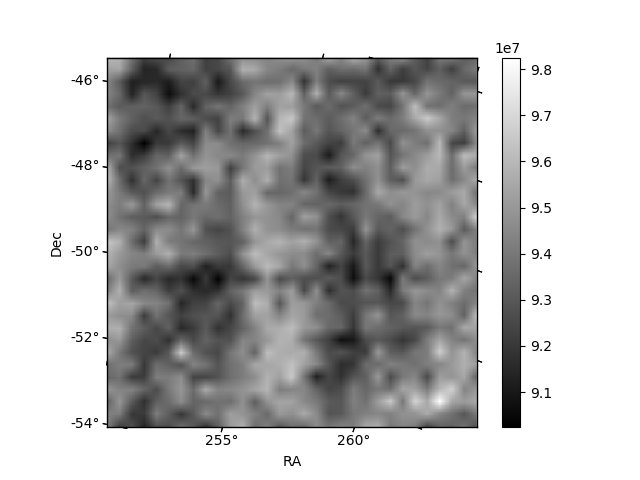
Histogram calculated using DETX and DETY for each event in the final _common_clean file
| Quadrant A | 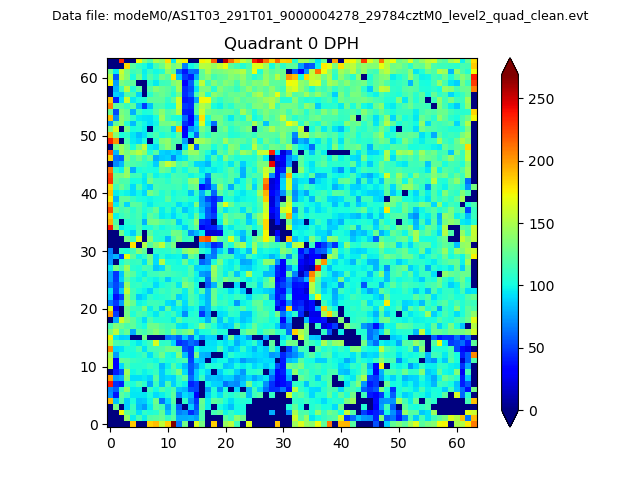 |
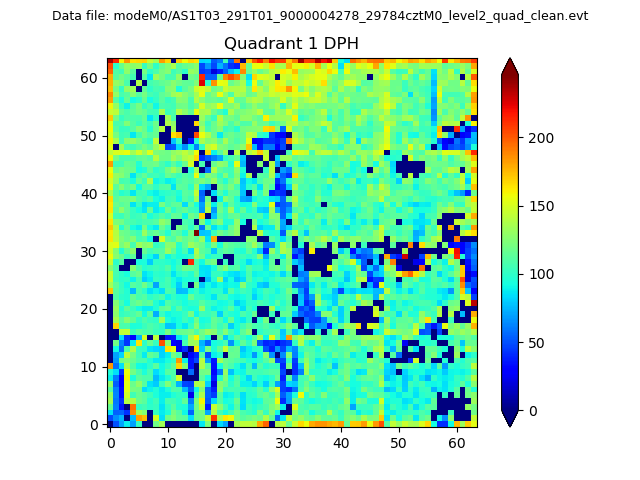 |
Quadrant B |
|---|---|---|---|
| Quadrant D | 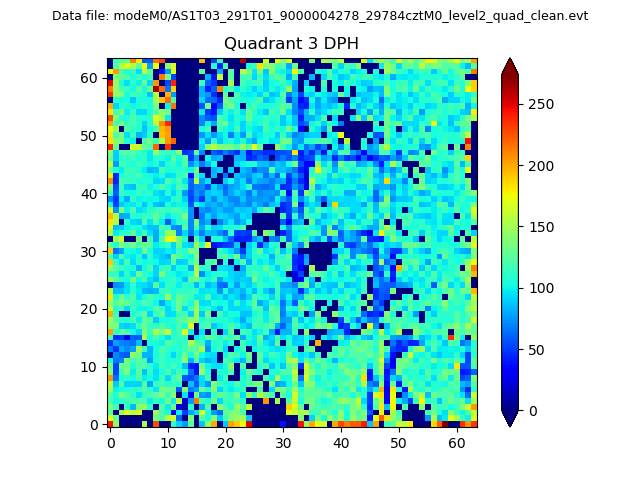 |
 |
Quadrant C |
| Plot type | Count rate plots | Images |
|---|---|---|
| Comparison with Poisson distribution Blue bars denote a histogram of data divided into 1 sec bins. Red curve is a Poisson curve with rate = median count rate of data. |
 |
 |
| Quadrant-wise count rates Data is divided into 100 sec bins |
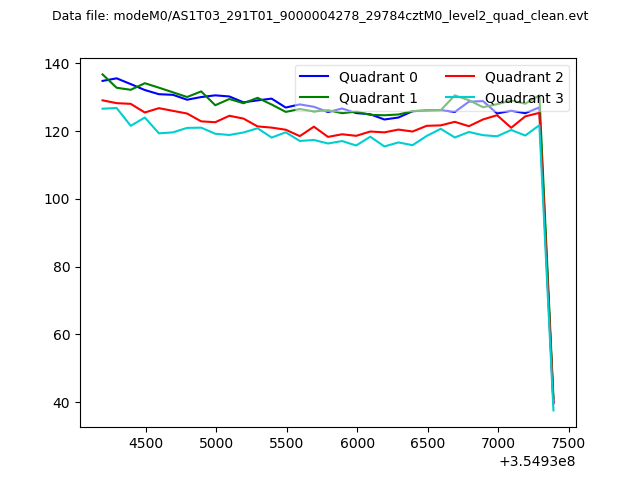 |
|
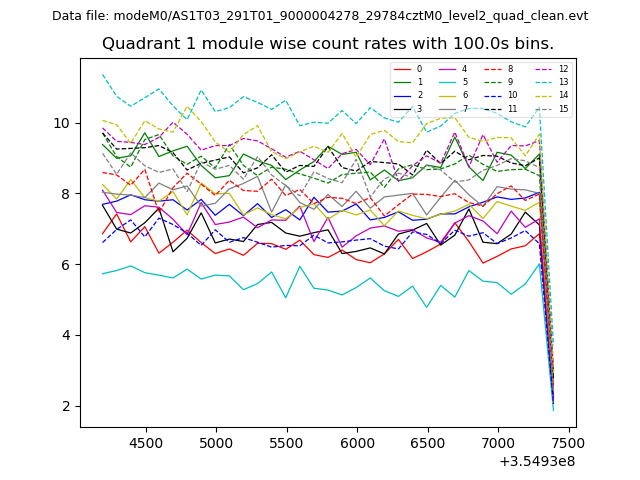
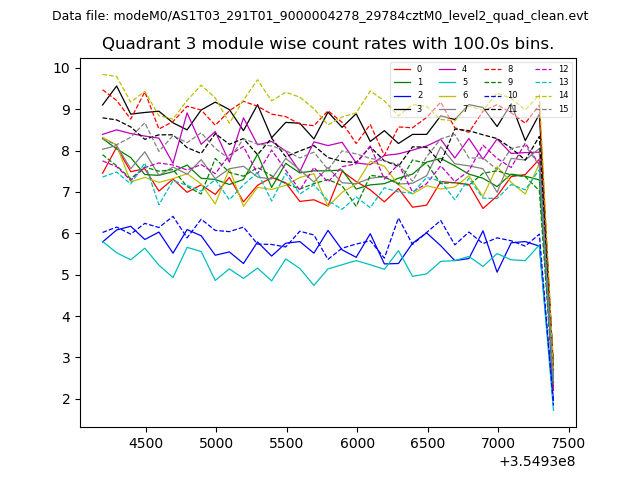
| Module-wise count rates for Quadrant A Data is divided into 100 sec bins |
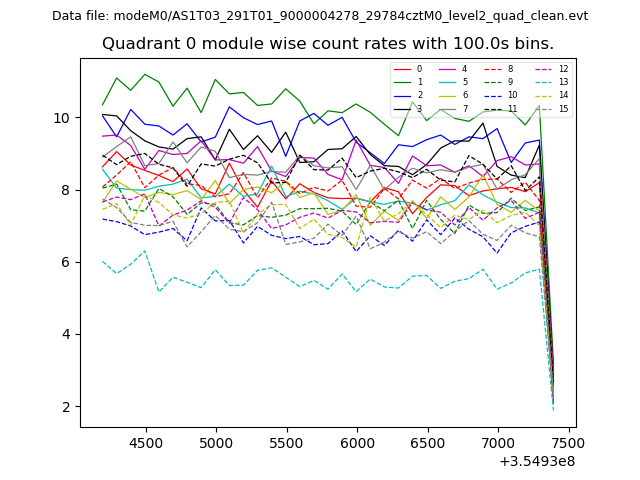 |
 |
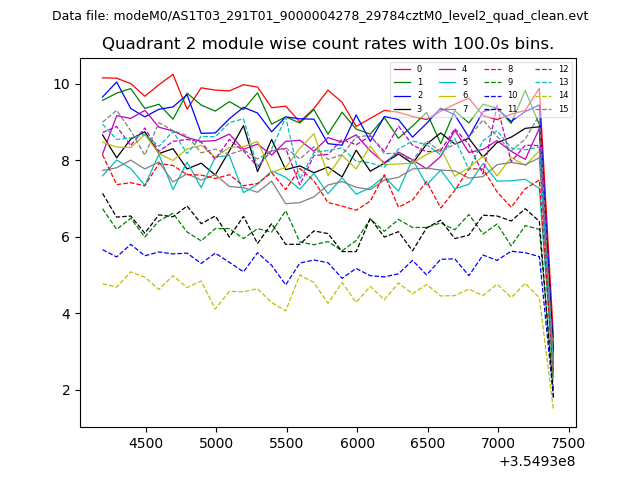
| Module-wise count rates for Quadrant B Data is divided into 100 sec bins |
 |
 |
| Module-wise count rates for Quadrant C Data is divided into 100 sec bins |
 |
 |
| Module-wise count rates for Quadrant D Data is divided into 100 sec bins |
 |
 |
| Parameter | Plot |
|---|---|
| CZT HV Monitor | 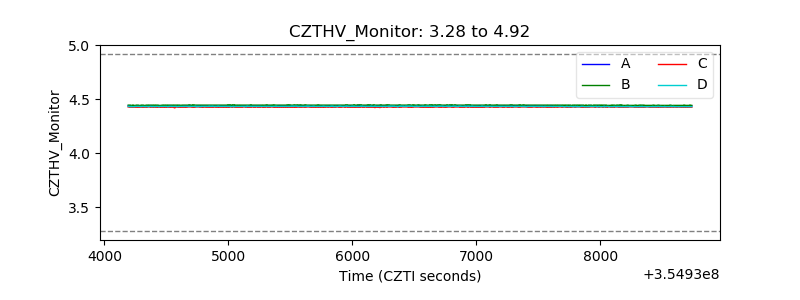 |
| D_VDD | 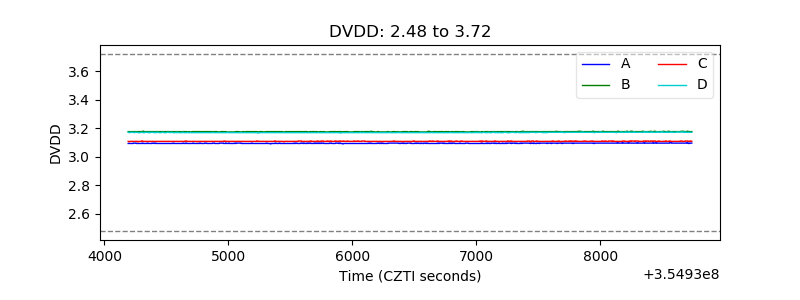 |
| Temperature 1 | 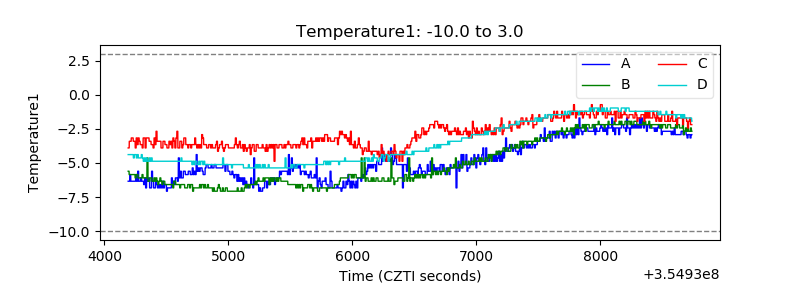 |
| Veto HV Monitor | 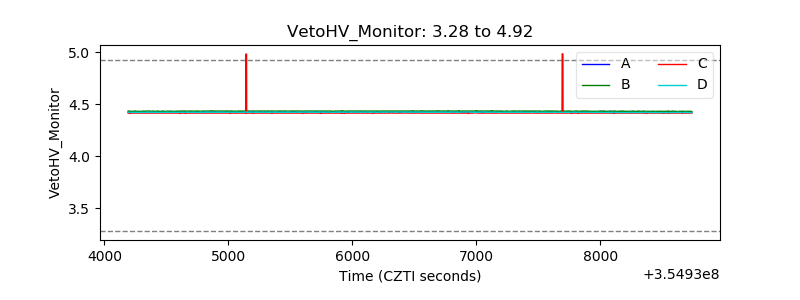 |
| Veto LLD | 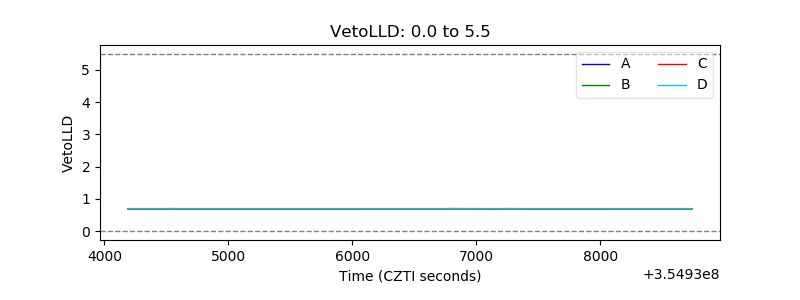 |
| Alpha Counter | 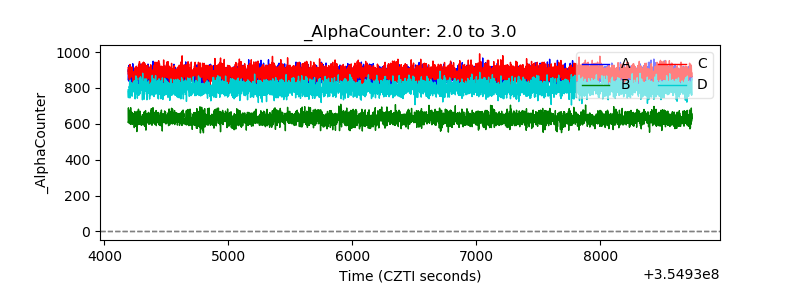 |
| _CPM_Rate | 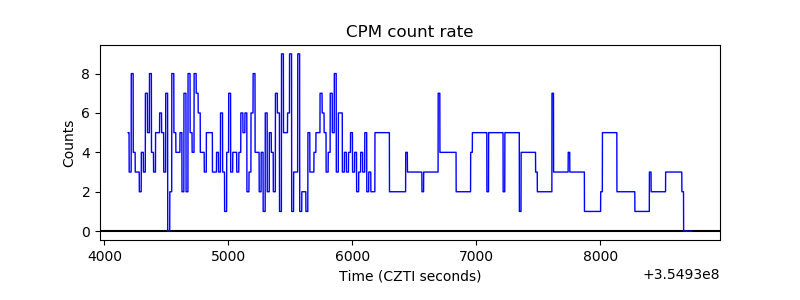 |
| CZT Counter | 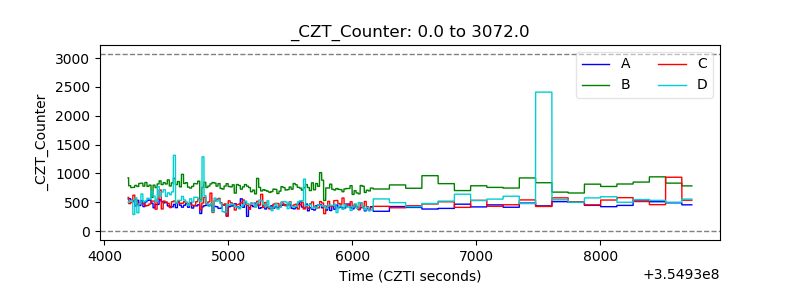 |
| +2.5 Volts monitor |  |
| +5 Volts monitor |  |
| _ROLL_ROT | 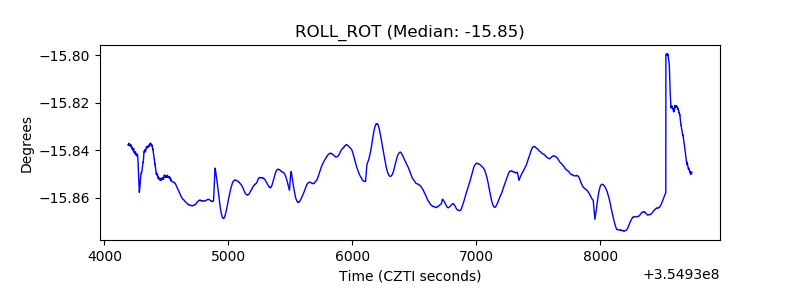 |
| _Roll_DEC | 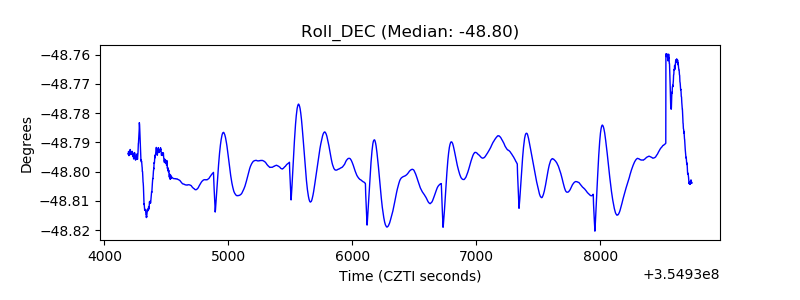 |
| _Roll_RA | 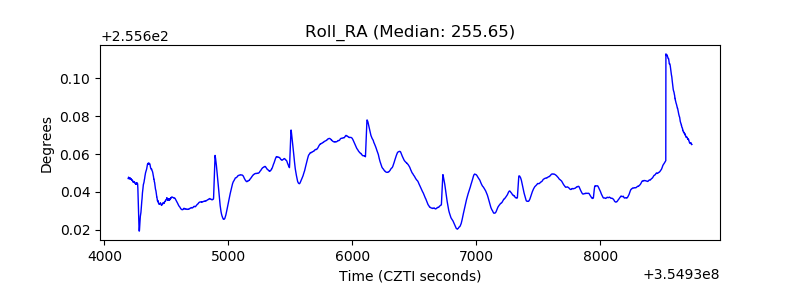 |
| Veto Counter | 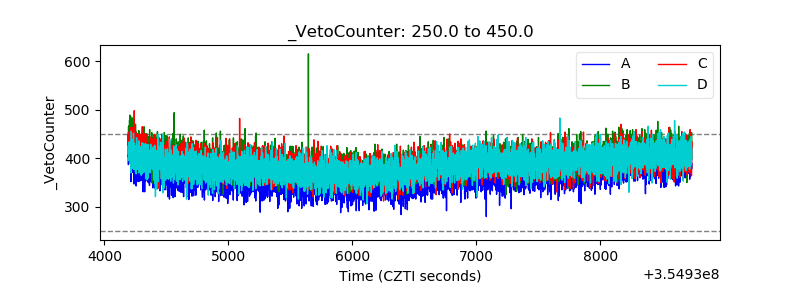 |