| Param | Original file | Final file |
|---|---|---|
| Filename | modeM0/AS1T03_291T01_9000004278_29785cztM0_level2.evt | modeM0/AS1T03_291T01_9000004278_29785cztM0_level2_quad_clean.evt |
| Size (bytes) | 2,584,690,560 | 414,705,600 |
| Size | 2.4 GB | 395.5 MB |
| Events in quadrant A | 15,163,516 | 2,667,071 |
| Events in quadrant B | 25,381,600 | 2,675,338 |
| Events in quadrant C | 16,793,838 | 2,549,496 |
| Events in quadrant D | 18,798,589 | 2,484,576 |
| Mode SS | |||
|---|---|---|---|
| Quadrant | BADHDUFLAG | Total packets | Discarded packets |
| A | 0 | 652 | 0 |
| B | 0 | 652 | 0 |
| C | 0 | 652 | 0 |
| D | 0 | 652 | 0 |
| Mode M0 | |||
|---|---|---|---|
| Quadrant | BADHDUFLAG | Total packets | Discarded packets |
| A | 0 | 65374 | 6 |
| B | 0 | 98169 | 6 |
| C | 0 | 69736 | 6 |
| D | 0 | 75933 | 6 |
| Mode M9 | |||
|---|---|---|---|
| Quadrant | BADHDUFLAG | Total packets | Discarded packets |
| A | 0 | 36 | 0 |
| B | 0 | 36 | 0 |
| C | 0 | 36 | 0 |
| D | 0 | 36 | 0 |
| Quadrant | Total seconds | Saturated seconds | Saturation percentage |
|---|---|---|---|
| A | 31768 | 281 | 0.884538% |
| B | 31768 | 782 | 2.461597% |
| C | 31769 | 866 | 2.725928% |
| D | 31769 | 635 | 1.998804% |
Noise dominated data is calculated using 1-second bins in cleaned event files. If a bin has >2000 counts, and if more than 50% of those come from <1% of pixels, then it is considered to be noise-dominated and hence unusable.
| Quadrant | # 1 sec bins | Bins with >0 counts | Bins with >2000 counts | High rate bins dominated by noise | Noise dominated (total time) | Noise dominated (detector-on time) | Marked lightcurve |
|---|---|---|---|---|---|---|---|
| A | 35533 | 31773 | 7 | 7 | 0.02% | 0.02% | 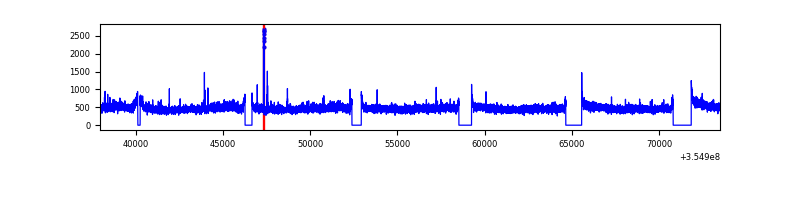 |
| B | 35533 | 31773 | 99 | 99 | 0.28% | 0.31% | 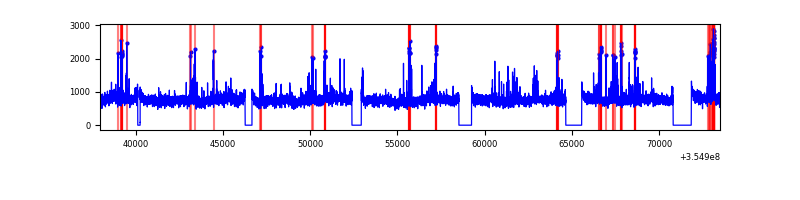 |
| C | 35534 | 31774 | 112 | 112 | 0.32% | 0.35% | 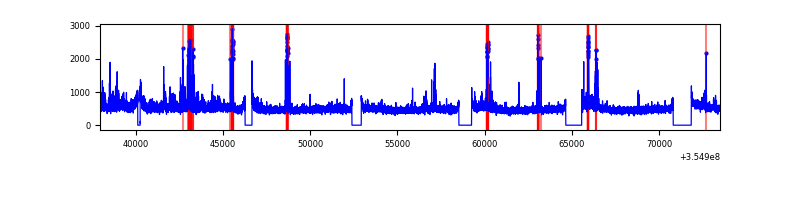 |
| D | 35534 | 31774 | 371 | 371 | 1.04% | 1.17% | 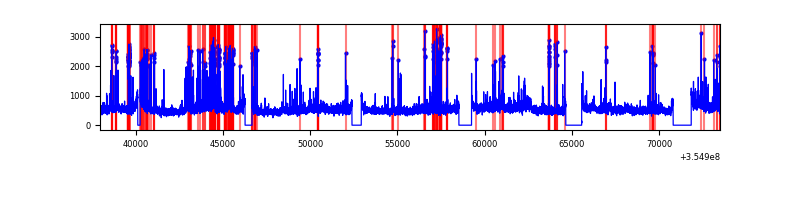 |
Top three noisy pixels from each quadrant. If the there are fewer than three noisy pixels in the level2.evt file, extra rows are filled as -1
| Pixel properties | Quadrant properties | ||||||
|---|---|---|---|---|---|---|---|
| Quadrant | DetID | PixID | Counts | Sigma | Mean | Median | Sigma |
| A | 13 | 254 | 69797 | 84.67 | 3910 | 3826 | 779.2 |
| A | 12 | 96 | 50352 | 59.71 | 3910 | 3826 | 779.2 |
| A | 3 | 137 | 38620 | 44.65 | 3910 | 3826 | 779.2 |
| B | 6 | 159 | 8998174 | 12353.35 | 3853 | 3762 | 728.1 |
| B | 0 | 229 | 1025331 | 1403.07 | 3853 | 3762 | 728.1 |
| B | 0 | 190 | 98517 | 130.14 | 3853 | 3762 | 728.1 |
| C | 10 | 22 | 744421 | 855.6 | 3738 | 3761 | 865.7 |
| C | 14 | 238 | 665347 | 764.26 | 3738 | 3761 | 865.7 |
| C | 3 | 233 | 595090 | 683.1 | 3738 | 3761 | 865.7 |
| D | 8 | 195 | 1990844 | 2241.92 | 3766 | 3666 | 886.4 |
| D | 7 | 80 | 1034590 | 1163.08 | 3766 | 3666 | 886.4 |
| D | 2 | 250 | 476345 | 533.27 | 3766 | 3666 | 886.4 |
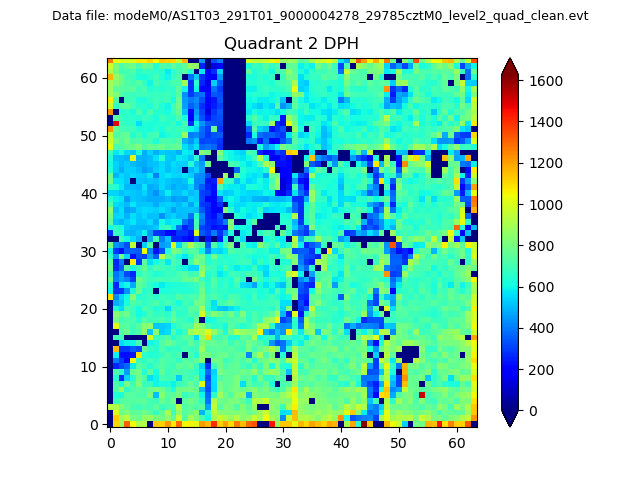
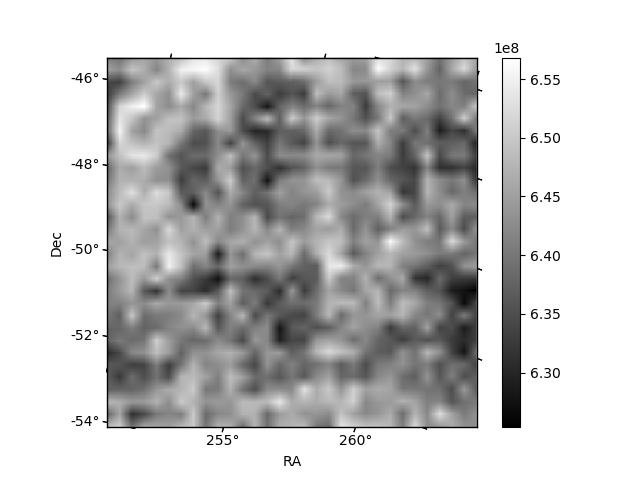
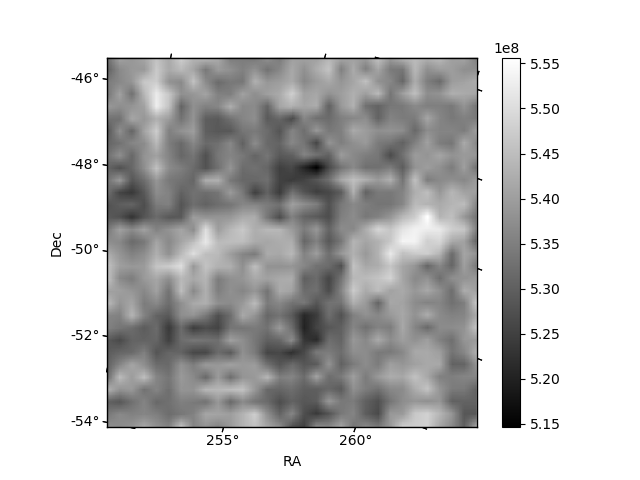
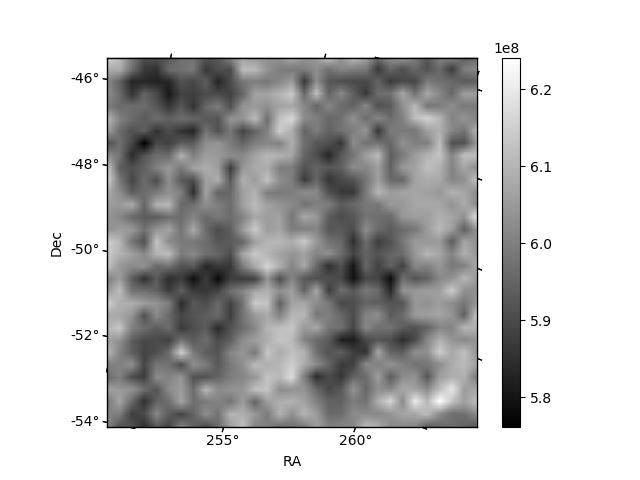
Histogram calculated using DETX and DETY for each event in the final _common_clean file
| Quadrant A |  |
 |
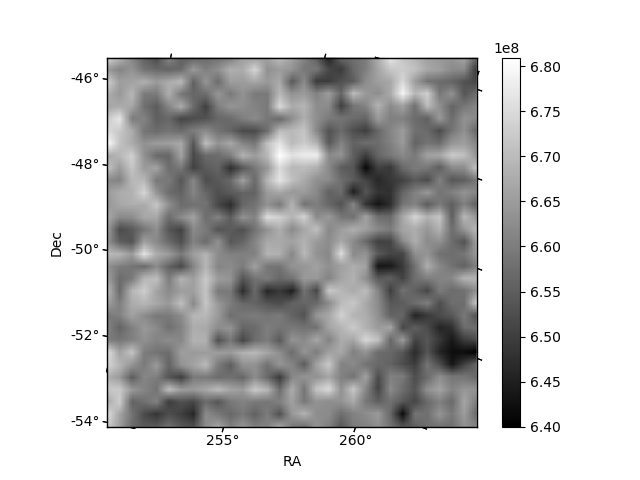
Quadrant B |
|---|---|---|---|
| Quadrant D | 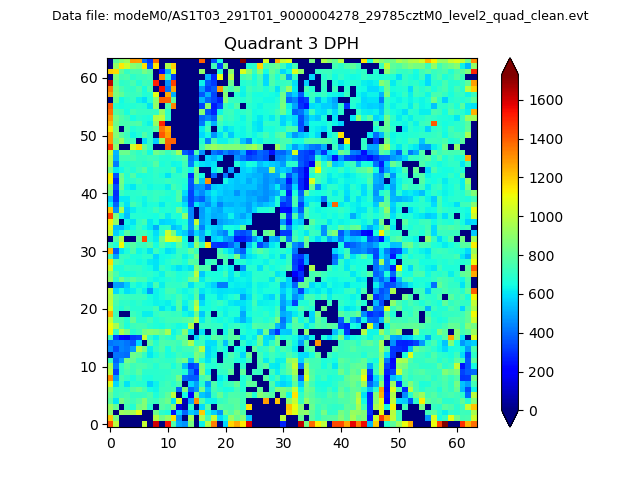 |
 |
Quadrant C |
| Plot type | Count rate plots | Images |
|---|---|---|
| Comparison with Poisson distribution Blue bars denote a histogram of data divided into 1 sec bins. Red curve is a Poisson curve with rate = median count rate of data. |
 |
 |
| Quadrant-wise count rates Data is divided into 100 sec bins |
 |
|
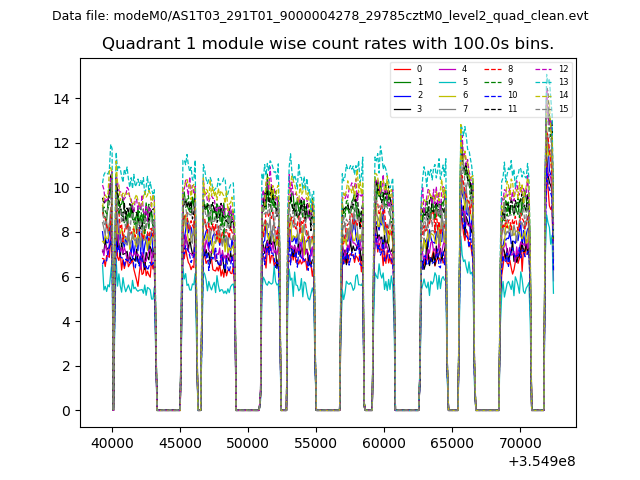
| Module-wise count rates for Quadrant A Data is divided into 100 sec bins |
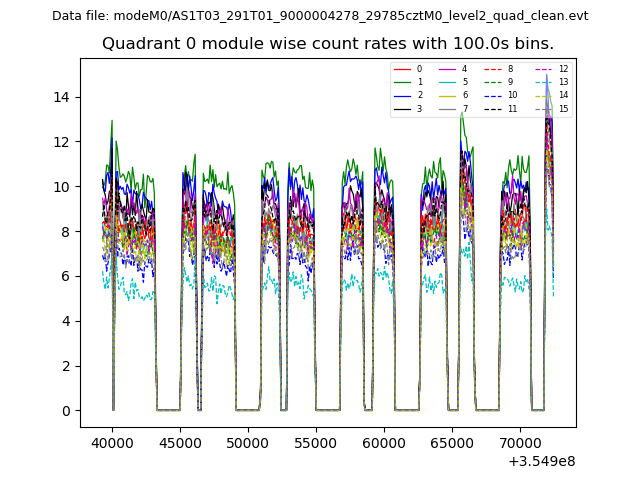 |
 |
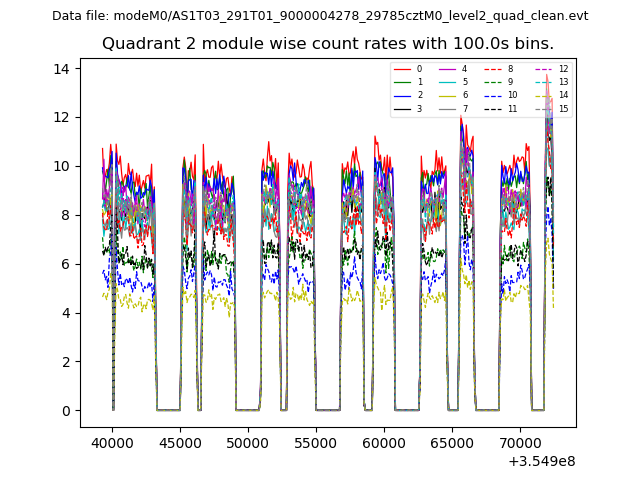
| Module-wise count rates for Quadrant B Data is divided into 100 sec bins |
 |
 |
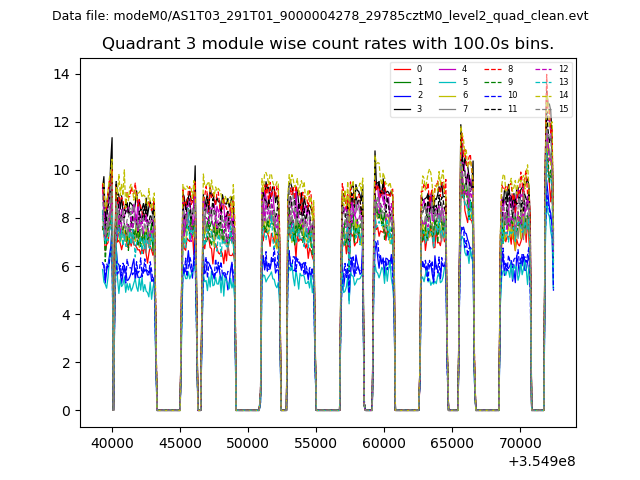
| Module-wise count rates for Quadrant C Data is divided into 100 sec bins |
 |
 |
| Module-wise count rates for Quadrant D Data is divided into 100 sec bins |
 |
 |
| Parameter | Plot |
|---|---|
| CZT HV Monitor | 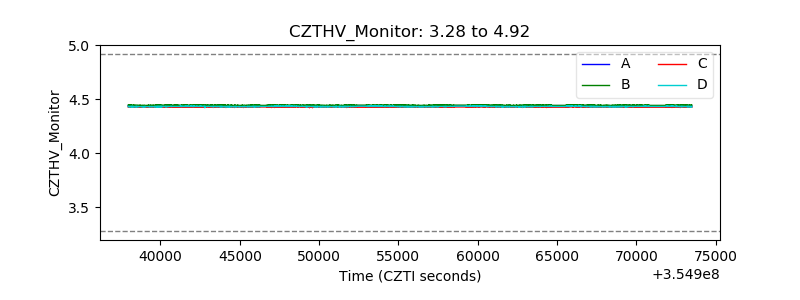 |
| D_VDD | 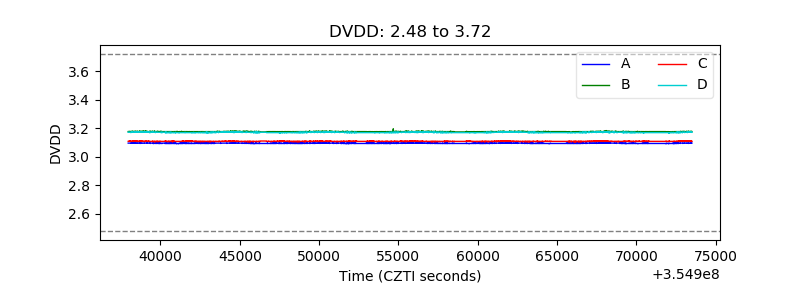 |
| Temperature 1 | 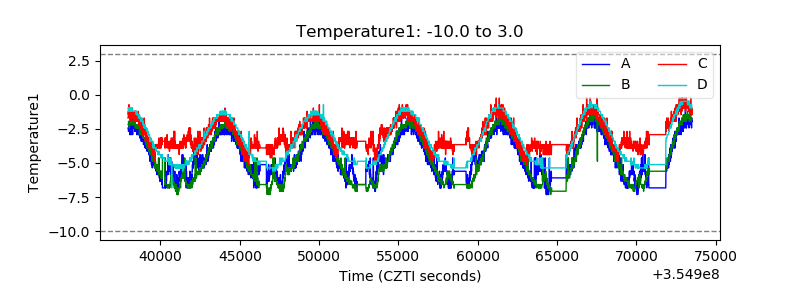 |
| Veto HV Monitor |  |
| Veto LLD | 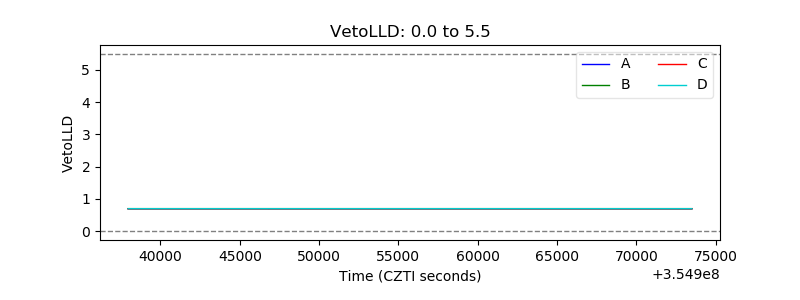 |
| Alpha Counter | 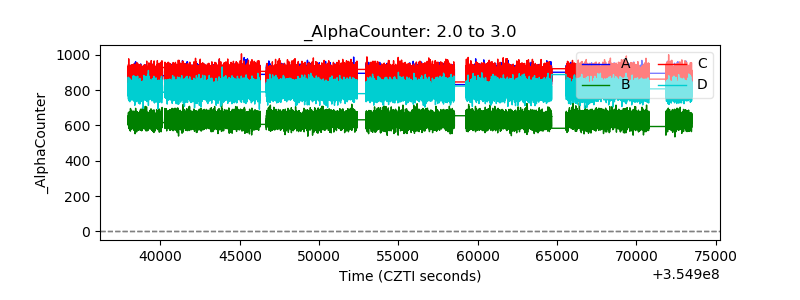 |
| _CPM_Rate |  |
| CZT Counter | 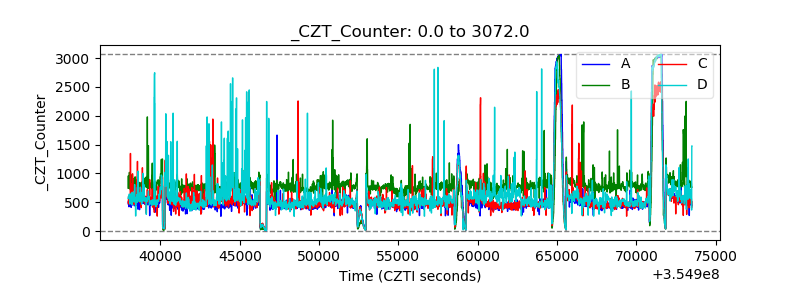 |
| +2.5 Volts monitor |  |
| +5 Volts monitor |  |
| _ROLL_ROT | 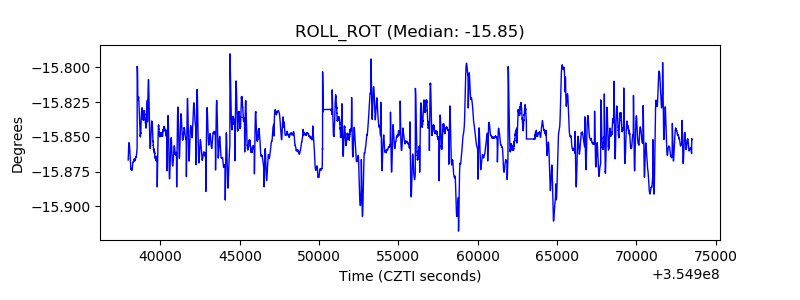 |
| _Roll_DEC |  |
| _Roll_RA |  |
| Veto Counter | 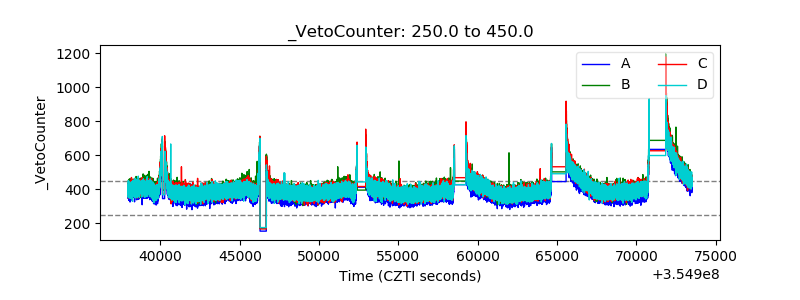 |