| Param | Original file | Final file |
|---|---|---|
| Filename | modeM0/AS1T03_291T01_9000004278_29787cztM0_level2.evt | modeM0/AS1T03_291T01_9000004278_29787cztM0_level2_quad_clean.evt |
| Size (bytes) | 2,713,302,720 | 426,286,080 |
| Size | 2.5 GB | 406.5 MB |
| Events in quadrant A | 15,898,402 | 2,731,221 |
| Events in quadrant B | 26,645,797 | 2,740,961 |
| Events in quadrant C | 17,480,138 | 2,608,309 |
| Events in quadrant D | 19,903,224 | 2,539,729 |
| Mode SS | |||
|---|---|---|---|
| Quadrant | BADHDUFLAG | Total packets | Discarded packets |
| A | 0 | 678 | 0 |
| B | 0 | 678 | 0 |
| C | 0 | 678 | 0 |
| D | 0 | 678 | 0 |
| Mode M0 | |||
|---|---|---|---|
| Quadrant | BADHDUFLAG | Total packets | Discarded packets |
| A | 0 | 68797 | 5 |
| B | 0 | 103059 | 5 |
| C | 0 | 72580 | 6 |
| D | 0 | 80491 | 5 |
| Mode M9 | |||
|---|---|---|---|
| Quadrant | BADHDUFLAG | Total packets | Discarded packets |
| A | 0 | 29 | 0 |
| B | 0 | 29 | 0 |
| C | 0 | 29 | 0 |
| D | 0 | 29 | 0 |
| Quadrant | Total seconds | Saturated seconds | Saturation percentage |
|---|---|---|---|
| A | 33344 | 268 | 0.803743% |
| B | 33345 | 731 | 2.192233% |
| C | 33345 | 810 | 2.429150% |
| D | 33345 | 619 | 1.856350% |
Noise dominated data is calculated using 1-second bins in cleaned event files. If a bin has >2000 counts, and if more than 50% of those come from <1% of pixels, then it is considered to be noise-dominated and hence unusable.
| Quadrant | # 1 sec bins | Bins with >0 counts | Bins with >2000 counts | High rate bins dominated by noise | Noise dominated (total time) | Noise dominated (detector-on time) | Marked lightcurve |
|---|---|---|---|---|---|---|---|
| A | 45494 | 33349 | 11 | 11 | 0.02% | 0.03% | 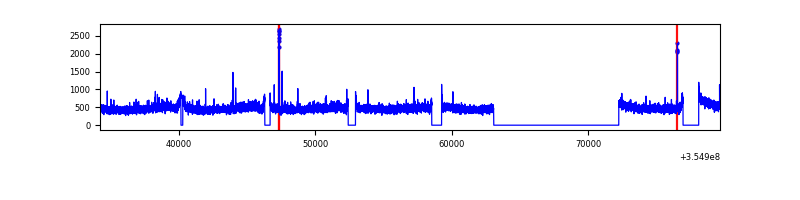 |
| B | 45494 | 33350 | 91 | 91 | 0.20% | 0.27% | 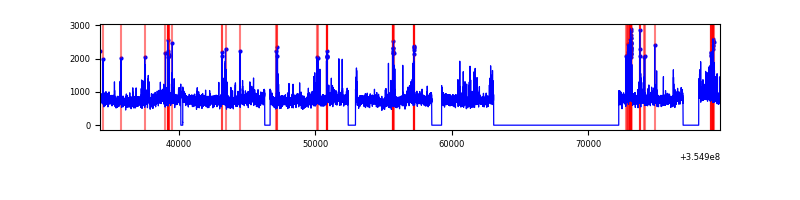 |
| C | 45495 | 33350 | 94 | 94 | 0.21% | 0.28% | 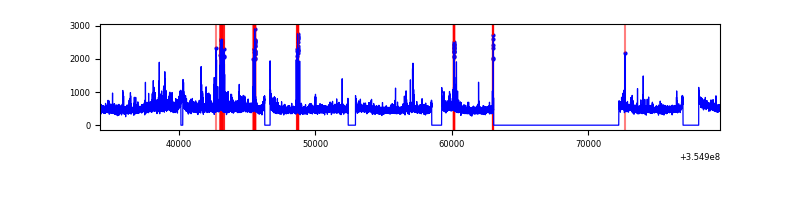 |
| D | 45495 | 33350 | 371 | 371 | 0.82% | 1.11% | 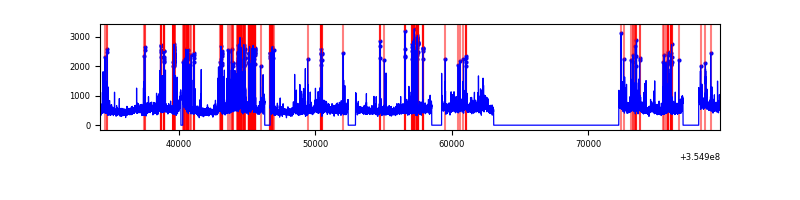 |
Top three noisy pixels from each quadrant. If the there are fewer than three noisy pixels in the level2.evt file, extra rows are filled as -1
| Pixel properties | Quadrant properties | ||||||
|---|---|---|---|---|---|---|---|
| Quadrant | DetID | PixID | Counts | Sigma | Mean | Median | Sigma |
| A | 13 | 254 | 72707 | 84.63 | 4098 | 4015 | 811.6 |
| A | 12 | 96 | 51325 | 58.29 | 4098 | 4015 | 811.6 |
| A | 3 | 137 | 40122 | 44.49 | 4098 | 4015 | 811.6 |
| B | 6 | 159 | 9534730 | 12515.61 | 4042 | 3951 | 761.5 |
| B | 0 | 229 | 977823 | 1278.87 | 4042 | 3951 | 761.5 |
| B | 0 | 190 | 118131 | 149.94 | 4042 | 3951 | 761.5 |
| C | 14 | 238 | 699597 | 771.03 | 3916 | 3938 | 902.2 |
| C | 3 | 233 | 677334 | 746.35 | 3916 | 3938 | 902.2 |
| C | 10 | 22 | 601232 | 662.01 | 3916 | 3938 | 902.2 |
| D | 8 | 195 | 2255895 | 2434.89 | 3944 | 3841 | 924.9 |
| D | 7 | 80 | 1168035 | 1258.71 | 3944 | 3841 | 924.9 |
| D | 2 | 250 | 508804 | 545.96 | 3944 | 3841 | 924.9 |
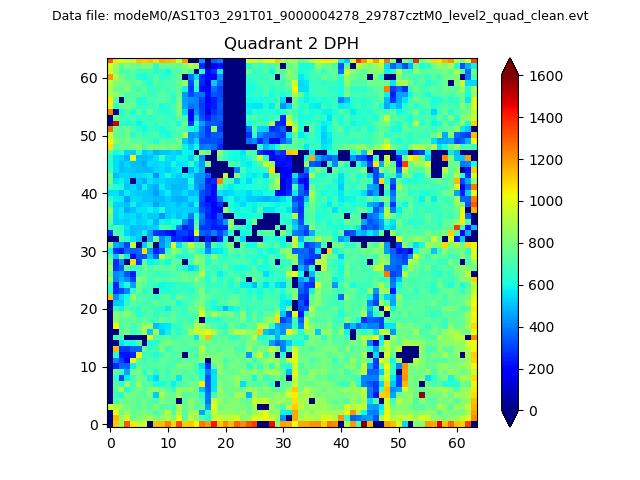
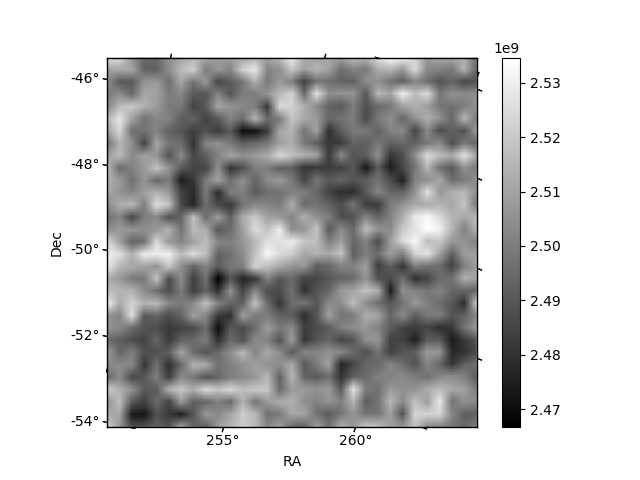
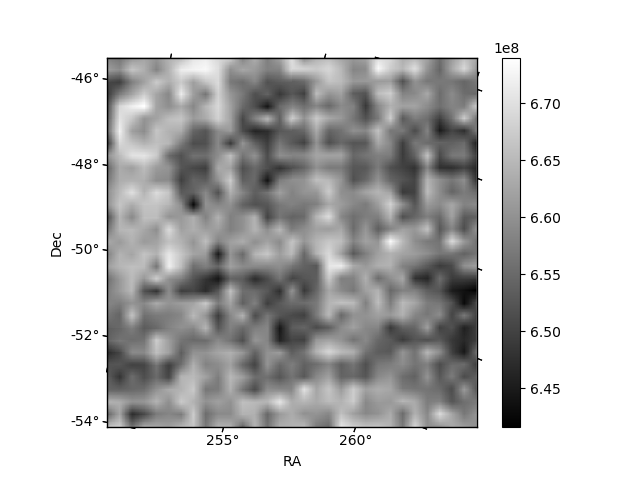
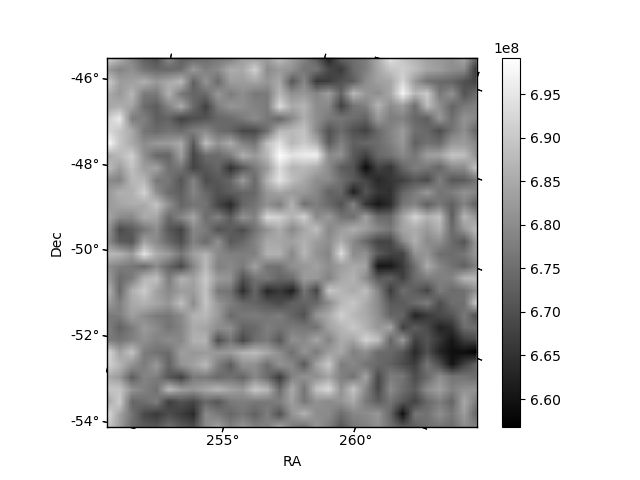
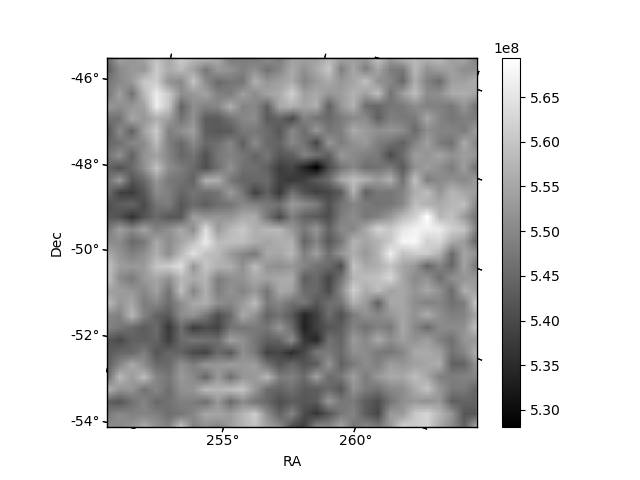
Histogram calculated using DETX and DETY for each event in the final _common_clean file
| Quadrant A | 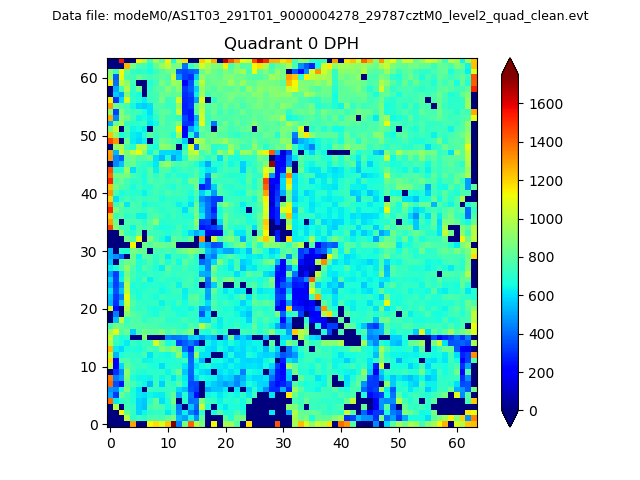 |
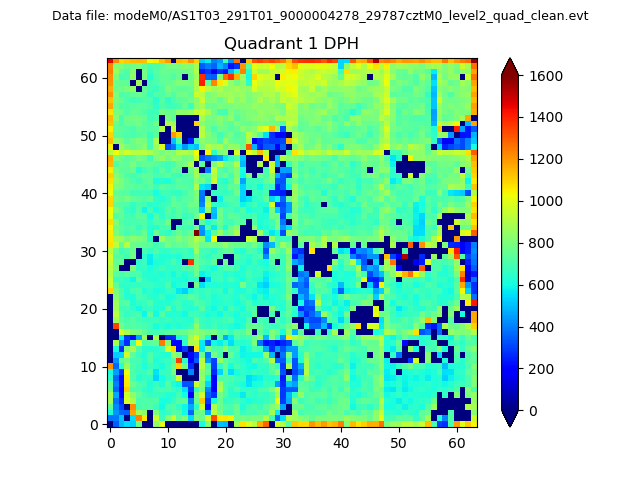 |
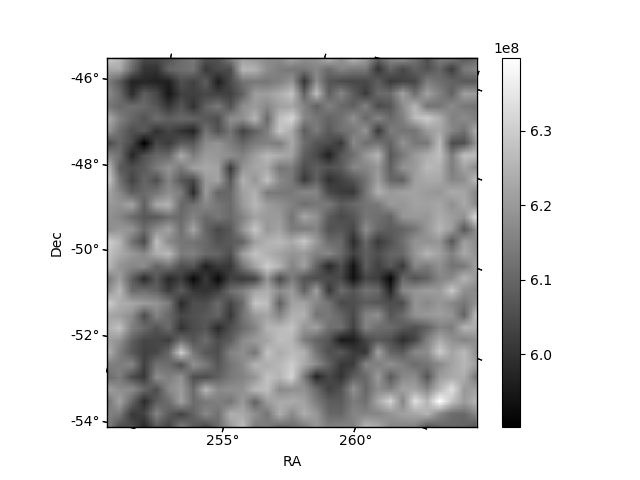
Quadrant B |
|---|---|---|---|
| Quadrant D | 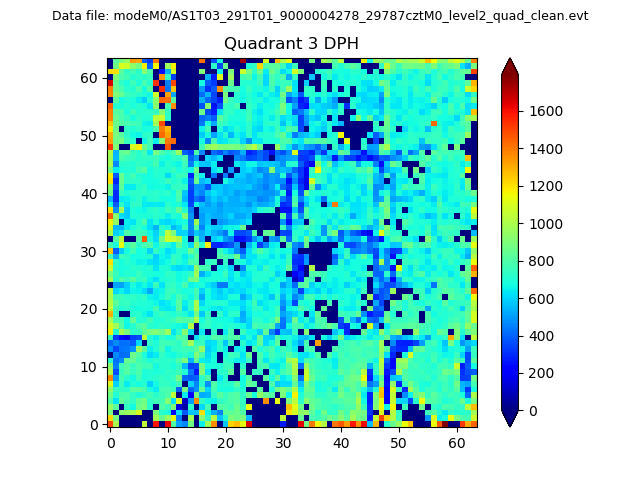 |
 |
Quadrant C |
| Plot type | Count rate plots | Images |
|---|---|---|
| Comparison with Poisson distribution Blue bars denote a histogram of data divided into 1 sec bins. Red curve is a Poisson curve with rate = median count rate of data. |
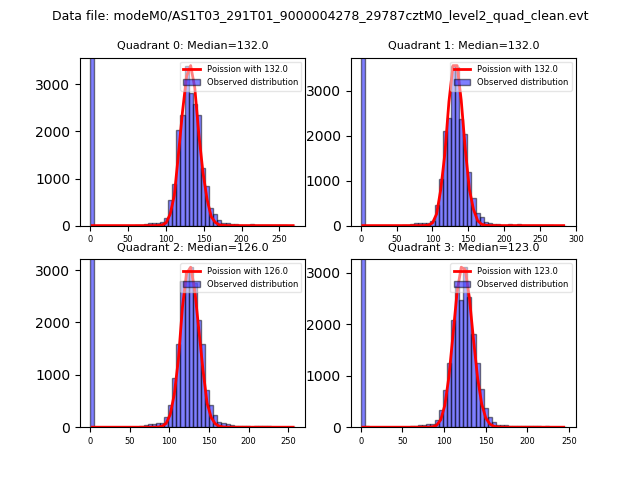 |
 |
| Quadrant-wise count rates Data is divided into 100 sec bins |
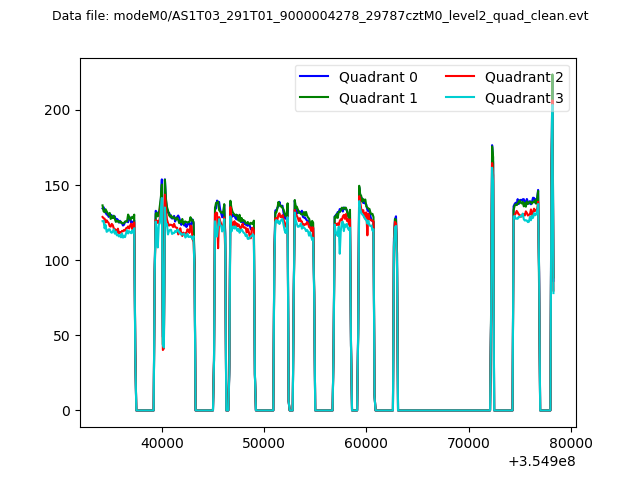 |
|
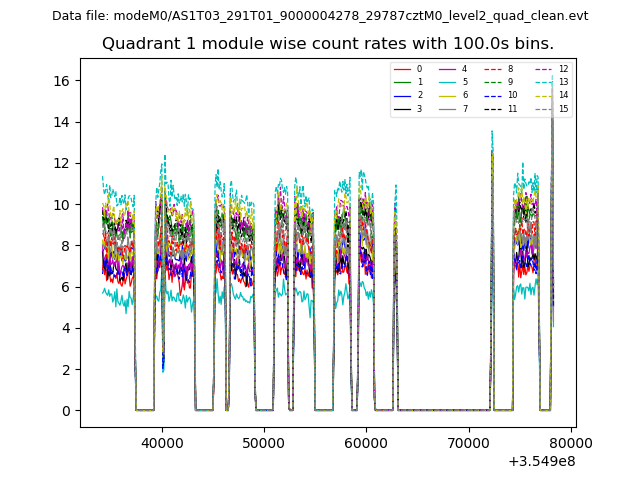
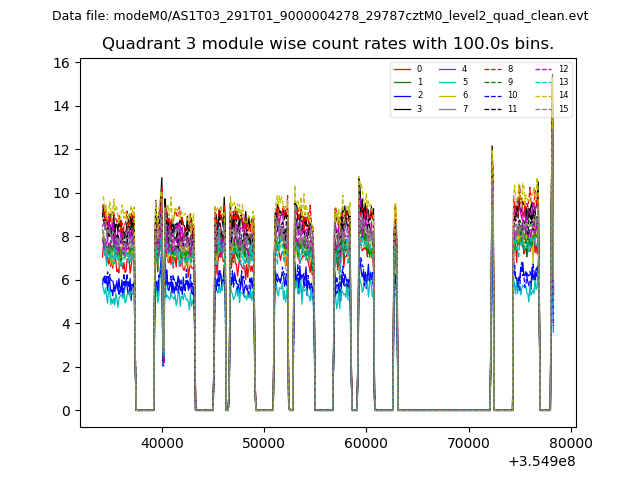
| Module-wise count rates for Quadrant A Data is divided into 100 sec bins |
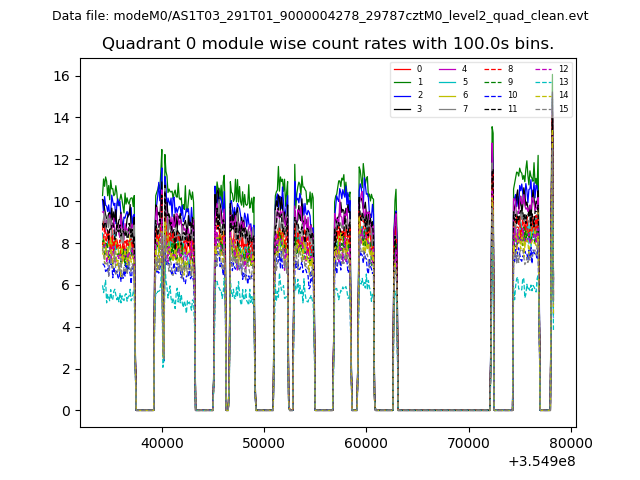 |
 |
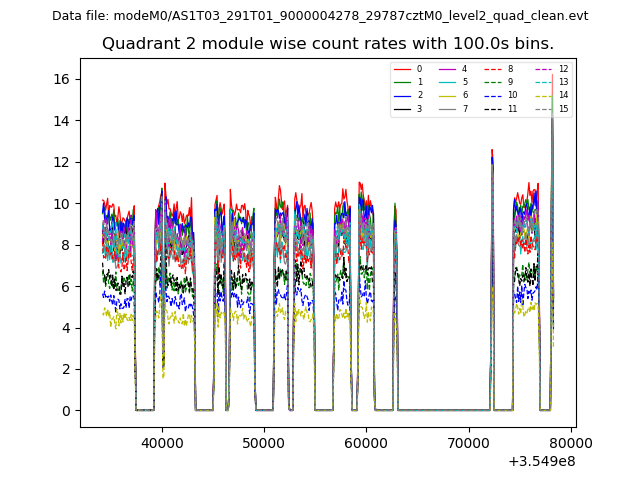
| Module-wise count rates for Quadrant B Data is divided into 100 sec bins |
 |
 |
| Module-wise count rates for Quadrant C Data is divided into 100 sec bins |
 |
 |
| Module-wise count rates for Quadrant D Data is divided into 100 sec bins |
 |
 |
| Parameter | Plot |
|---|---|
| CZT HV Monitor | 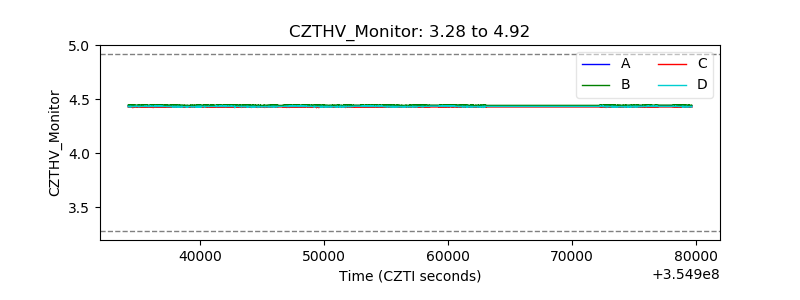 |
| D_VDD | 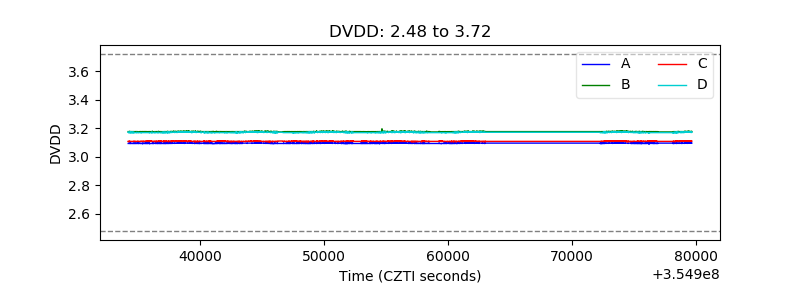 |
| Temperature 1 | 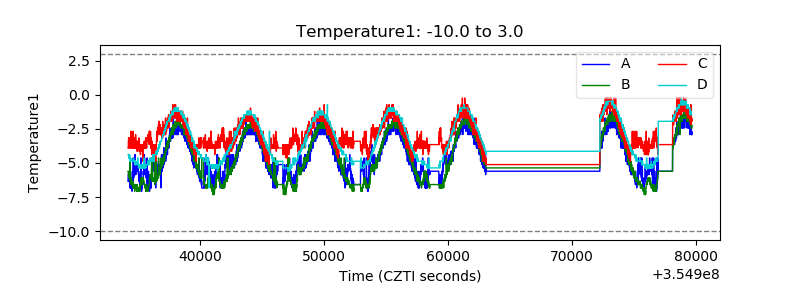 |
| Veto HV Monitor | 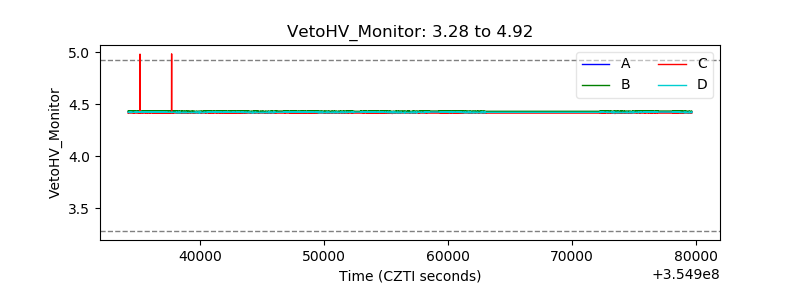 |
| Veto LLD |  |
| Alpha Counter | 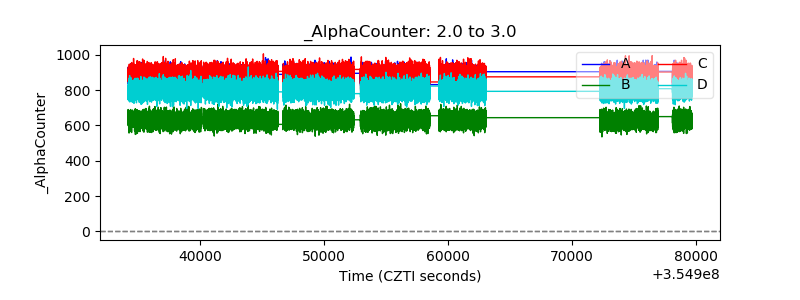 |
| _CPM_Rate | 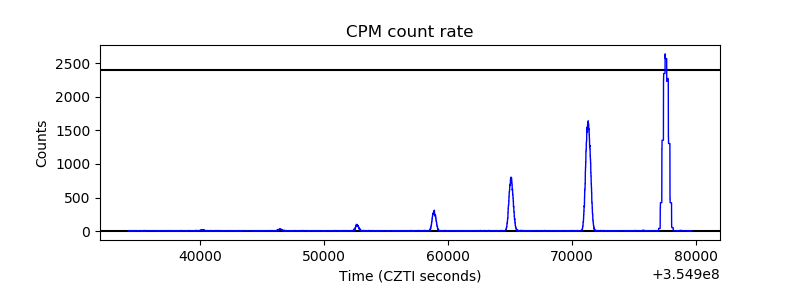 |
| CZT Counter | 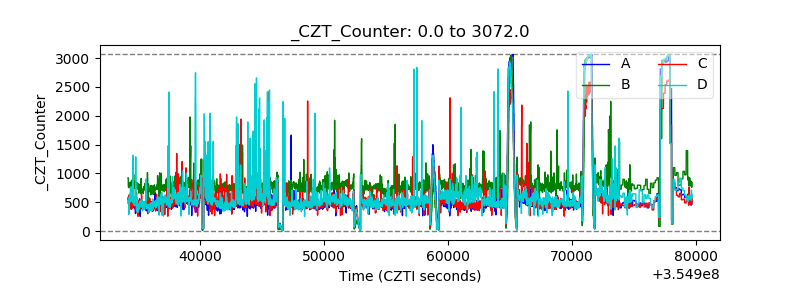 |
| +2.5 Volts monitor |  |
| +5 Volts monitor |  |
| _ROLL_ROT | 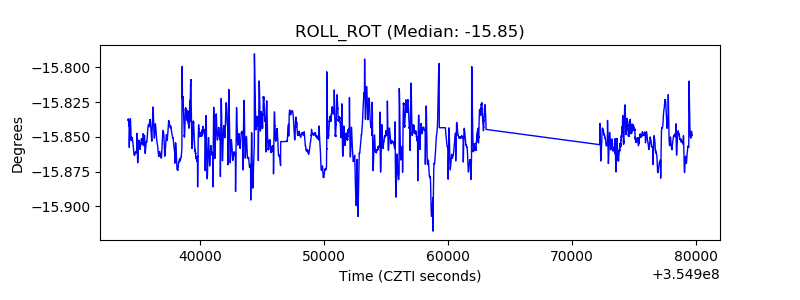 |
| _Roll_DEC | 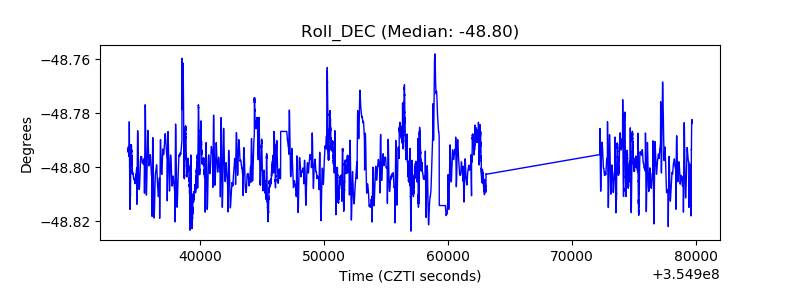 |
| _Roll_RA |  |
| Veto Counter |  |