| Param | Original file | Final file |
|---|---|---|
| Filename | modeM0/AS1T03_291T01_9000004278_29789cztM0_level2.evt | modeM0/AS1T03_291T01_9000004278_29789cztM0_level2_quad_clean.evt |
| Size (bytes) | 643,795,200 | 79,977,600 |
| Size | 614.0 MB | 76.3 MB |
| Events in quadrant A | 3,625,175 | 521,053 |
| Events in quadrant B | 5,768,050 | 518,245 |
| Events in quadrant C | 3,597,820 | 483,974 |
| Events in quadrant D | 6,076,304 | 454,072 |
| Mode SS | |||
|---|---|---|---|
| Quadrant | BADHDUFLAG | Total packets | Discarded packets |
| A | 0 | 130 | 0 |
| B | 0 | 130 | 0 |
| C | 0 | 130 | 0 |
| D | 0 | 130 | 0 |
| Mode M0 | |||
|---|---|---|---|
| Quadrant | BADHDUFLAG | Total packets | Discarded packets |
| A | 0 | 14851 | 2 |
| B | 0 | 21372 | 2 |
| C | 0 | 14639 | 2 |
| D | 0 | 22727 | 3 |
| Mode M9 | |||
|---|---|---|---|
| Quadrant | BADHDUFLAG | Total packets | Discarded packets |
| A | 0 | 13 | 0 |
| B | 0 | 14 | 0 |
| C | 0 | 14 | 0 |
| D | 0 | 14 | 0 |
| Quadrant | Total seconds | Saturated seconds | Saturation percentage |
|---|---|---|---|
| A | 6367 | 106 | 1.664834% |
| B | 6367 | 237 | 3.722318% |
| C | 6367 | 144 | 2.261662% |
| D | 6366 | 591 | 9.283695% |
Noise dominated data is calculated using 1-second bins in cleaned event files. If a bin has >2000 counts, and if more than 50% of those come from <1% of pixels, then it is considered to be noise-dominated and hence unusable.
| Quadrant | # 1 sec bins | Bins with >0 counts | Bins with >2000 counts | High rate bins dominated by noise | Noise dominated (total time) | Noise dominated (detector-on time) | Marked lightcurve |
|---|---|---|---|---|---|---|---|
| A | 7682 | 6368 | 0 | 0 | 0.00% | 0.00% | 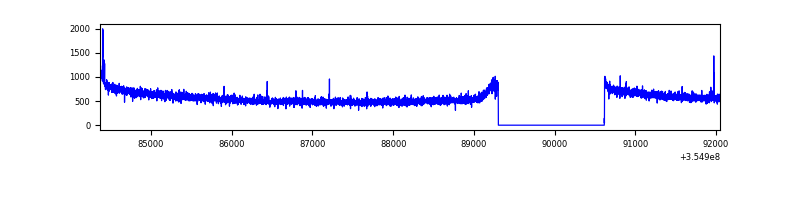 |
| B | 7682 | 6368 | 18 | 18 | 0.23% | 0.28% | 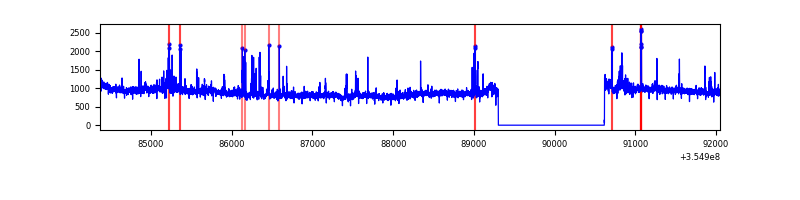 |
| C | 7682 | 6368 | 6 | 6 | 0.08% | 0.09% | 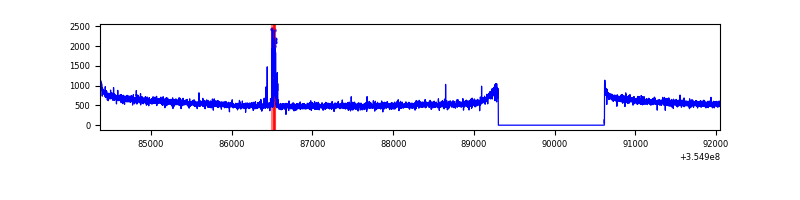 |
| D | 7681 | 6367 | 514 | 514 | 6.69% | 8.07% | 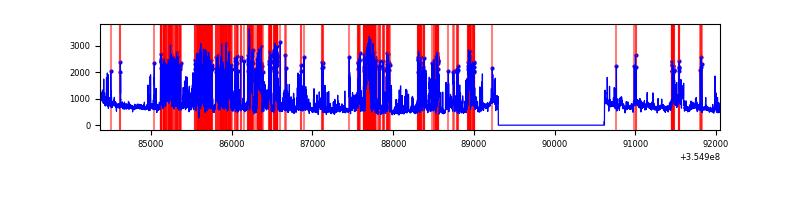 |
Top three noisy pixels from each quadrant. If the there are fewer than three noisy pixels in the level2.evt file, extra rows are filled as -1
| Pixel properties | Quadrant properties | ||||||
|---|---|---|---|---|---|---|---|
| Quadrant | DetID | PixID | Counts | Sigma | Mean | Median | Sigma |
| A | 12 | 96 | 14375 | 74.14 | 936 | 921 | 181.5 |
| A | 13 | 254 | 12099 | 61.6 | 936 | 921 | 181.5 |
| A | 0 | 226 | 8189 | 40.05 | 936 | 921 | 181.5 |
| B | 6 | 159 | 1871415 | 11177.26 | 919 | 903 | 167.3 |
| B | 0 | 229 | 238617 | 1420.46 | 919 | 903 | 167.3 |
| B | 15 | 32 | 38910 | 227.11 | 919 | 903 | 167.3 |
| C | 14 | 238 | 146063 | 726.14 | 868 | 876 | 199.9 |
| C | 10 | 22 | 51167 | 251.53 | 868 | 876 | 199.9 |
| C | 2 | 114 | 15363 | 72.46 | 868 | 876 | 199.9 |
| D | 7 | 80 | 2290457 | 11520.82 | 853 | 833 | 198.7 |
| D | 8 | 195 | 474980 | 2385.79 | 853 | 833 | 198.7 |
| D | 2 | 234 | 28118 | 137.29 | 853 | 833 | 198.7 |
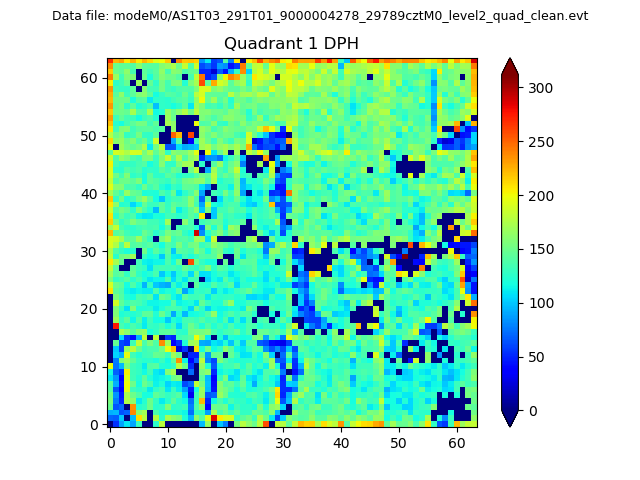
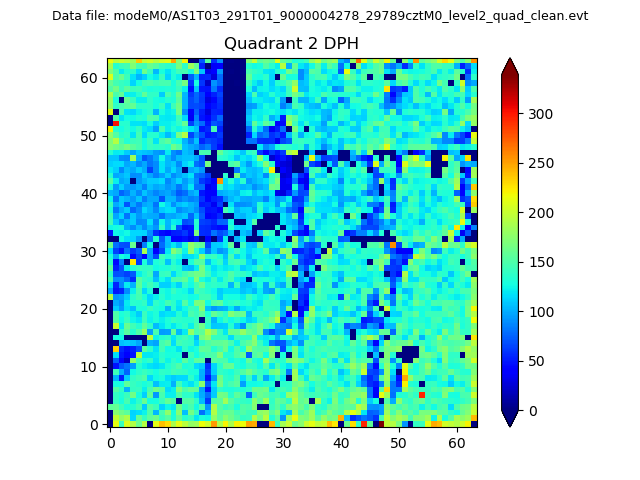
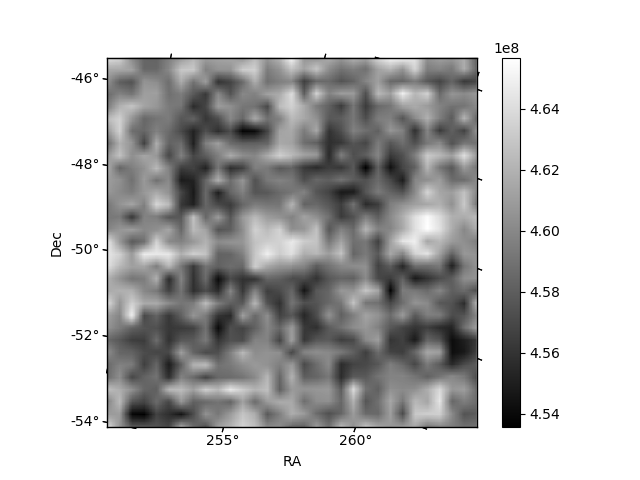
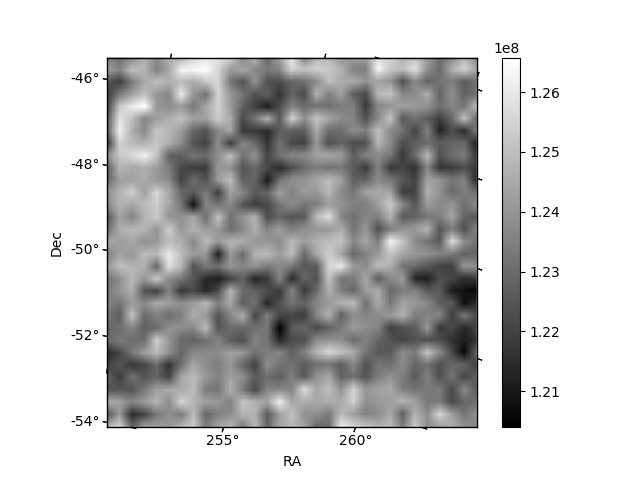
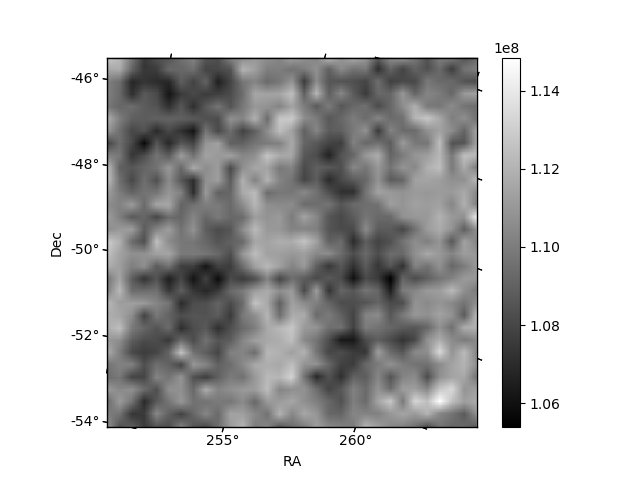
Histogram calculated using DETX and DETY for each event in the final _common_clean file
| Quadrant A |  |
 |
Quadrant B |
|---|---|---|---|
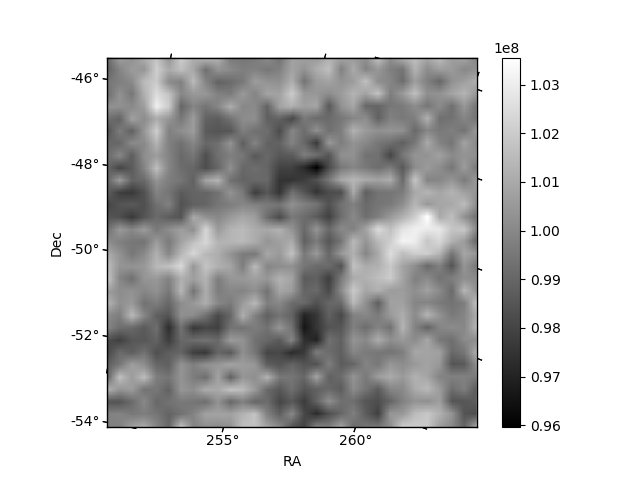
| Quadrant D | 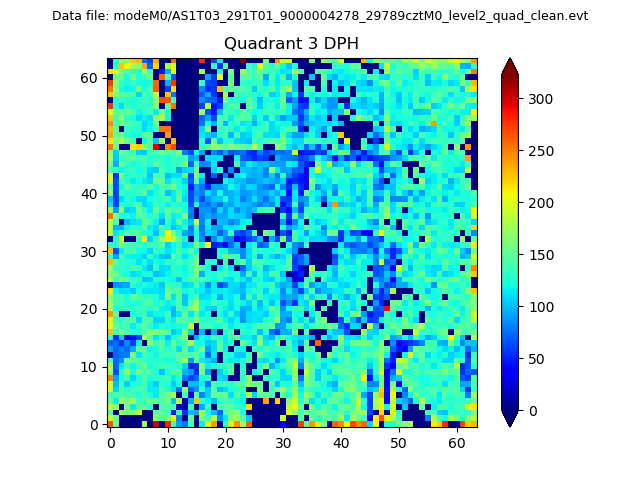 |
 |
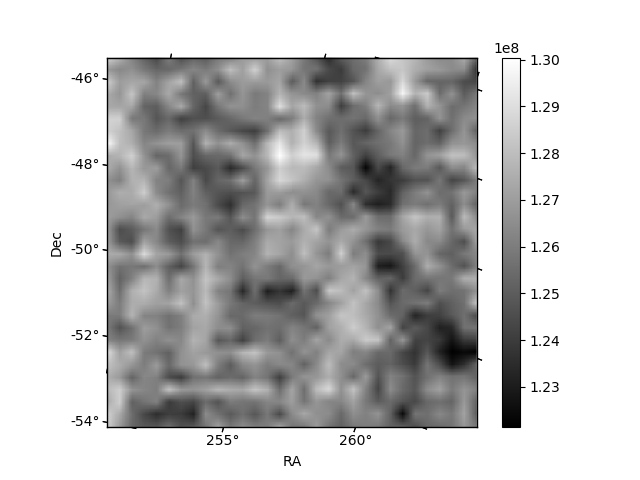
Quadrant C |
| Plot type | Count rate plots | Images |
|---|---|---|
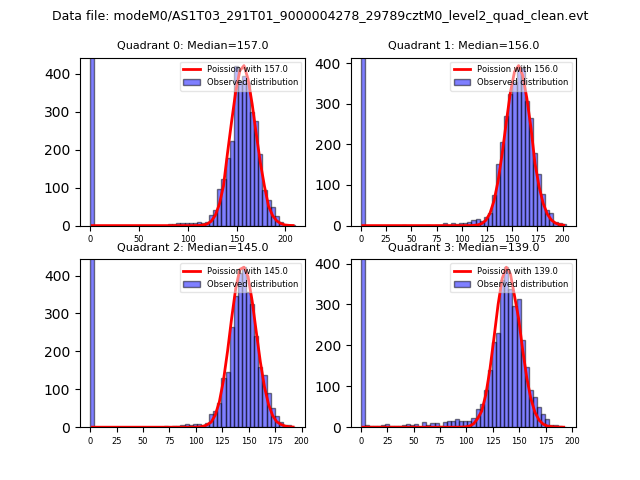
| Comparison with Poisson distribution Blue bars denote a histogram of data divided into 1 sec bins. Red curve is a Poisson curve with rate = median count rate of data. |
 |
 |
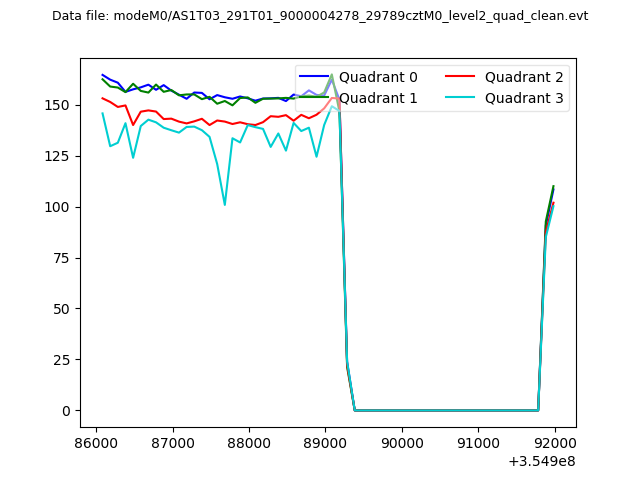
| Quadrant-wise count rates Data is divided into 100 sec bins |
 |
|
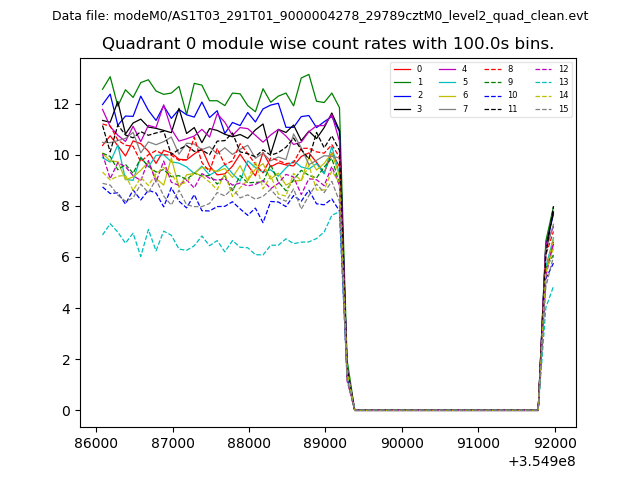
| Module-wise count rates for Quadrant A Data is divided into 100 sec bins |
 |
 |
| Module-wise count rates for Quadrant B Data is divided into 100 sec bins |
 |
 |
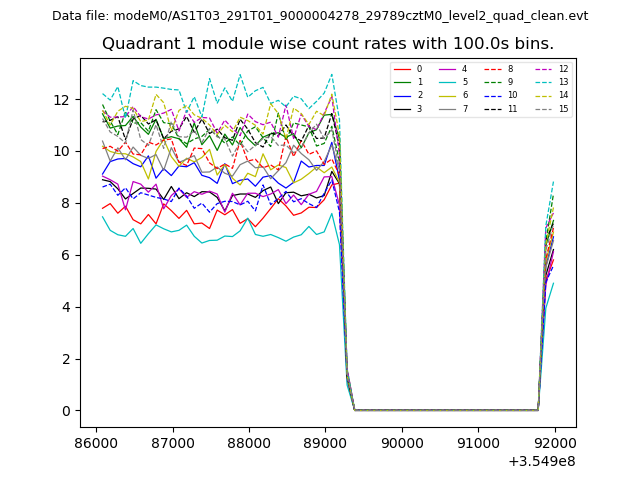
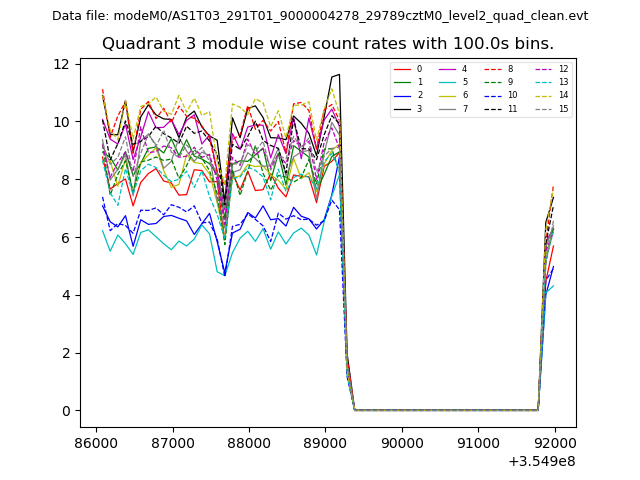
| Module-wise count rates for Quadrant C Data is divided into 100 sec bins |
 |
 |
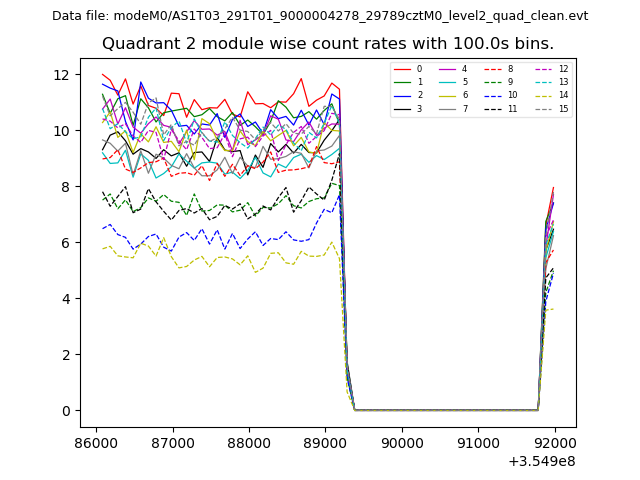
| Module-wise count rates for Quadrant D Data is divided into 100 sec bins |
 |
 |
| Parameter | Plot |
|---|---|
| CZT HV Monitor | 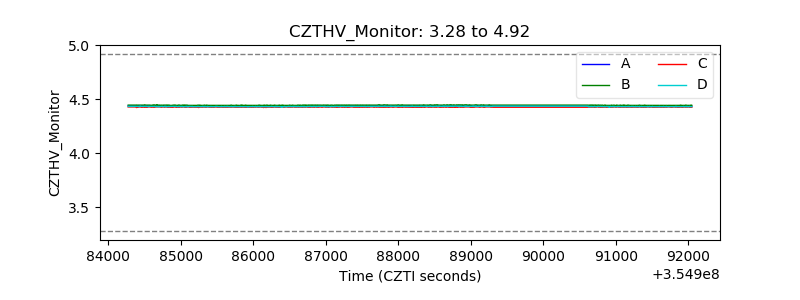 |
| D_VDD | 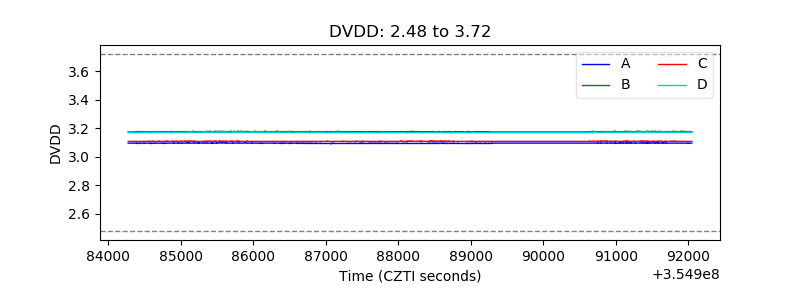 |
| Temperature 1 | 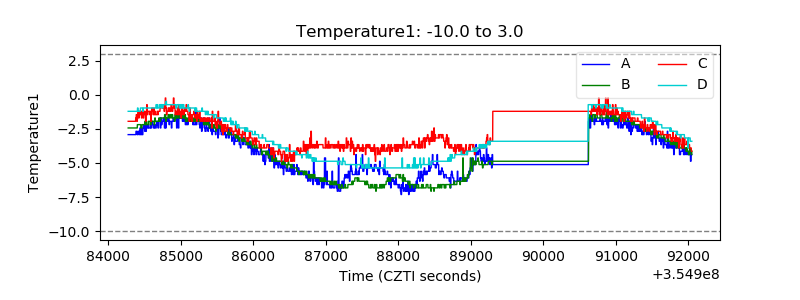 |
| Veto HV Monitor |  |
| Veto LLD | 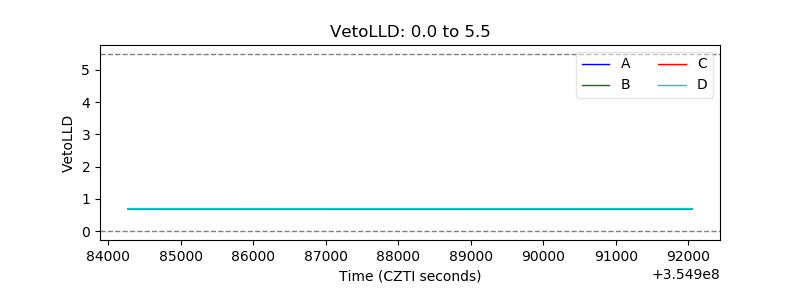 |
| Alpha Counter | 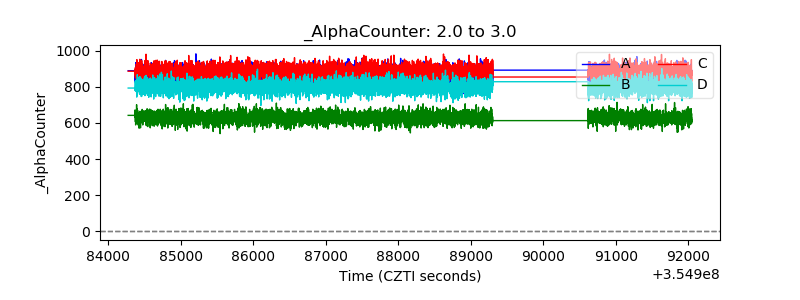 |
| _CPM_Rate | 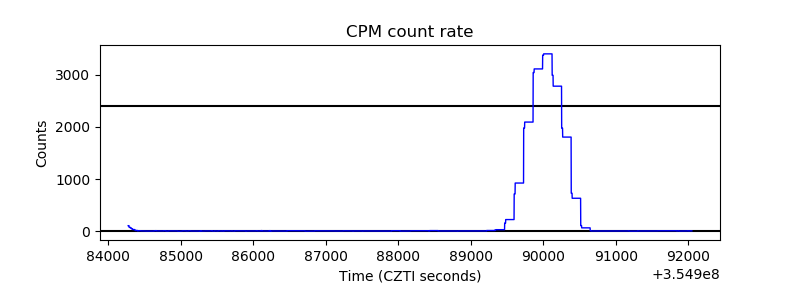 |
| CZT Counter | 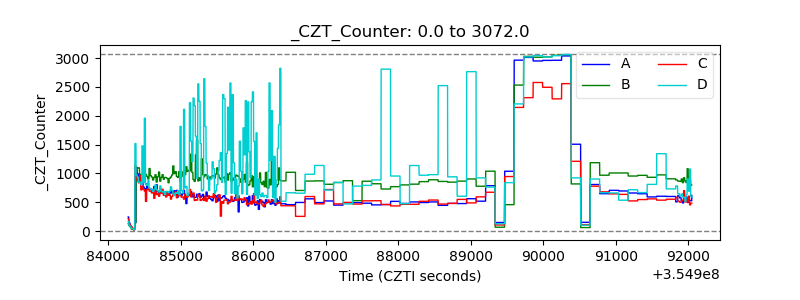 |
| +2.5 Volts monitor |  |
| +5 Volts monitor | 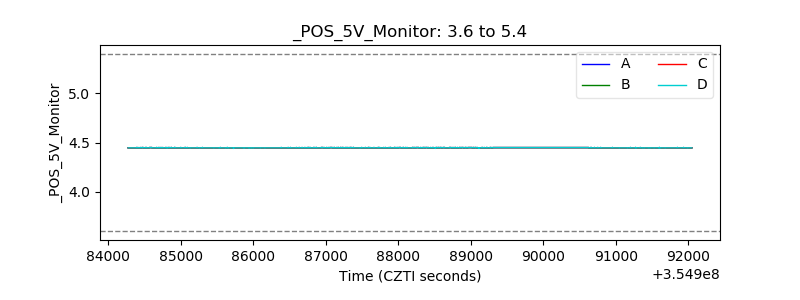 |
| _ROLL_ROT | 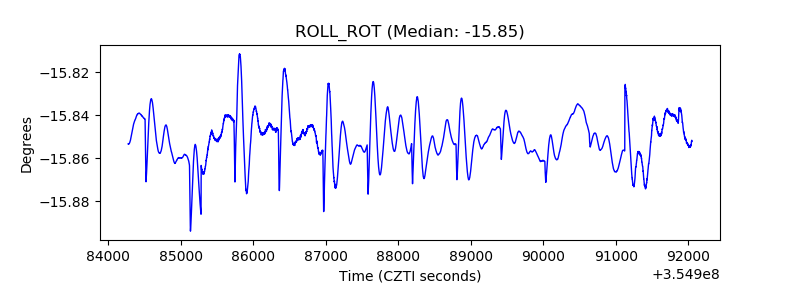 |
| _Roll_DEC | 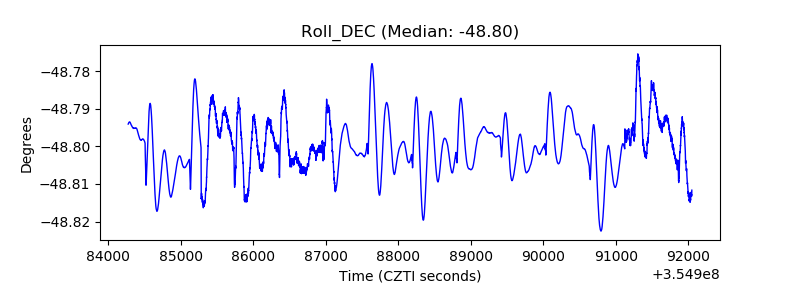 |
| _Roll_RA | 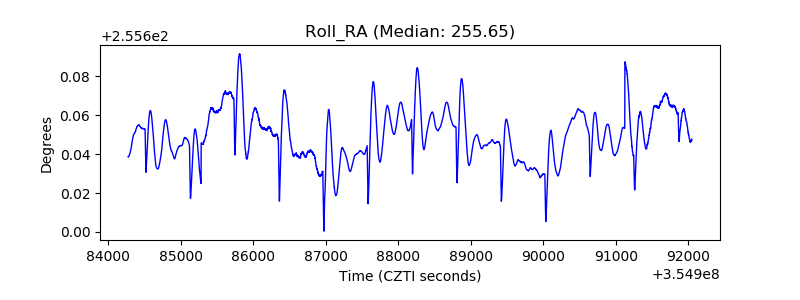 |
| Veto Counter | 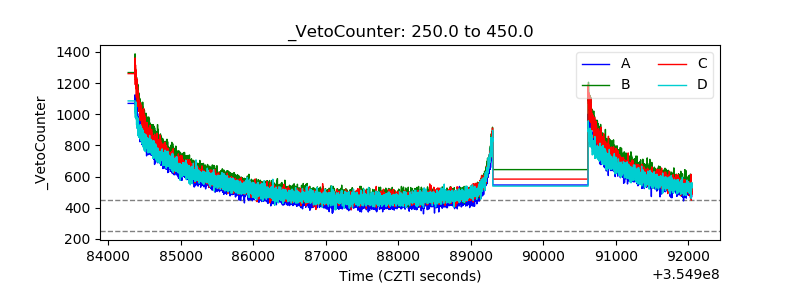 |