| Param | Original file | Final file |
|---|---|---|
| Filename | modeM0/AS1T03_291T01_9000004278_29791cztM0_level2.evt | modeM0/AS1T03_291T01_9000004278_29791cztM0_level2_quad_clean.evt |
| Size (bytes) | 546,546,240 | 103,956,480 |
| Size | 521.2 MB | 99.1 MB |
| Events in quadrant A | 3,286,141 | 703,611 |
| Events in quadrant B | 5,393,468 | 703,597 |
| Events in quadrant C | 3,290,843 | 663,039 |
| Events in quadrant D | 4,154,019 | 637,249 |
| Mode SS | |||
|---|---|---|---|
| Quadrant | BADHDUFLAG | Total packets | Discarded packets |
| A | 0 | 128 | 0 |
| B | 0 | 128 | 0 |
| C | 0 | 128 | 0 |
| D | 0 | 128 | 0 |
| Mode M0 | |||
|---|---|---|---|
| Quadrant | BADHDUFLAG | Total packets | Discarded packets |
| A | 0 | 13636 | 2 |
| B | 0 | 19994 | 3 |
| C | 0 | 13525 | 2 |
| D | 0 | 16527 | 2 |
| Mode M9 | |||
|---|---|---|---|
| Quadrant | BADHDUFLAG | Total packets | Discarded packets |
| A | 0 | 17 | 0 |
| B | 0 | 18 | 0 |
| C | 0 | 18 | 0 |
| D | 0 | 18 | 0 |
| Quadrant | Total seconds | Saturated seconds | Saturation percentage |
|---|---|---|---|
| A | 6312 | 61 | 0.966413% |
| B | 6311 | 176 | 2.788781% |
| C | 6311 | 88 | 1.394391% |
| D | 6311 | 106 | 1.679607% |
Noise dominated data is calculated using 1-second bins in cleaned event files. If a bin has >2000 counts, and if more than 50% of those come from <1% of pixels, then it is considered to be noise-dominated and hence unusable.
| Quadrant | # 1 sec bins | Bins with >0 counts | Bins with >2000 counts | High rate bins dominated by noise | Noise dominated (total time) | Noise dominated (detector-on time) | Marked lightcurve |
|---|---|---|---|---|---|---|---|
| A | 7537 | 6313 | 9 | 9 | 0.12% | 0.14% | 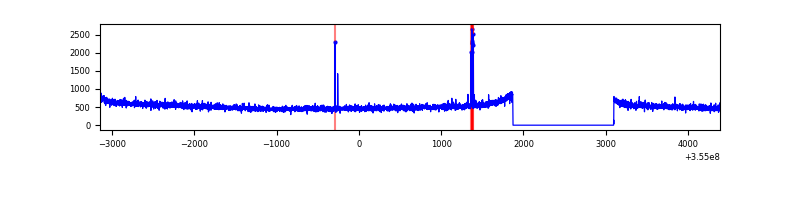 |
| B | 7536 | 6312 | 12 | 12 | 0.16% | 0.19% | 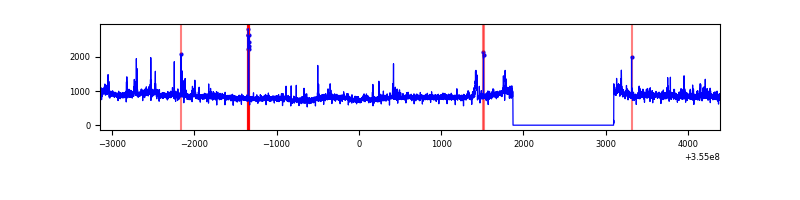 |
| C | 7536 | 6312 | 0 | 0 | 0.00% | 0.00% | 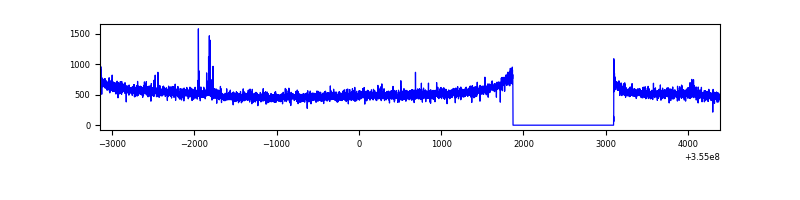 |
| D | 7536 | 6312 | 79 | 79 | 1.05% | 1.25% | 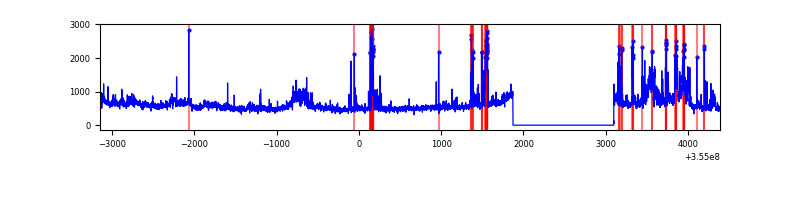 |
Top three noisy pixels from each quadrant. If the there are fewer than three noisy pixels in the level2.evt file, extra rows are filled as -1
| Pixel properties | Quadrant properties | ||||||
|---|---|---|---|---|---|---|---|
| Quadrant | DetID | PixID | Counts | Sigma | Mean | Median | Sigma |
| A | 12 | 96 | 36098 | 213.15 | 842 | 828 | 165.5 |
| A | 13 | 254 | 12264 | 69.11 | 842 | 828 | 165.5 |
| A | 3 | 137 | 8028 | 43.51 | 842 | 828 | 165.5 |
| B | 6 | 159 | 1891601 | 12135.16 | 835 | 815 | 155.8 |
| B | 0 | 229 | 153425 | 979.46 | 835 | 815 | 155.8 |
| B | 0 | 190 | 25068 | 155.66 | 835 | 815 | 155.8 |
| C | 14 | 238 | 139141 | 756.35 | 796 | 801 | 182.9 |
| C | 2 | 114 | 15338 | 79.48 | 796 | 801 | 182.9 |
| C | 3 | 233 | 14727 | 76.14 | 796 | 801 | 182.9 |
| D | 8 | 195 | 450271 | 2419.79 | 795 | 774 | 185.8 |
| D | 7 | 80 | 158709 | 850.22 | 795 | 774 | 185.8 |
| D | 12 | 33 | 156620 | 838.97 | 795 | 774 | 185.8 |
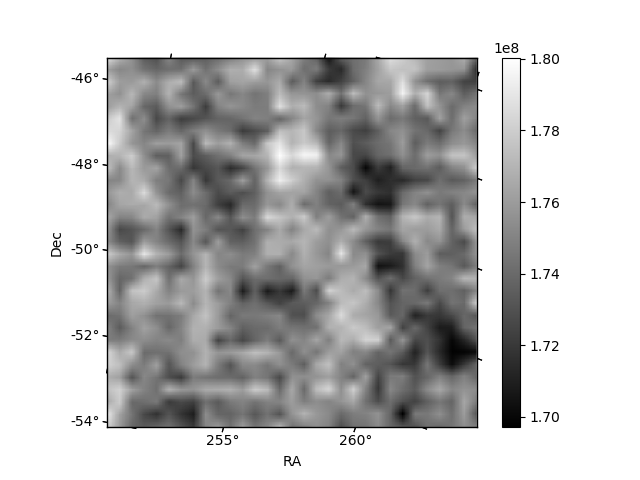
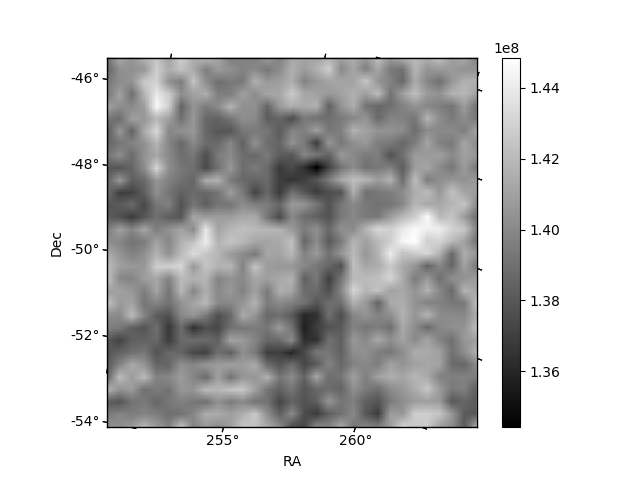
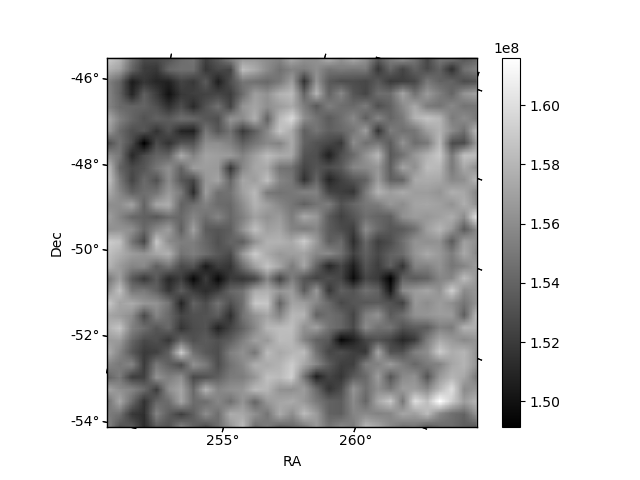
Histogram calculated using DETX and DETY for each event in the final _common_clean file
| Quadrant A |  |
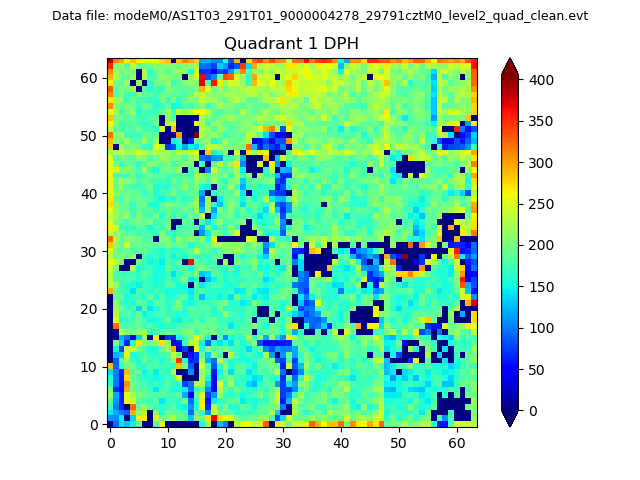 |
Quadrant B |
|---|---|---|---|
| Quadrant D |  |
 |
Quadrant C |
| Plot type | Count rate plots | Images |
|---|---|---|
| Comparison with Poisson distribution Blue bars denote a histogram of data divided into 1 sec bins. Red curve is a Poisson curve with rate = median count rate of data. |
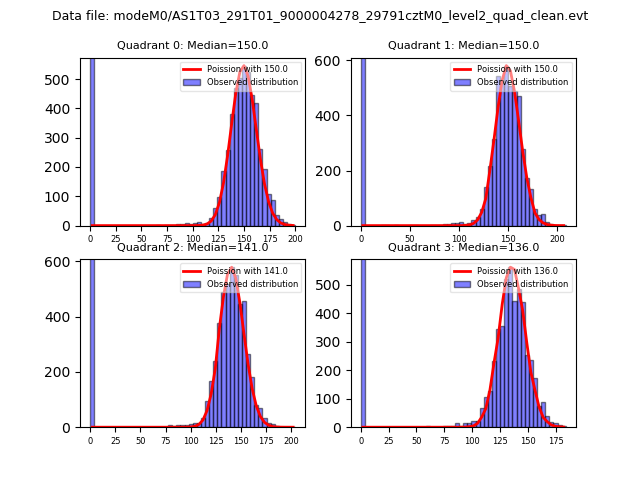 |
 |
| Quadrant-wise count rates Data is divided into 100 sec bins |
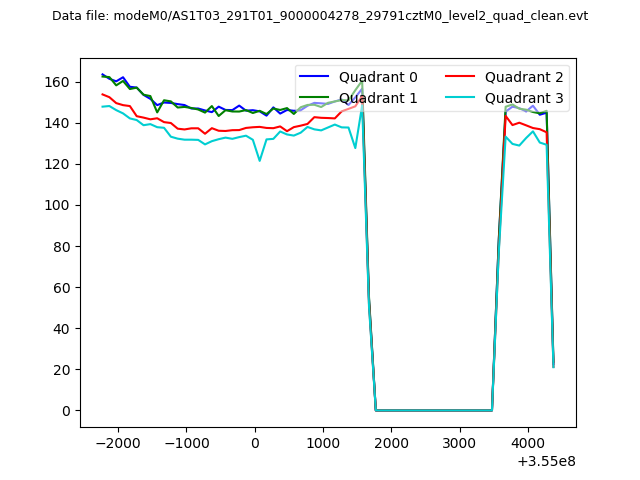 |
|
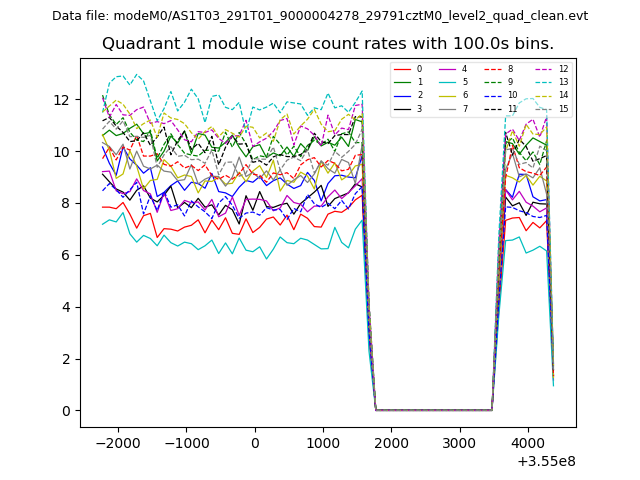
| Module-wise count rates for Quadrant A Data is divided into 100 sec bins |
 |
 |
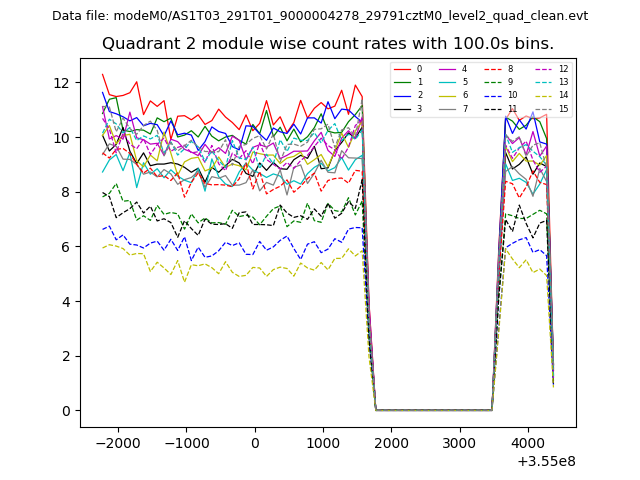
| Module-wise count rates for Quadrant B Data is divided into 100 sec bins |
 |
 |
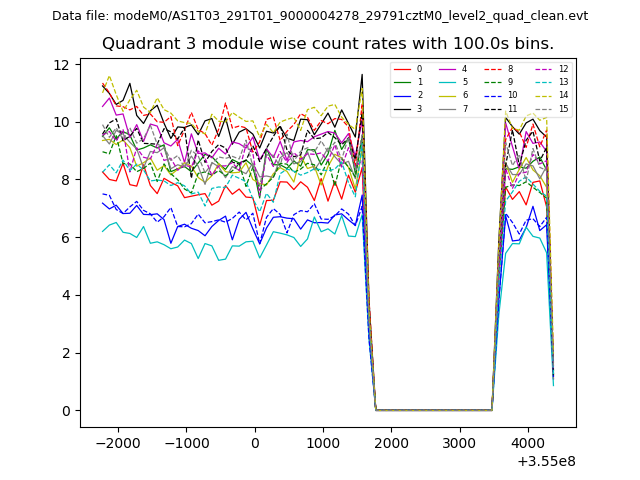
| Module-wise count rates for Quadrant C Data is divided into 100 sec bins |
 |
 |
| Module-wise count rates for Quadrant D Data is divided into 100 sec bins |
 |
 |
| Parameter | Plot |
|---|---|
| CZT HV Monitor | 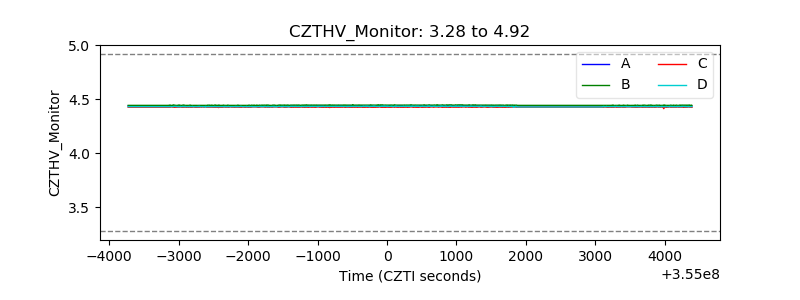 |
| D_VDD | 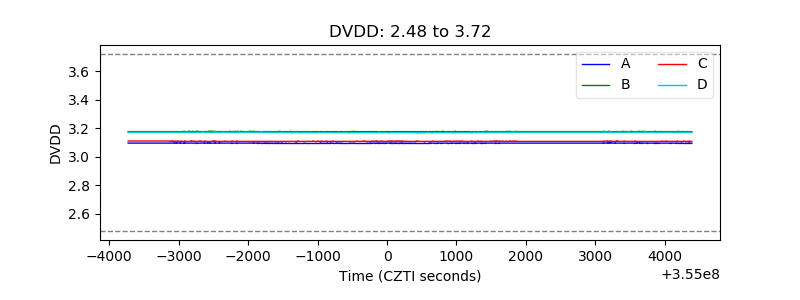 |
| Temperature 1 | 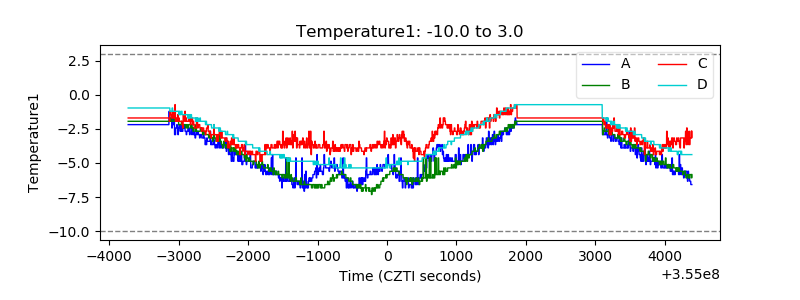 |
| Veto HV Monitor | 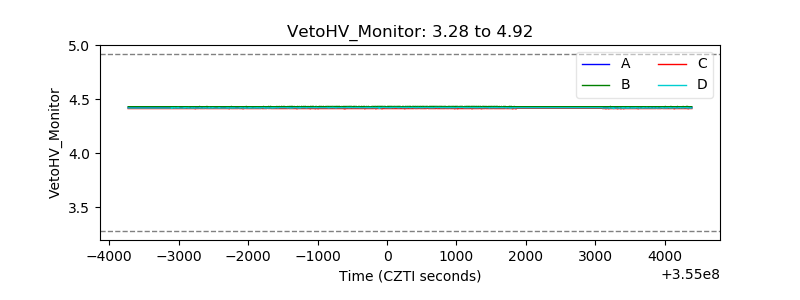 |
| Veto LLD | 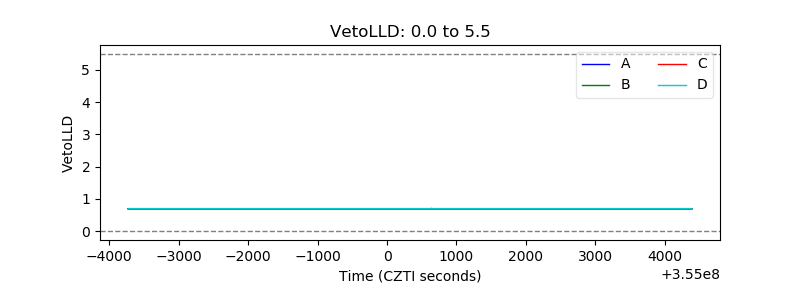 |
| Alpha Counter | 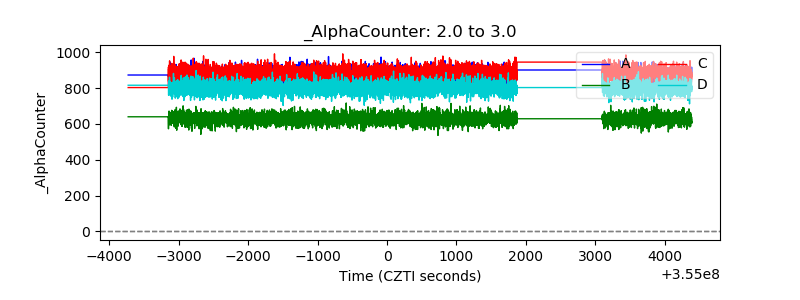 |
| _CPM_Rate | 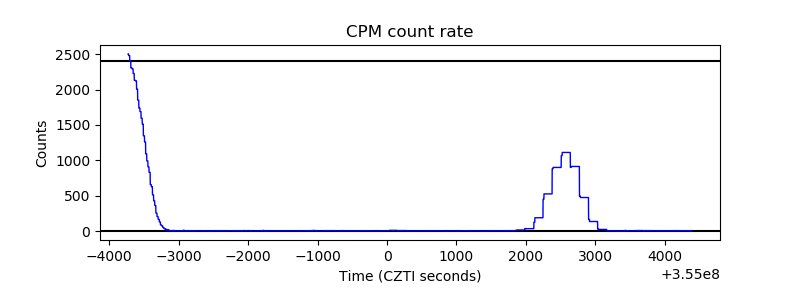 |
| CZT Counter |  |
| +2.5 Volts monitor |  |
| +5 Volts monitor | 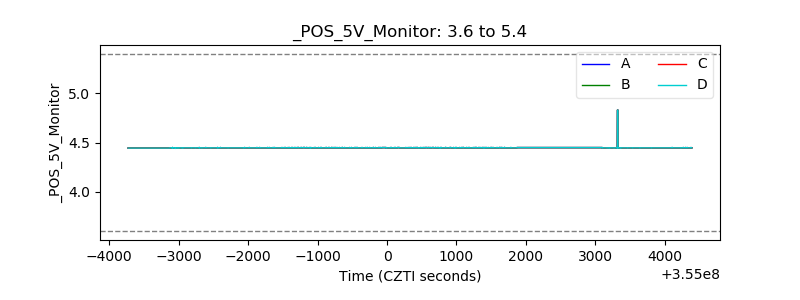 |
| _ROLL_ROT | 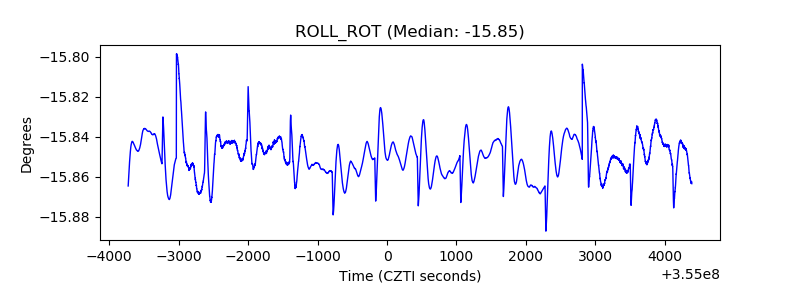 |
| _Roll_DEC | 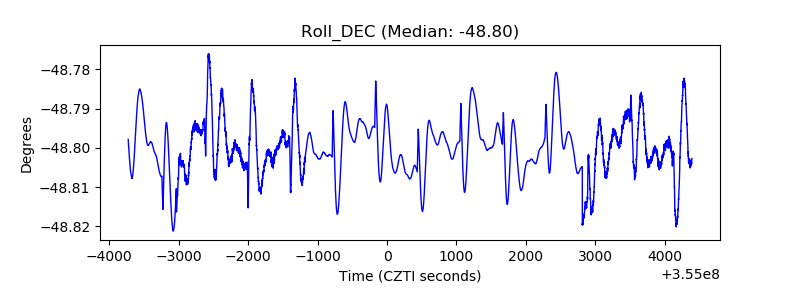 |
| _Roll_RA |  |
| Veto Counter | 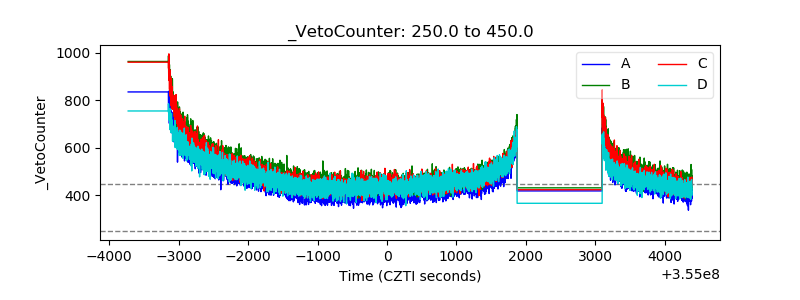 |