| Param | Original file | Final file |
|---|---|---|
| Filename | modeM0/AS1T03_291T01_9000004278_29793cztM0_level2.evt | modeM0/AS1T03_291T01_9000004278_29793cztM0_level2_quad_clean.evt |
| Size (bytes) | 1,440,270,720 | 275,149,440 |
| Size | 1.3 GB | 262.4 MB |
| Events in quadrant A | 8,193,603 | 1,864,076 |
| Events in quadrant B | 14,202,926 | 1,852,107 |
| Events in quadrant C | 8,616,157 | 1,769,111 |
| Events in quadrant D | 11,473,945 | 1,690,325 |
| Mode SS | |||
|---|---|---|---|
| Quadrant | BADHDUFLAG | Total packets | Discarded packets |
| A | 0 | 340 | 0 |
| B | 0 | 340 | 0 |
| C | 0 | 340 | 0 |
| D | 0 | 340 | 0 |
| Mode M0 | |||
|---|---|---|---|
| Quadrant | BADHDUFLAG | Total packets | Discarded packets |
| A | 0 | 34944 | 3 |
| B | 0 | 53560 | 3 |
| C | 0 | 35840 | 3 |
| D | 0 | 45021 | 3 |
| Mode M9 | |||
|---|---|---|---|
| Quadrant | BADHDUFLAG | Total packets | Discarded packets |
| A | 0 | 25 | 0 |
| B | 0 | 25 | 0 |
| C | 0 | 25 | 0 |
| D | 0 | 25 | 0 |
| Quadrant | Total seconds | Saturated seconds | Saturation percentage |
|---|---|---|---|
| A | 16802 | 136 | 0.809427% |
| B | 16803 | 668 | 3.975481% |
| C | 16803 | 267 | 1.589002% |
| D | 16803 | 637 | 3.790990% |
Noise dominated data is calculated using 1-second bins in cleaned event files. If a bin has >2000 counts, and if more than 50% of those come from <1% of pixels, then it is considered to be noise-dominated and hence unusable.
| Quadrant | # 1 sec bins | Bins with >0 counts | Bins with >2000 counts | High rate bins dominated by noise | Noise dominated (total time) | Noise dominated (detector-on time) | Marked lightcurve |
|---|---|---|---|---|---|---|---|
| A | 19307 | 16805 | 9 | 9 | 0.05% | 0.05% | 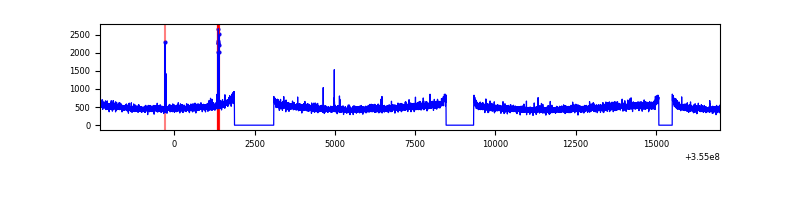 |
| B | 19308 | 16806 | 216 | 216 | 1.12% | 1.29% |  |
| C | 19308 | 16806 | 4 | 4 | 0.02% | 0.02% | 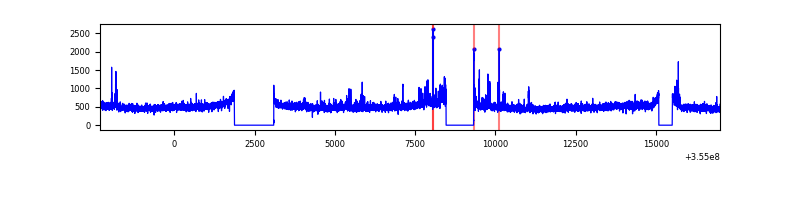 |
| D | 19308 | 16806 | 549 | 549 | 2.84% | 3.27% | 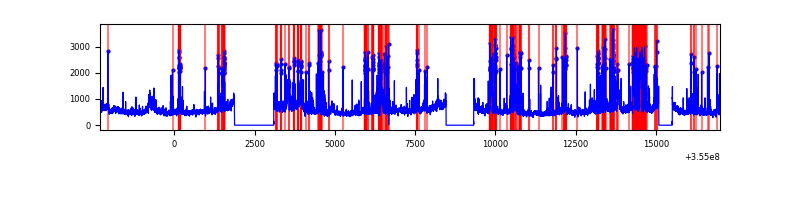 |
Top three noisy pixels from each quadrant. If the there are fewer than three noisy pixels in the level2.evt file, extra rows are filled as -1
| Pixel properties | Quadrant properties | ||||||
|---|---|---|---|---|---|---|---|
| Quadrant | DetID | PixID | Counts | Sigma | Mean | Median | Sigma |
| A | 12 | 96 | 37786 | 85.69 | 2108 | 2069 | 416.8 |
| A | 13 | 254 | 33422 | 75.22 | 2108 | 2069 | 416.8 |
| A | 5 | 168 | 24835 | 54.62 | 2108 | 2069 | 416.8 |
| B | 6 | 159 | 4971288 | 12709.15 | 2082 | 2027 | 391.0 |
| B | 0 | 229 | 974605 | 2487.42 | 2082 | 2027 | 391.0 |
| B | 12 | 111 | 47268 | 115.71 | 2082 | 2027 | 391.0 |
| C | 14 | 238 | 339245 | 726.93 | 2016 | 2029 | 463.9 |
| C | 3 | 233 | 324148 | 694.38 | 2016 | 2029 | 463.9 |
| C | 10 | 22 | 46625 | 96.13 | 2016 | 2029 | 463.9 |
| D | 7 | 80 | 1723254 | 3719.77 | 1991 | 1942 | 462.7 |
| D | 8 | 195 | 1134948 | 2448.43 | 1991 | 1942 | 462.7 |
| D | 12 | 227 | 234365 | 502.27 | 1991 | 1942 | 462.7 |
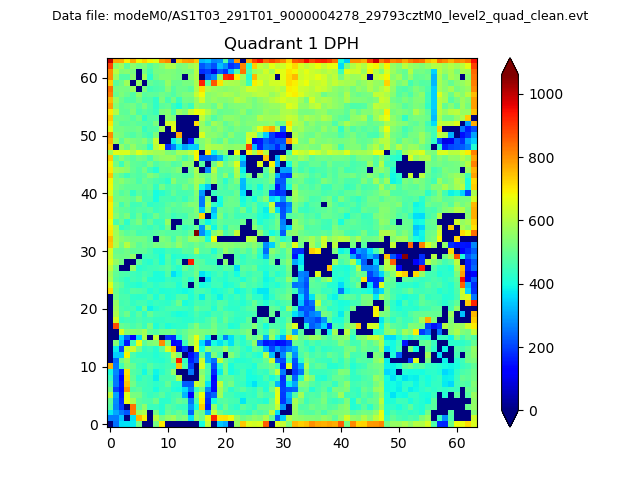
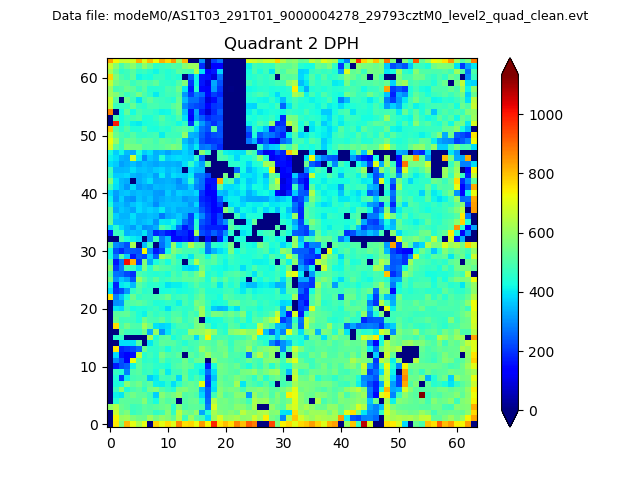
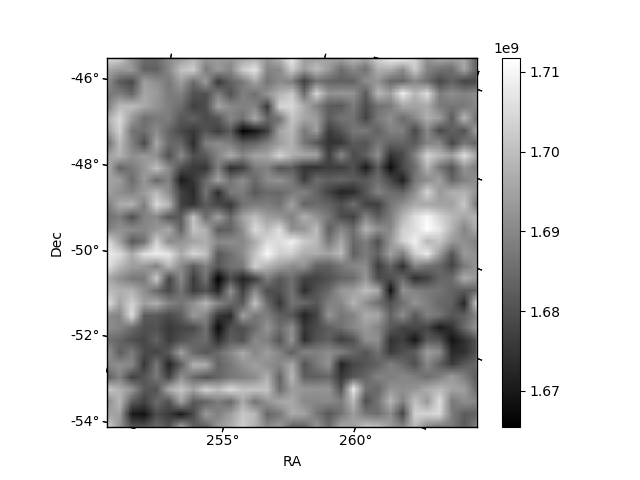
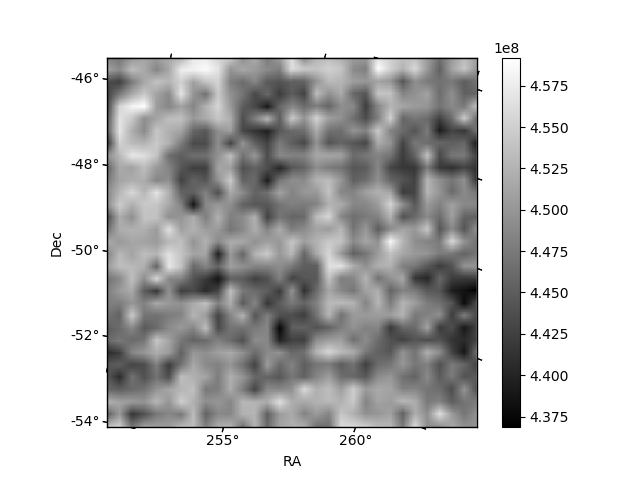
Histogram calculated using DETX and DETY for each event in the final _common_clean file
| Quadrant A | 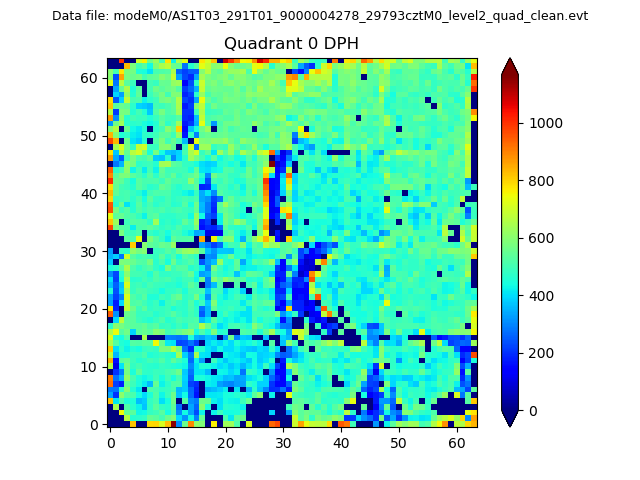 |
 |
Quadrant B |
|---|---|---|---|
| Quadrant D | 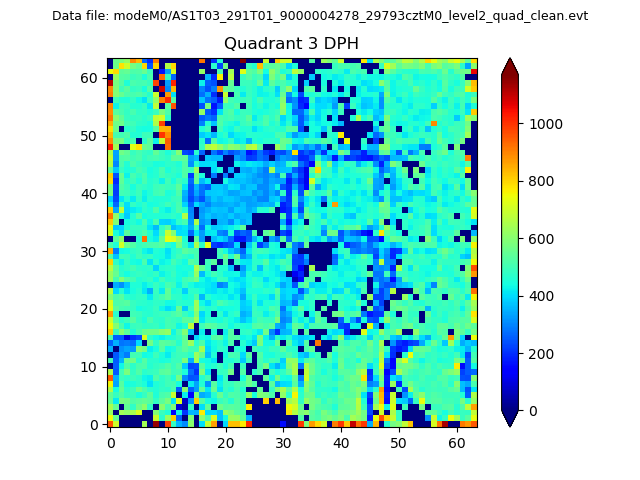 |
 |
Quadrant C |
| Plot type | Count rate plots | Images |
|---|---|---|
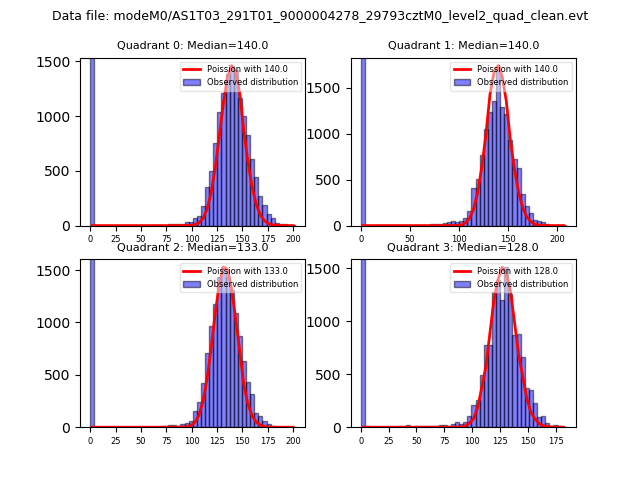
| Comparison with Poisson distribution Blue bars denote a histogram of data divided into 1 sec bins. Red curve is a Poisson curve with rate = median count rate of data. |
 |
 |
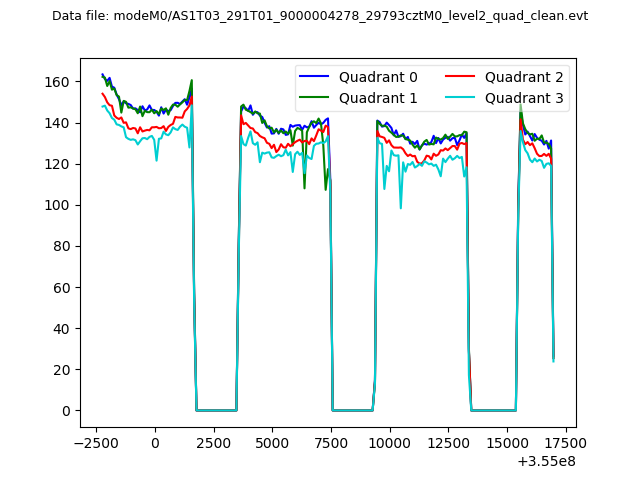
| Quadrant-wise count rates Data is divided into 100 sec bins |
 |
|
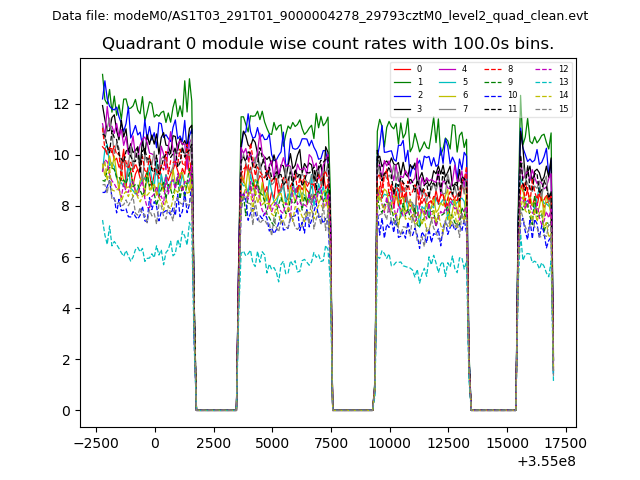
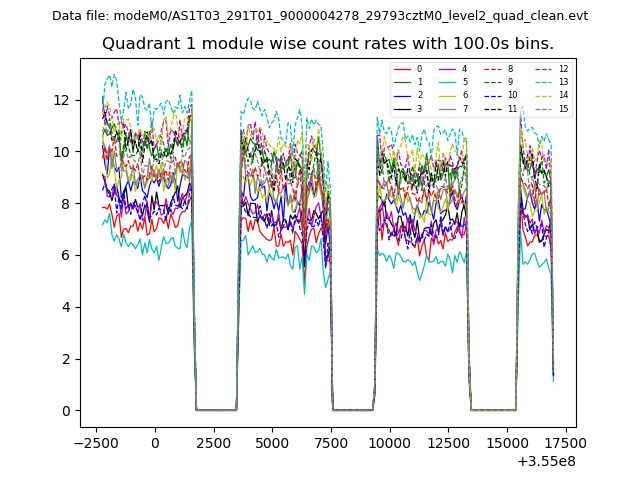
| Module-wise count rates for Quadrant A Data is divided into 100 sec bins |
 |
 |
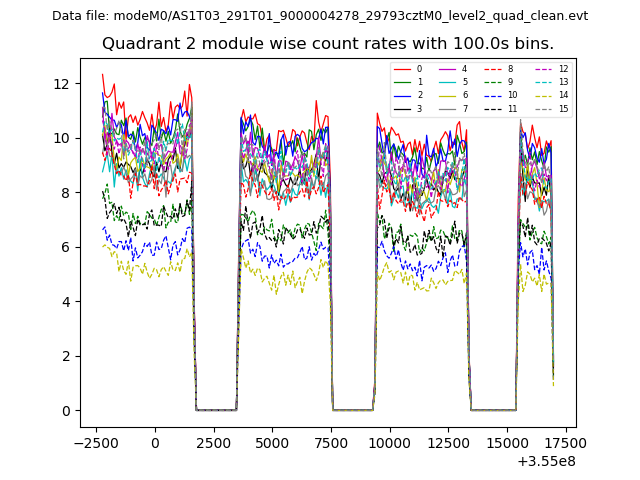
| Module-wise count rates for Quadrant B Data is divided into 100 sec bins |
 |
 |
| Module-wise count rates for Quadrant C Data is divided into 100 sec bins |
 |
 |
| Module-wise count rates for Quadrant D Data is divided into 100 sec bins |
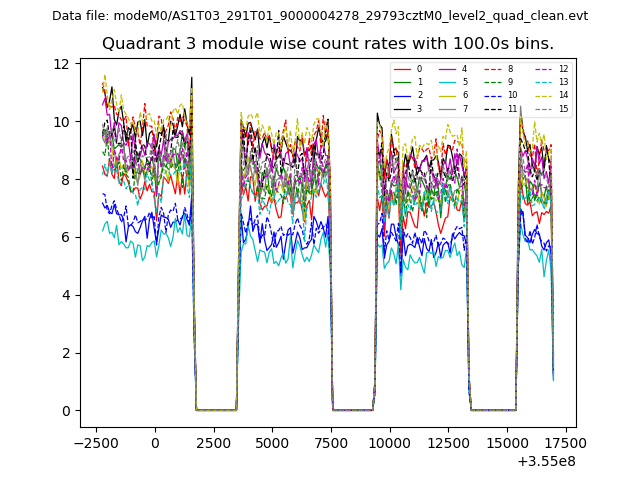 |
 |
| Parameter | Plot |
|---|---|
| CZT HV Monitor | 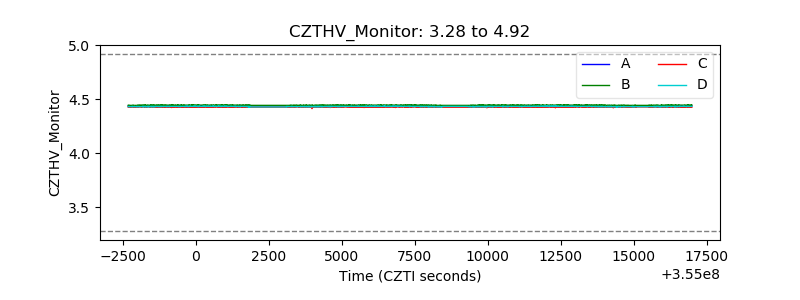 |
| D_VDD | 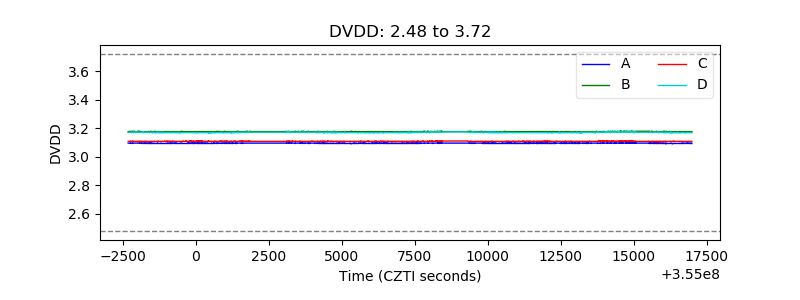 |
| Temperature 1 | 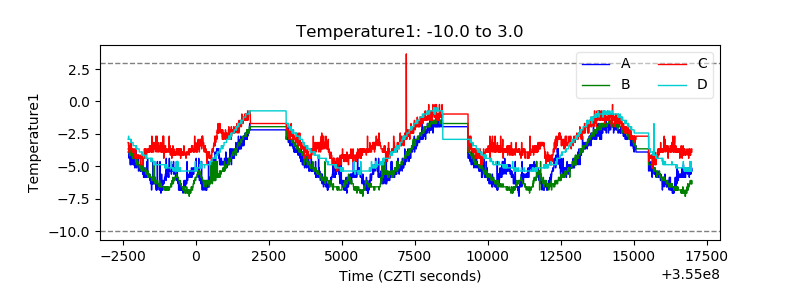 |
| Veto HV Monitor | 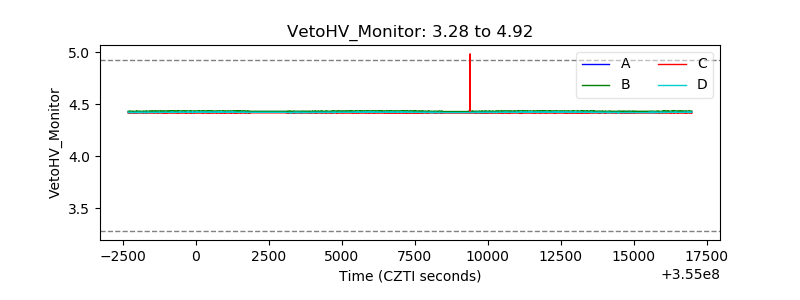 |
| Veto LLD | 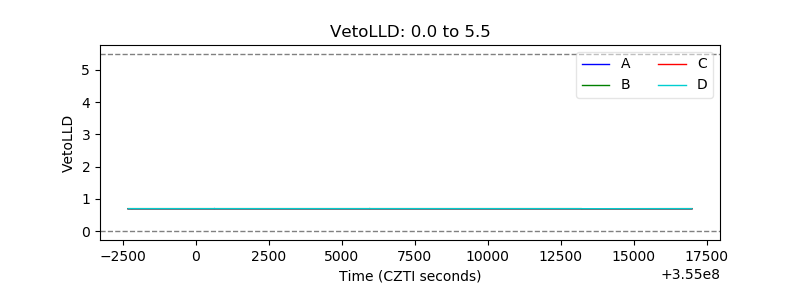 |
| Alpha Counter | 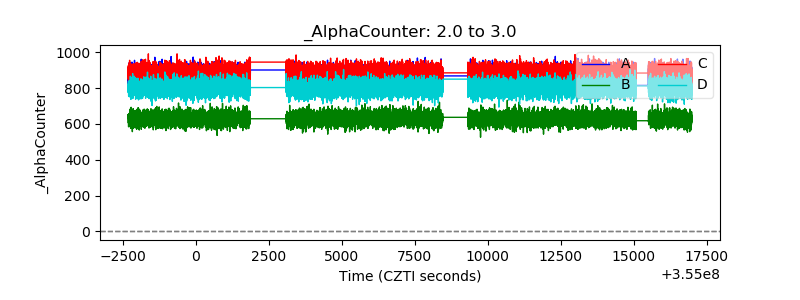 |
| _CPM_Rate | 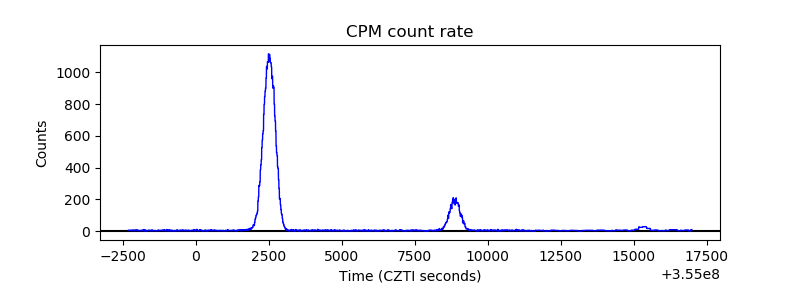 |
| CZT Counter | 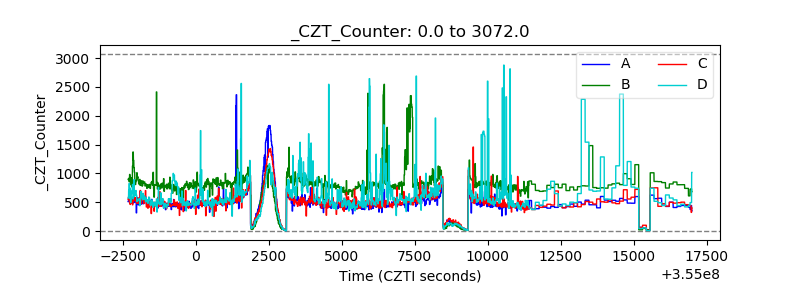 |
| +2.5 Volts monitor |  |
| +5 Volts monitor |  |
| _ROLL_ROT | 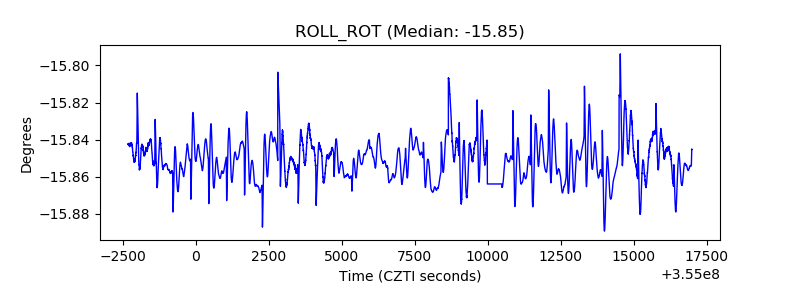 |
| _Roll_DEC | 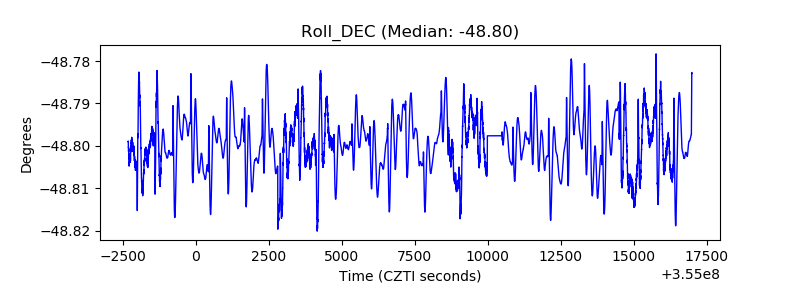 |
| _Roll_RA | 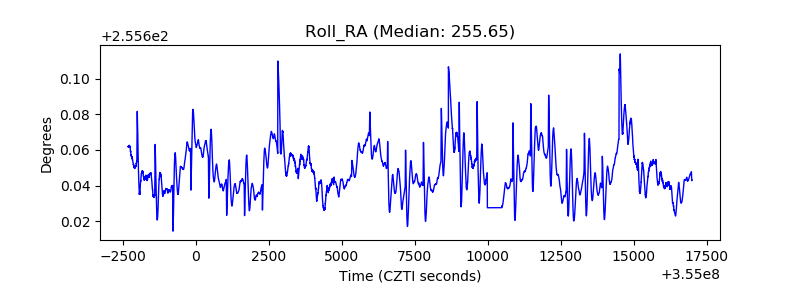 |
| Veto Counter |  |