| Param | Original file | Final file |
|---|---|---|
| Filename | modeM0/AS1T03_291T01_9000004278_29799cztM0_level2.evt | modeM0/AS1T03_291T01_9000004278_29799cztM0_level2_quad_clean.evt |
| Size (bytes) | 1,342,923,840 | 211,173,120 |
| Size | 1.3 GB | 201.4 MB |
| Events in quadrant A | 6,952,192 | 1,411,727 |
| Events in quadrant B | 11,738,830 | 1,406,615 |
| Events in quadrant C | 7,348,971 | 1,353,059 |
| Events in quadrant D | 13,642,919 | 1,212,072 |
| Mode SS | |||
|---|---|---|---|
| Quadrant | BADHDUFLAG | Total packets | Discarded packets |
| A | 0 | 298 | 0 |
| B | 0 | 298 | 0 |
| C | 0 | 298 | 0 |
| D | 0 | 298 | 0 |
| Mode M0 | |||
|---|---|---|---|
| Quadrant | BADHDUFLAG | Total packets | Discarded packets |
| A | 0 | 30221 | 3 |
| B | 0 | 45521 | 3 |
| C | 0 | 31049 | 3 |
| D | 0 | 49874 | 3 |
| Mode M9 | |||
|---|---|---|---|
| Quadrant | BADHDUFLAG | Total packets | Discarded packets |
| A | 0 | 8 | 0 |
| B | 0 | 8 | 0 |
| C | 0 | 8 | 0 |
| D | 0 | 8 | 0 |
| Quadrant | Total seconds | Saturated seconds | Saturation percentage |
|---|---|---|---|
| A | 14649 | 155 | 1.058093% |
| B | 14649 | 553 | 3.775002% |
| C | 14649 | 467 | 3.187931% |
| D | 14650 | 2492 | 17.010239% |
Noise dominated data is calculated using 1-second bins in cleaned event files. If a bin has >2000 counts, and if more than 50% of those come from <1% of pixels, then it is considered to be noise-dominated and hence unusable.
| Quadrant | # 1 sec bins | Bins with >0 counts | Bins with >2000 counts | High rate bins dominated by noise | Noise dominated (total time) | Noise dominated (detector-on time) | Marked lightcurve |
|---|---|---|---|---|---|---|---|
| A | 15324 | 14653 | 2 | 2 | 0.01% | 0.01% | 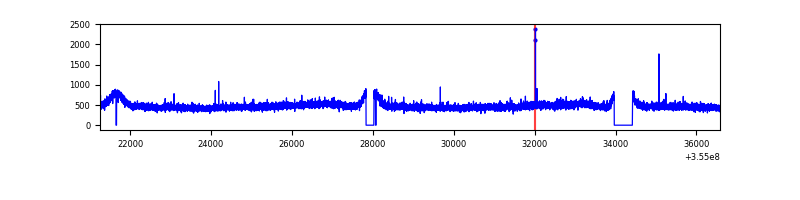 |
| B | 15324 | 14653 | 17 | 17 | 0.11% | 0.12% | 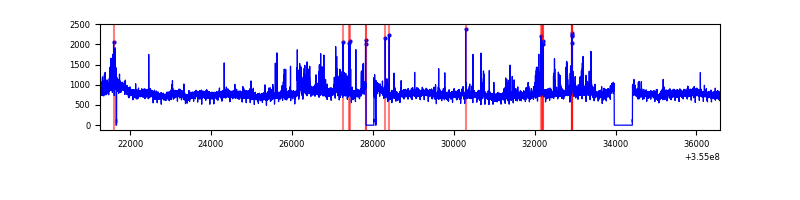 |
| C | 15324 | 14653 | 44 | 44 | 0.29% | 0.30% | 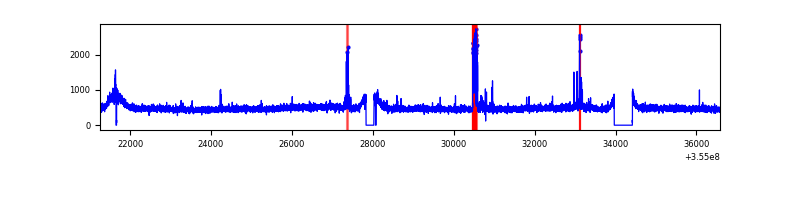 |
| D | 15325 | 14654 | 2277 | 2277 | 14.86% | 15.54% | 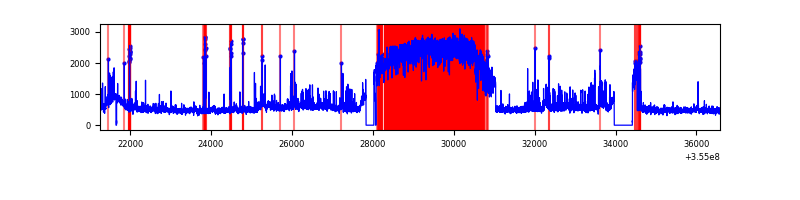 |
Top three noisy pixels from each quadrant. If the there are fewer than three noisy pixels in the level2.evt file, extra rows are filled as -1
| Pixel properties | Quadrant properties | ||||||
|---|---|---|---|---|---|---|---|
| Quadrant | DetID | PixID | Counts | Sigma | Mean | Median | Sigma |
| A | 13 | 254 | 31768 | 83.04 | 1794 | 1754 | 361.5 |
| A | 3 | 137 | 18456 | 46.21 | 1794 | 1754 | 361.5 |
| A | 12 | 96 | 16837 | 41.73 | 1794 | 1754 | 361.5 |
| B | 6 | 159 | 4252391 | 12615.27 | 1769 | 1725 | 336.9 |
| B | 0 | 229 | 484033 | 1431.41 | 1769 | 1725 | 336.9 |
| B | 12 | 111 | 42451 | 120.87 | 1769 | 1725 | 336.9 |
| C | 14 | 238 | 278380 | 686.69 | 1729 | 1738 | 402.9 |
| C | 10 | 22 | 259860 | 640.72 | 1729 | 1738 | 402.9 |
| C | 3 | 233 | 35920 | 84.85 | 1729 | 1738 | 402.9 |
| D | 7 | 238 | 5847191 | 14771.1 | 1673 | 1625 | 395.7 |
| D | 8 | 195 | 1036828 | 2615.84 | 1673 | 1625 | 395.7 |
| D | 2 | 250 | 122884 | 306.41 | 1673 | 1625 | 395.7 |
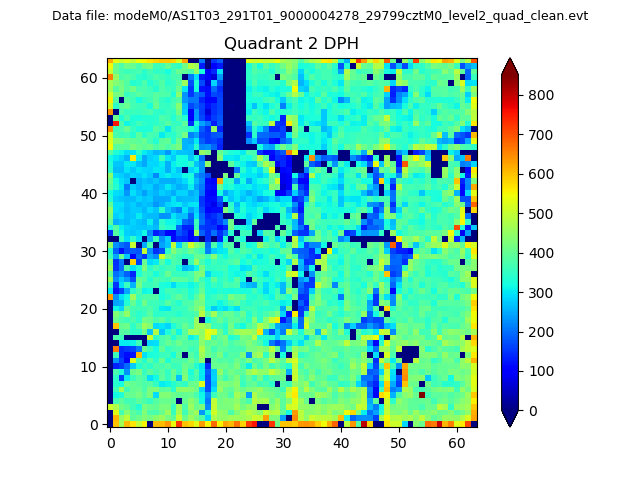
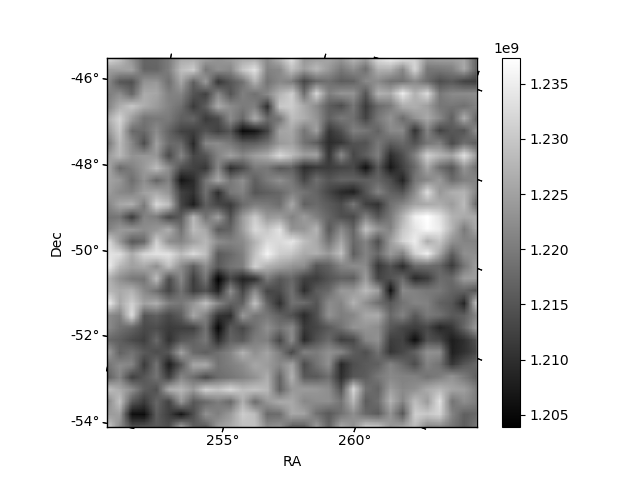
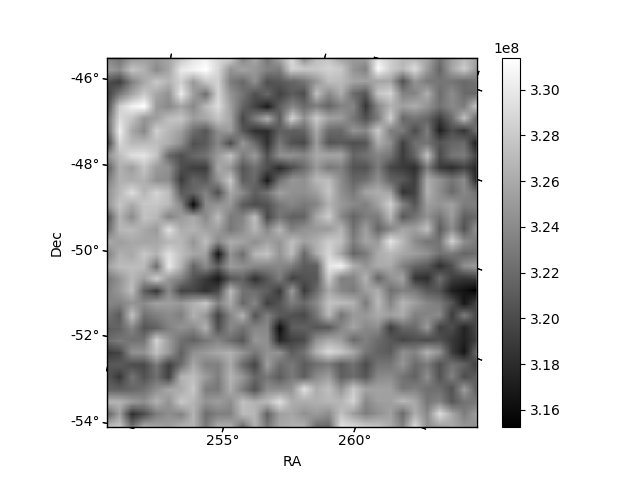
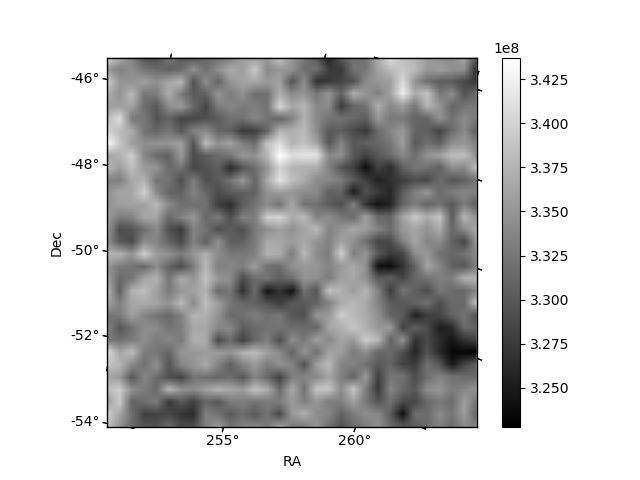
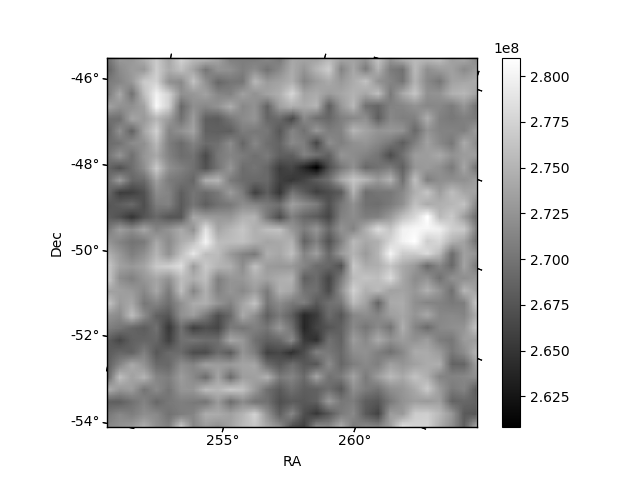
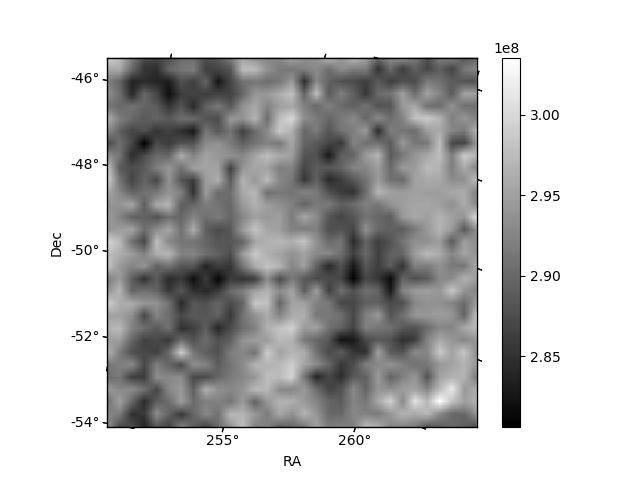
Histogram calculated using DETX and DETY for each event in the final _common_clean file
| Quadrant A | 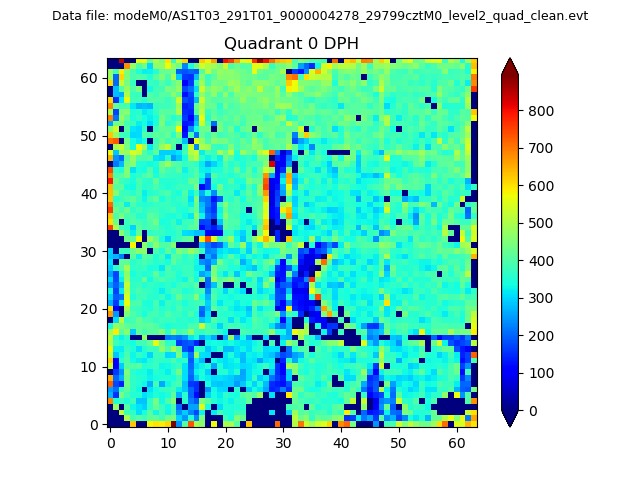 |
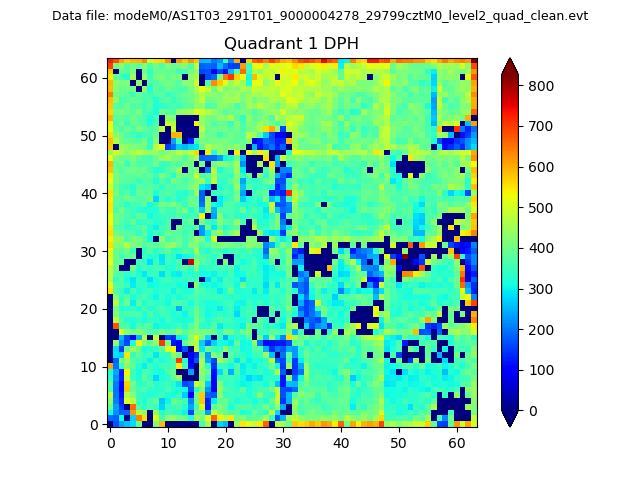 |
Quadrant B |
|---|---|---|---|
| Quadrant D | 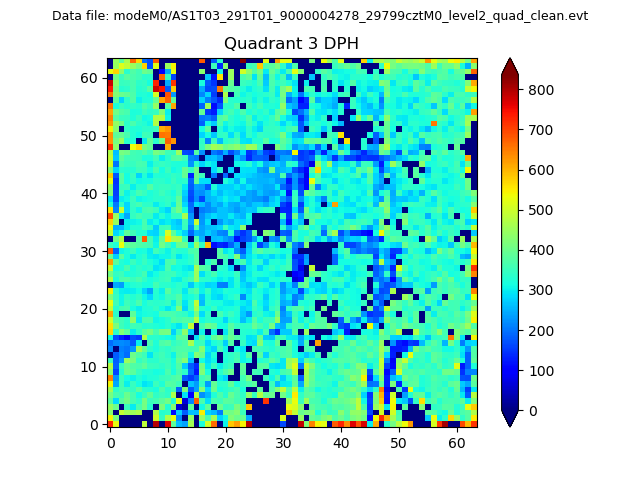 |
 |
Quadrant C |
| Plot type | Count rate plots | Images |
|---|---|---|
| Comparison with Poisson distribution Blue bars denote a histogram of data divided into 1 sec bins. Red curve is a Poisson curve with rate = median count rate of data. |
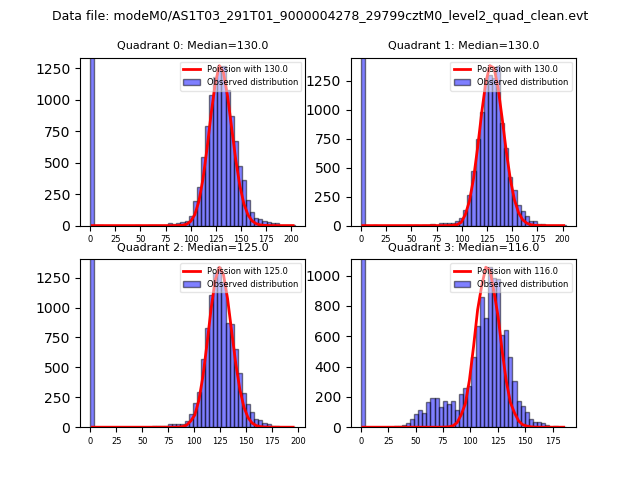 |
 |
| Quadrant-wise count rates Data is divided into 100 sec bins |
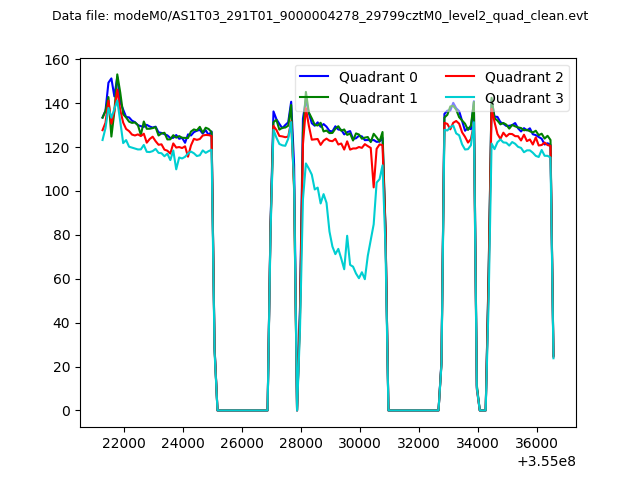 |
|
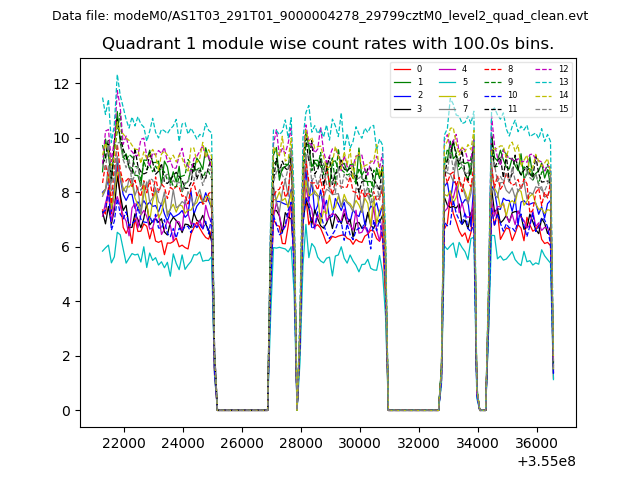
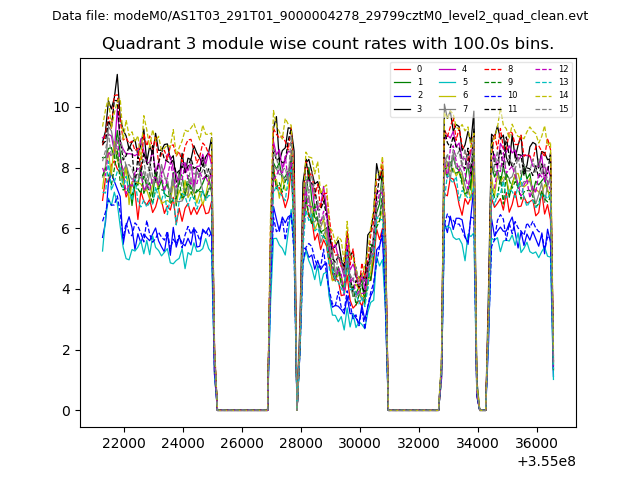
| Module-wise count rates for Quadrant A Data is divided into 100 sec bins |
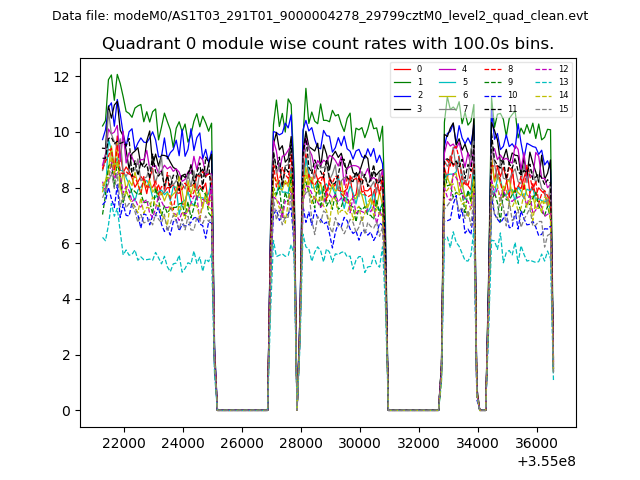 |
 |
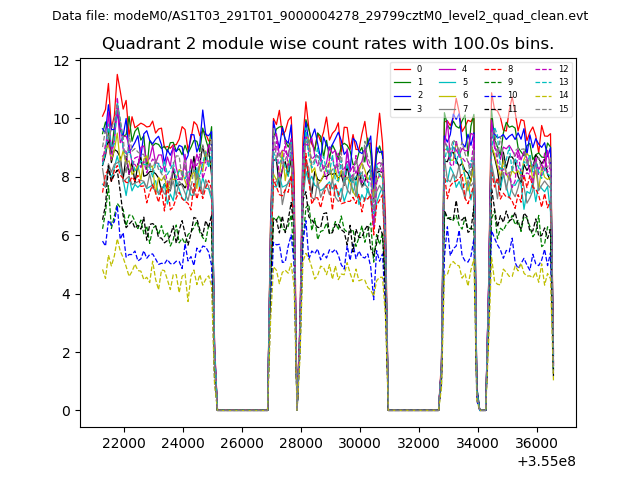
| Module-wise count rates for Quadrant B Data is divided into 100 sec bins |
 |
 |
| Module-wise count rates for Quadrant C Data is divided into 100 sec bins |
 |
 |
| Module-wise count rates for Quadrant D Data is divided into 100 sec bins |
 |
 |
| Parameter | Plot |
|---|---|
| CZT HV Monitor | 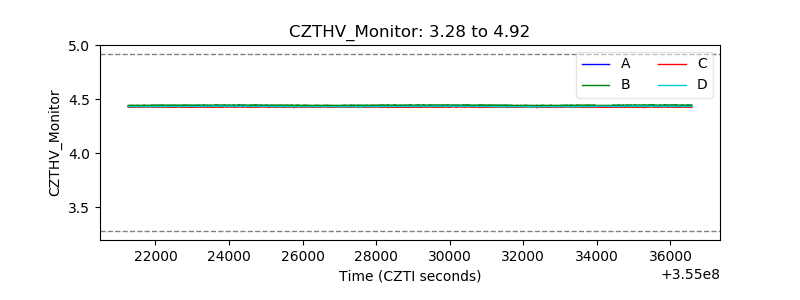 |
| D_VDD | 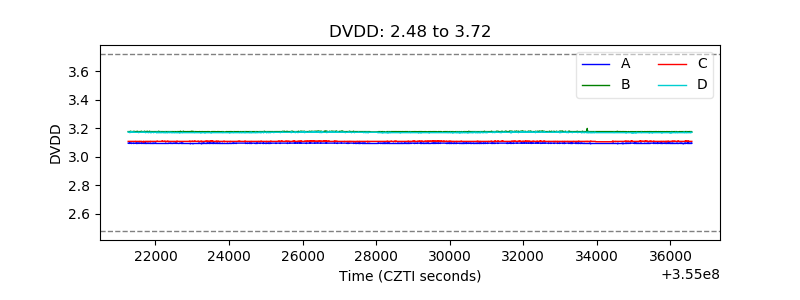 |
| Temperature 1 | 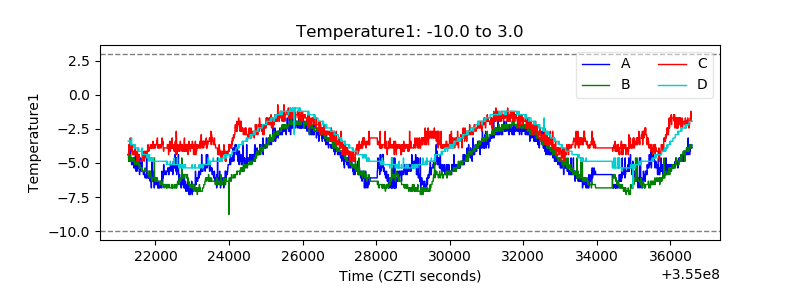 |
| Veto HV Monitor |  |
| Veto LLD |  |
| Alpha Counter | 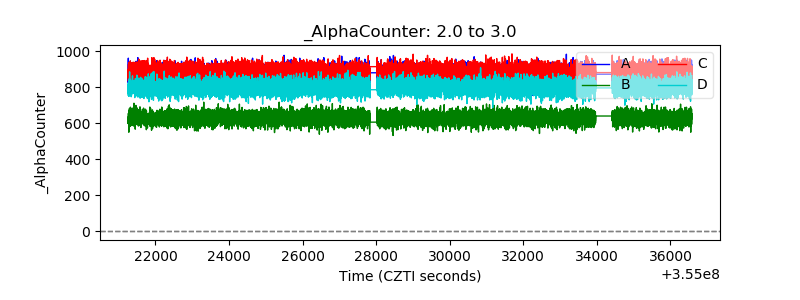 |
| _CPM_Rate |  |
| CZT Counter | 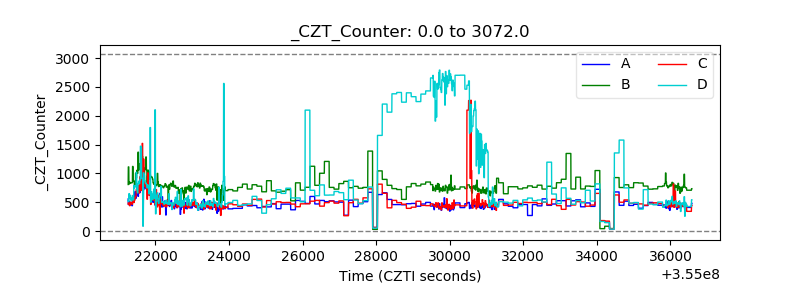 |
| +2.5 Volts monitor | 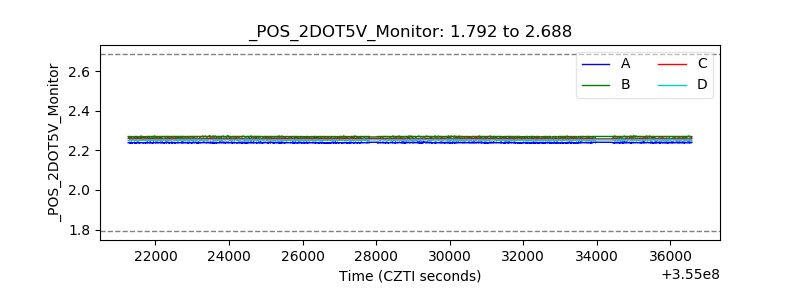 |
| +5 Volts monitor |  |
| _ROLL_ROT | 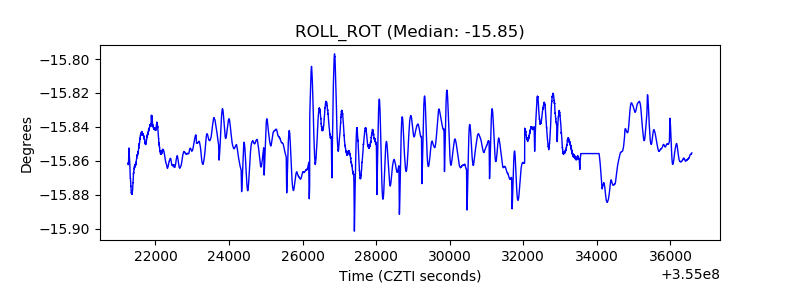 |
| _Roll_DEC | 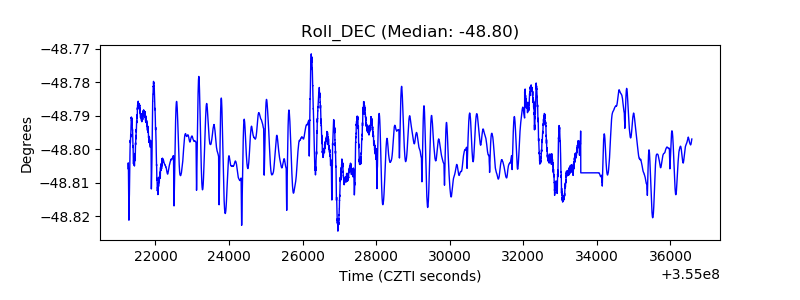 |
| _Roll_RA | 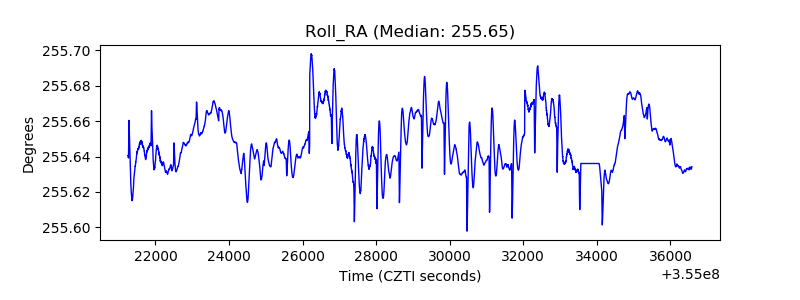 |
| Veto Counter | 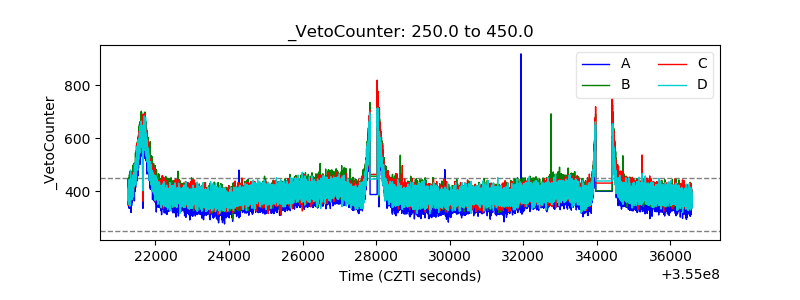 |