| Param | Original file | Final file |
|---|---|---|
| Filename | modeM0/AS1T03_291T01_9000004278_29801cztM0_level2.evt | modeM0/AS1T03_291T01_9000004278_29801cztM0_level2_quad_clean.evt |
| Size (bytes) | 2,396,157,120 | 254,355,840 |
| Size | 2.2 GB | 242.6 MB |
| Events in quadrant A | 10,432,794 | 1,737,898 |
| Events in quadrant B | 17,545,851 | 1,729,187 |
| Events in quadrant C | 10,568,125 | 1,654,426 |
| Events in quadrant D | 32,590,935 | 1,113,884 |
| Mode SS | |||
|---|---|---|---|
| Quadrant | BADHDUFLAG | Total packets | Discarded packets |
| A | 0 | 434 | 0 |
| B | 0 | 434 | 0 |
| C | 0 | 434 | 0 |
| D | 0 | 434 | 0 |
| Mode M0 | |||
|---|---|---|---|
| Quadrant | BADHDUFLAG | Total packets | Discarded packets |
| A | 0 | 44663 | 4 |
| B | 0 | 67083 | 4 |
| C | 0 | 44833 | 4 |
| D | 0 | 111185 | 4 |
| Mode M9 | |||
|---|---|---|---|
| Quadrant | BADHDUFLAG | Total packets | Discarded packets |
| A | 0 | 36 | 0 |
| B | 0 | 36 | 0 |
| C | 0 | 36 | 0 |
| D | 0 | 36 | 0 |
| Quadrant | Total seconds | Saturated seconds | Saturation percentage |
|---|---|---|---|
| A | 21277 | 236 | 1.109179% |
| B | 21278 | 675 | 3.172291% |
| C | 21278 | 469 | 2.204155% |
| D | 21278 | 9055 | 42.555691% |
Noise dominated data is calculated using 1-second bins in cleaned event files. If a bin has >2000 counts, and if more than 50% of those come from <1% of pixels, then it is considered to be noise-dominated and hence unusable.
| Quadrant | # 1 sec bins | Bins with >0 counts | Bins with >2000 counts | High rate bins dominated by noise | Noise dominated (total time) | Noise dominated (detector-on time) | Marked lightcurve |
|---|---|---|---|---|---|---|---|
| A | 24852 | 21281 | 19 | 19 | 0.08% | 0.09% | 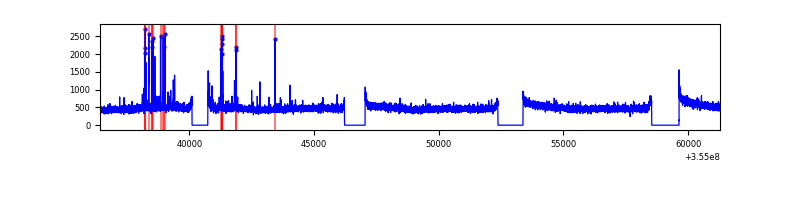 |
| B | 24853 | 21282 | 167 | 167 | 0.67% | 0.78% | 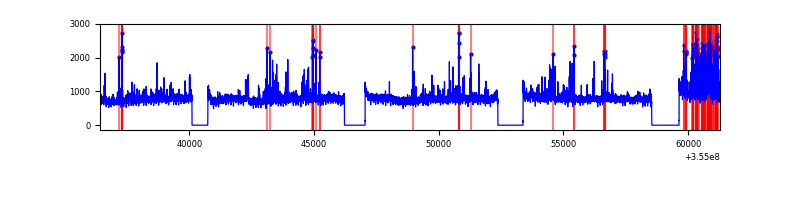 |
| C | 24853 | 21282 | 25 | 25 | 0.10% | 0.12% | 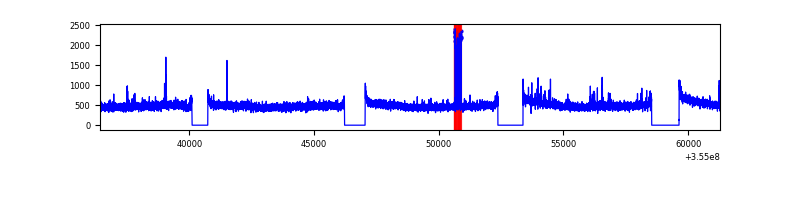 |
| D | 24853 | 21282 | 9012 | 9012 | 36.26% | 42.35% | 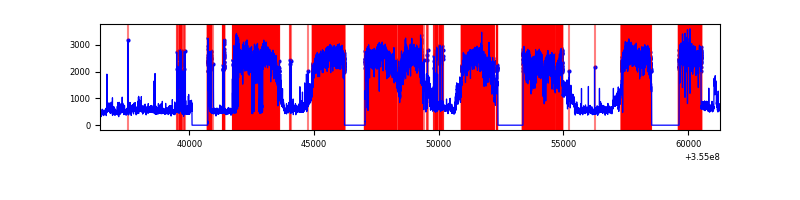 |
Top three noisy pixels from each quadrant. If the there are fewer than three noisy pixels in the level2.evt file, extra rows are filled as -1
| Pixel properties | Quadrant properties | ||||||
|---|---|---|---|---|---|---|---|
| Quadrant | DetID | PixID | Counts | Sigma | Mean | Median | Sigma |
| A | 12 | 96 | 172166 | 322.42 | 2657 | 2601 | 525.9 |
| A | 13 | 254 | 45143 | 80.89 | 2657 | 2601 | 525.9 |
| A | 3 | 137 | 26165 | 44.81 | 2657 | 2601 | 525.9 |
| B | 6 | 159 | 6064393 | 12396.43 | 2605 | 2541 | 489.0 |
| B | 0 | 229 | 593627 | 1208.77 | 2605 | 2541 | 489.0 |
| B | 0 | 189 | 444986 | 904.8 | 2605 | 2541 | 489.0 |
| C | 14 | 238 | 458025 | 775.52 | 2526 | 2544 | 587.3 |
| C | 10 | 22 | 142479 | 238.26 | 2526 | 2544 | 587.3 |
| C | 14 | 254 | 69505 | 114.01 | 2526 | 2544 | 587.3 |
| D | 7 | 238 | 22595129 | 47071.59 | 2035 | 1983 | 480.0 |
| D | 8 | 195 | 1502430 | 3126.1 | 2035 | 1983 | 480.0 |
| D | 7 | 80 | 323612 | 670.1 | 2035 | 1983 | 480.0 |
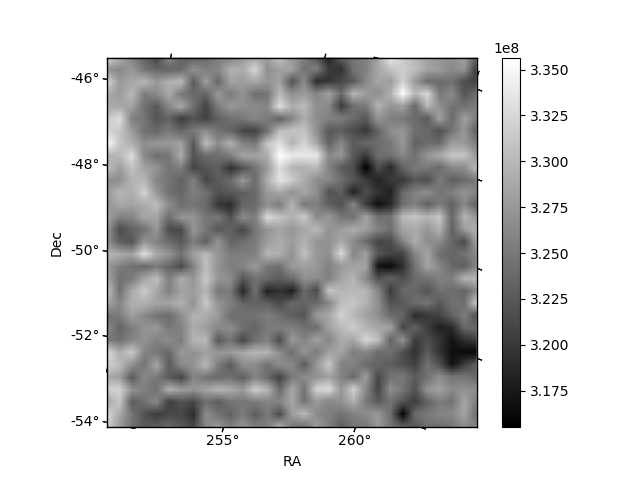
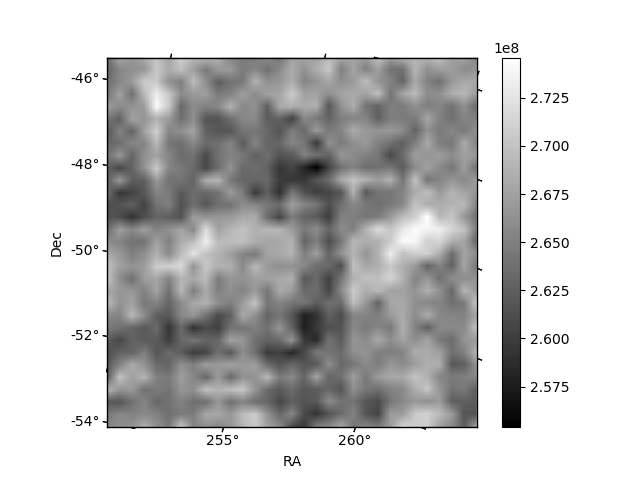
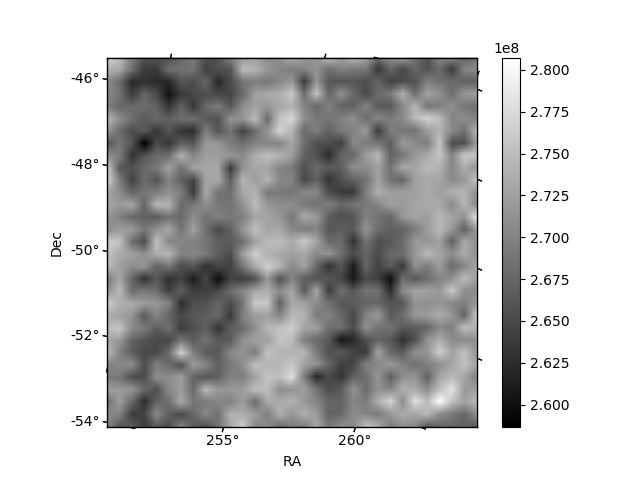
Histogram calculated using DETX and DETY for each event in the final _common_clean file
| Quadrant A | 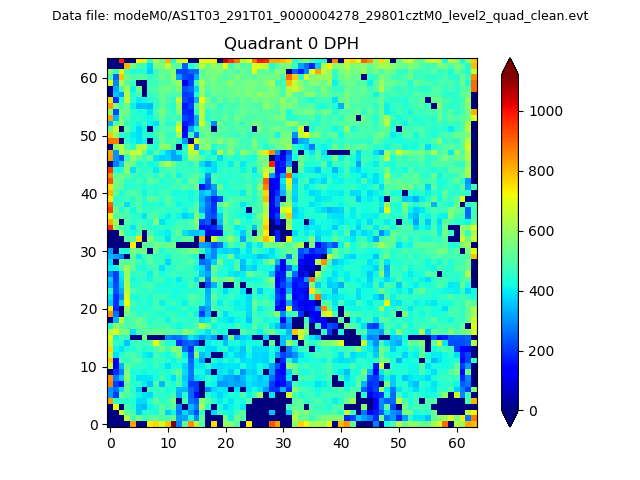 |
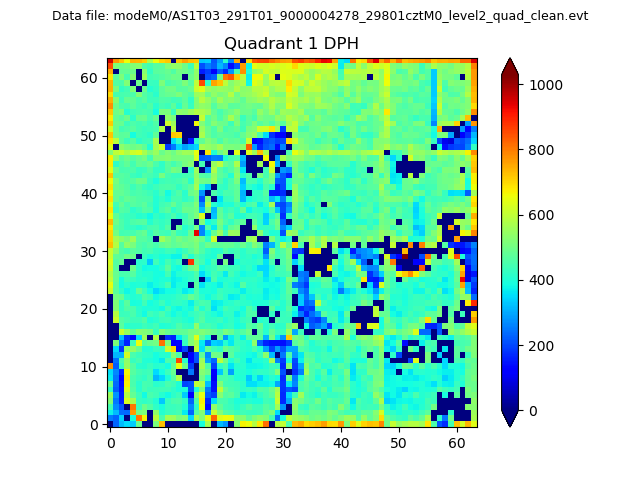 |
Quadrant B |
|---|---|---|---|
| Quadrant D |  |
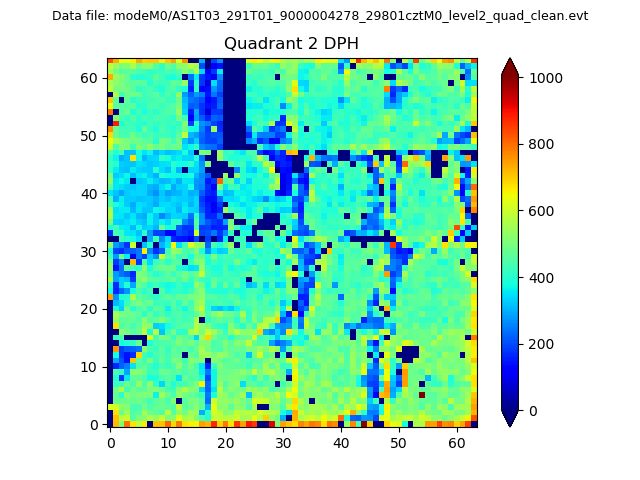 |
Quadrant C |
| Plot type | Count rate plots | Images |
|---|---|---|
| Comparison with Poisson distribution Blue bars denote a histogram of data divided into 1 sec bins. Red curve is a Poisson curve with rate = median count rate of data. |
 |
 |
| Quadrant-wise count rates Data is divided into 100 sec bins |
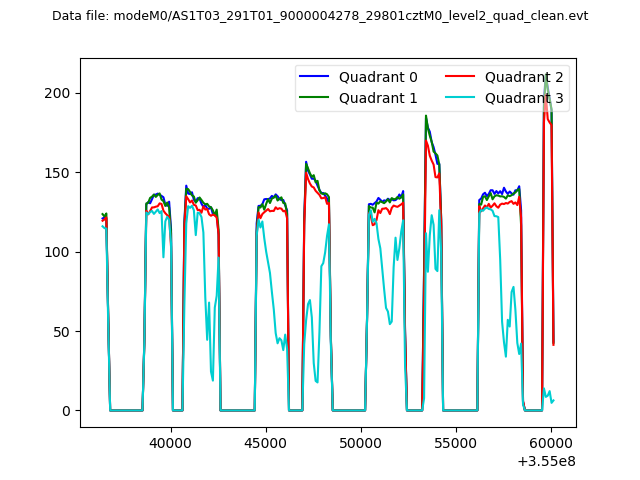 |
|
| Module-wise count rates for Quadrant A Data is divided into 100 sec bins |
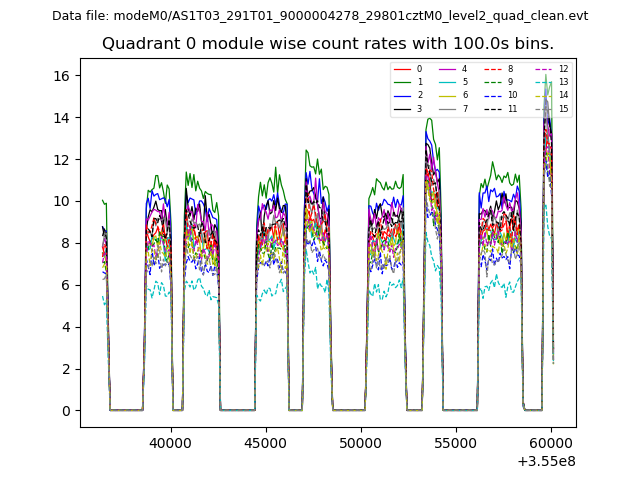 |
 |
| Module-wise count rates for Quadrant B Data is divided into 100 sec bins |
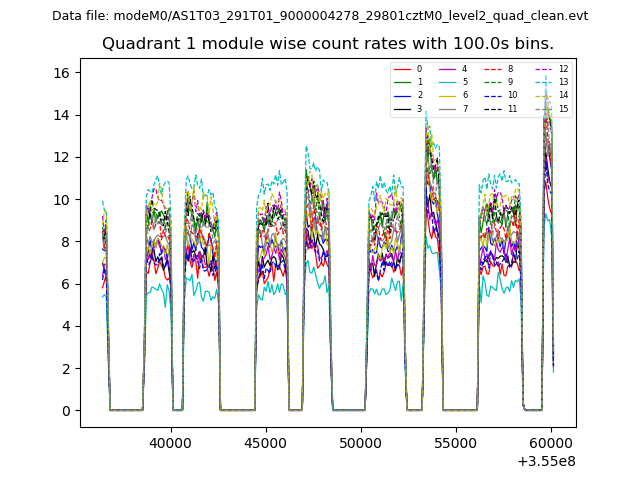 |
 |
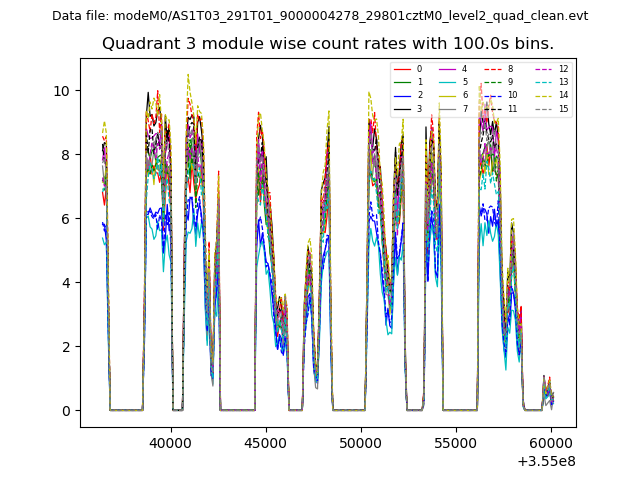
| Module-wise count rates for Quadrant C Data is divided into 100 sec bins |
 |
 |
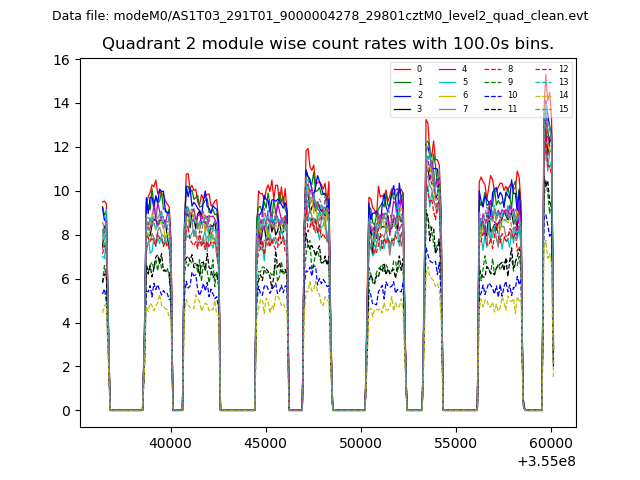
| Module-wise count rates for Quadrant D Data is divided into 100 sec bins |
 |
 |
| Parameter | Plot |
|---|---|
| CZT HV Monitor | 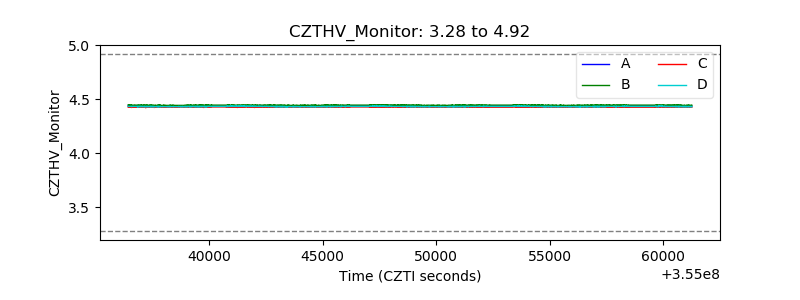 |
| D_VDD | 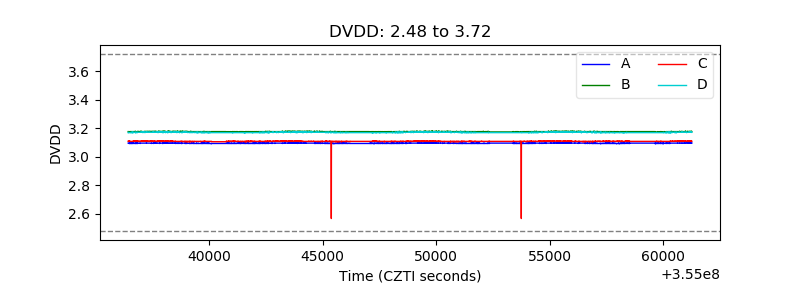 |
| Temperature 1 | 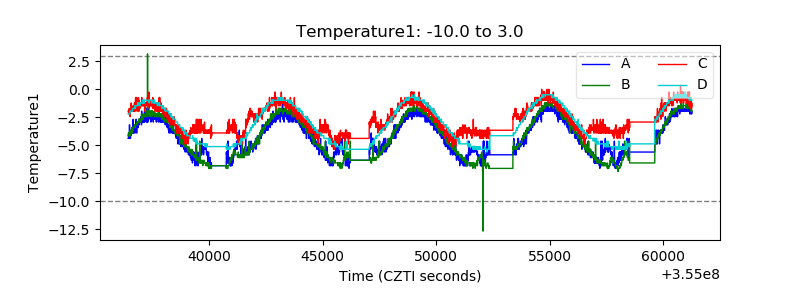 |
| Veto HV Monitor | 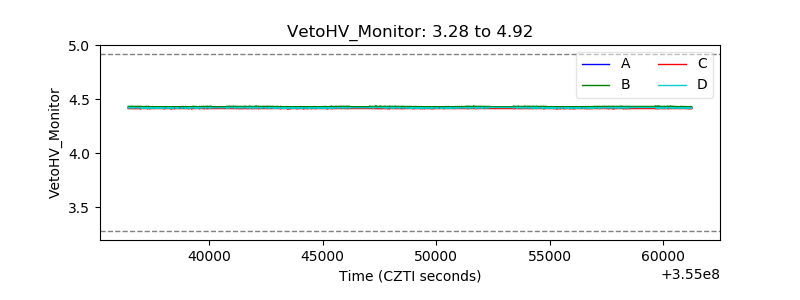 |
| Veto LLD | 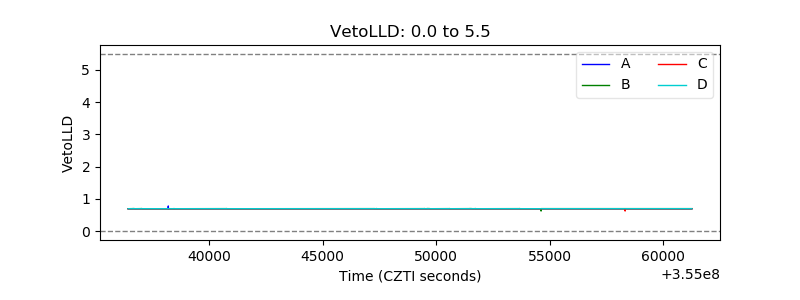 |
| Alpha Counter |  |
| _CPM_Rate | 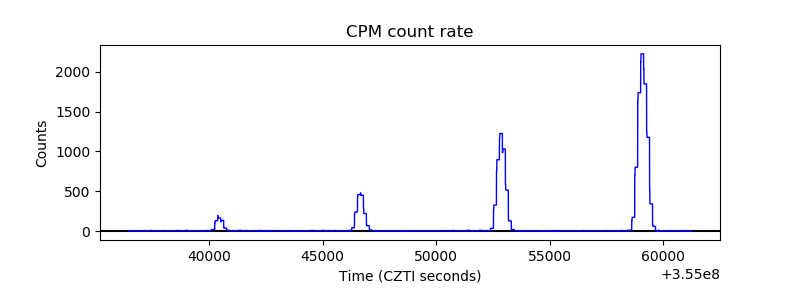 |
| CZT Counter | 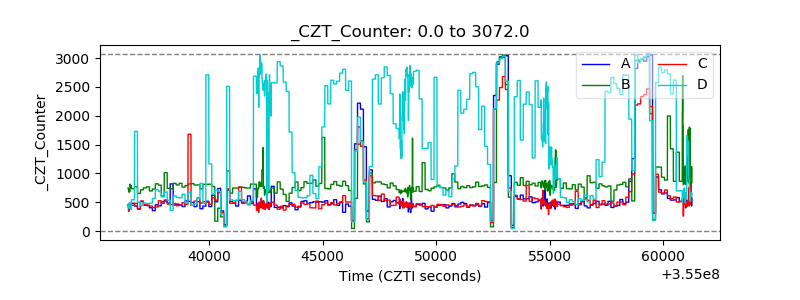 |
| +2.5 Volts monitor |  |
| +5 Volts monitor |  |
| _ROLL_ROT | 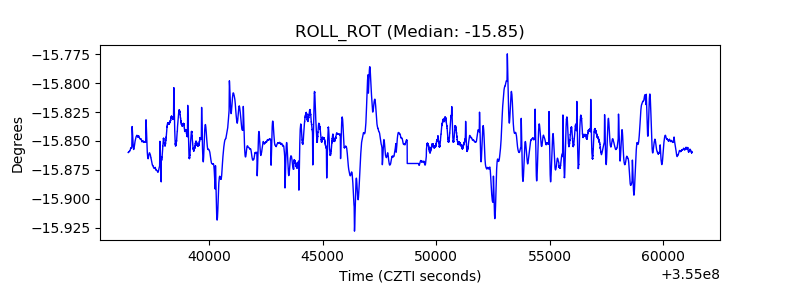 |
| _Roll_DEC | 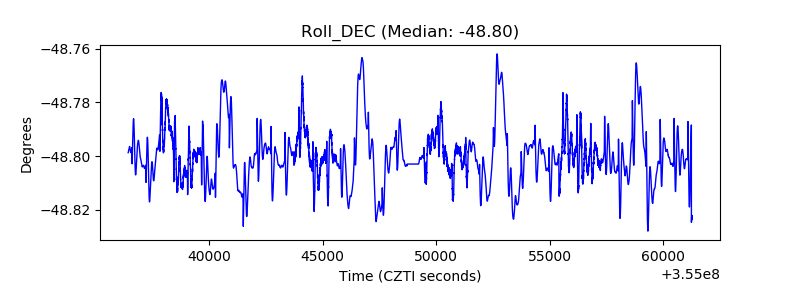 |
| _Roll_RA |  |
| Veto Counter | 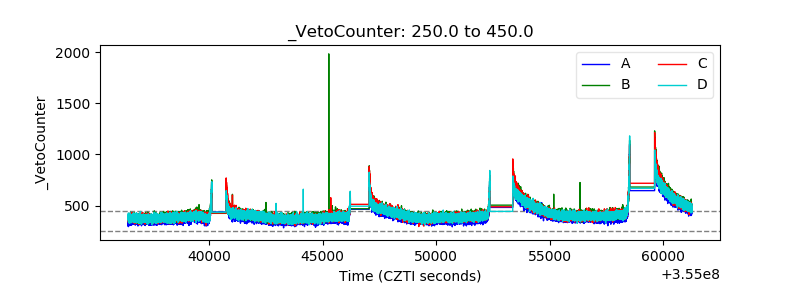 |